Basics in Exercise Physiology and Immunology - Key Concepts, Homeostasis and Hormesis
Table of Contents
- Language & Energetics of Exercise
- Homeostasis: Acute Regulation
- Hormesis: Chronic Adaptation & Clinical Edge
- Intensity Determination & Diagnostics
1 Language & Energetics of Exercise
Learning objectives:
- Definitions of physical activity, exercise, training and sport (Caspersen)
- Components of TDEE and population-appropriate BMR equations
- Units of metabolic strain: V̇O₂, MET and MET-min
1.1 Definition of Physical Activity
Physical activity, in the broadest sense, is every bodily movement performed by skeletal muscles that results in energy expenditure (Caspersen et al., 1985). The following applies: the more intensive the physical activity, the more energy is consumed per unit of time.
The behaviour, the type and intensity of physical activity — characterised by frequency, intensity, duration, mode, and progression — is called exercise, training, or sport in different contexts. Exercise is planned, structured, and repetitive physical activity with the specific goal of improving or maintaining one or more aspects of physical fitness (Caspersen et al., 1985). Here are key differences:
- Physical activity encompasses all body movements in everyday life.
- Exercise represents planned, structured activities with specific goals.
- Training involves systematic exercise for long-term adaptation.
- Sport is competitive physical activity with rules and objectives.
1.2 Energy Expenditure
Energy expenditure comprises several components:
- Basal Metabolic Rate (BMR) — energy required for essential physiological functions at rest.
- Resting Metabolic Rate (RMR) — similar to BMR but measured under less stringent conditions.
- Thermic Effect of Food (TEF) — energy required to digest, absorb, and process nutrients.
- Activity Energy Expenditure (AEE) — energy consumed during physical activity.
The key principle: Total daily energy expenditure (TDEE) = BMR + TEF + AEE + non-exercise thermogenesis (NEAT).
1.2.1 Estimation of Basal Metabolic Rate
Accurate estimation of BMR is a prerequisite for calculating total daily energy expenditure (TDEE) and for designing sport-specific nutrition strategies. Several prediction equations have been developed, differing in their input variables and the populations in which they were validated. The classic Harris–Benedict equations (1918, revised by Roza & Shizgal 1984) estimate BMR from body weight, height, and age separately for males and females (Harris & Benedict, 1918; Roza & Shizgal, 1984). Because these equations were derived from non-athletic populations, they systematically underestimate RMR in individuals with high lean body mass. The Cunningham equation (1980) addresses this limitation by replacing anthropometric proxies with lean body mass (LBM) as the sole predictor, yielding a single sex-independent formula that better captures metabolically active tissue (Cunningham, 1980). Building on Cunningham’s framework, Ten Haaf & Weijs (2014) confirmed its validity in recreational athletes and proposed a slightly revised coefficient set using fat-free mass (FFM) (370 + 21.6 × FFM), along with a weight-based alternative equation for situations where body composition data are unavailable (Ten Haaf & Weijs, 2014). For athletic populations — including strength-trained and endurance athletes — equations incorporating FFM or LBM are generally preferred over weight-based equations, as metabolically active tissue is the primary determinant of resting metabolic rate.
Although the terms lean body mass (LBM) and fat-free mass (FFM) are frequently used interchangeably in the literature, they are subtly but meaningfully distinct concepts. FFM represents everything in the body that is not fat — muscle, bone, organs, water, and connective tissue — and excludes all lipid fractions. LBM, by contrast, retains a small amount of essential fat (~3 % in males, ~12 % in females) that is physiologically indispensable (e.g., phospholipids in cell membranes, myelin sheaths, and steroid hormones) and therefore not metabolically equivalent to storage fat. Consequently, LBM ≥ FFM, with the difference typically amounting to 1–3 kg in healthy adults. This terminological inconsistency has direct relevance for BMR prediction: Cunningham (1980) formulated his equation using LBM, whereas Ten Haaf & Weijs (2014) used FFM as measured by DEXA. Because both authors refitted their respective coefficients to their own datasets, the two formulas are not term-for-term comparable. In practice, however, the resulting error when substituting FFM for LBM (or vice versa) in either equation is clinically negligible for most athletic populations, and both measures are obtained via the same instruments (DEXA, BIA, hydrostatic weighing).
The key conceptual distinctions are summarised in Table 1:
Conceptual comparison of fat-free mass (FFM) and lean body mass (LBM) in the context of BMR prediction equations.
| FFM | LBM | |
|---|---|---|
| Includes essential fat? | No | Yes (~3 % ♂ / ~12 % ♀) |
| Includes storage fat? | No | No |
| Typical value relative to the other | Lower | Higher by ~1–3 kg |
| Typical measurement methods | DEXA, BIA, hydrostatic weighing | Same methods; result is ~2–5 % higher |
| Cunningham (1980) original wording | — | Uses LBM |
| Ten Haaf & Weijs (2014) | Uses FFM | — |
Conceptual comparison of fat-free mass (FFM) and lean body mass (LBM) in the context of BMR prediction equations.
Comparison of Estimation Formulas of Basal Metabolic Rate with special relevance for athletic populations (adapted from Harris & Benedict, 1918; Roza & Shizgal, 1984; Cunningham, 1980; Ten Haaf & Weijs, 2014).
All values in kcal/day. LBM = lean body mass; FFM = fat-free mass; BW = body weight. Note: LBM and FFM are related but not identical — LBM includes a small fraction of essential fat (~3 % in males, ~12 % in females) absent from FFM. Cunningham (1980) used LBM; Ten Haaf & Weijs (2014) used FFM. Both measures are typically obtained via DEXA, BIA, or hydrostatic weighing; substituting one for the other introduces only negligible error in most athletic populations.
| Equation | Year | Formula | Input variables | Validated population |
|---|---|---|---|---|
| Harris–Benedict (original) | 1918 | ♂ BMR = 66.5 + (13.75 × kg) + (5.00 × cm) − (6.76 × age) ♀ BMR = 655.1 + (9.56 × kg) + (1.85 × cm) − (4.68 × age) | Body weight, height, age | Healthy non-athletic adults |
| Harris–Benedict (revised) | 1984 | ♂ BMR = 88.4 + (13.4 × kg) + (4.80 × cm) − (5.68 × age) ♀ BMR = 447.6 + (9.25 × kg) + (3.10 × cm) − (4.33 × age) | Body weight, height, age | Hospitalised & healthy adults |
| Cunningham | 1980 | RMR = 500 + (22 × LBM) | Lean body mass (kg) | Healthy adults; applicable to athletes |
| Ten Haaf & Weijs (FFM-based) | 2014 | REE = 370 + (21.6 × FFM) | Fat-free mass (kg) | Recreational athletes (18–35 y) |
| Ten Haaf & Weijs (weight-based) | 2014 | REE = (25.9 × BW) − 284 | Body weight (kg) | Recreational athletes (18–35 y); no body composition data required |
Comparison of Estimation Formulas of Basal Metabolic Rate with special relevance for athletic populations (adapted from Harris & Benedict, 1918; Roza & Shizgal, 1984; Cunningham, 1980; Ten Haaf & Weijs, 2014).
All values in kcal/day. LBM = lean body mass; FFM = fat-free mass; BW = body weight. Note: LBM and FFM are related but not identical — LBM includes a small fraction of essential fat (~3 % in males, ~12 % in females) absent from FFM. Cunningham (1980) used LBM; Ten Haaf & Weijs (2014) used FFM. Both measures are typically obtained via DEXA, BIA, or hydrostatic weighing; substituting one for the other introduces only negligible error in most athletic populations.
1.2.2 Total Energy Expenditure across the Human Life Course
Beyond resting metabolism, understanding how total energy expenditure (TEE) changes across the lifespan is fundamental for contextualising BMR within a broader metabolic framework. A landmark large-scale study published in Science (Pontzer et al., 2021) (Pontzer et al., 2021) demonstrated that TEE is strongly determined by fat-free mass (muscle mass) and follows a distinct age-related trajectory. Using doubly labelled water data from over 6,400 individuals across 29 countries (aged 8 days to 95 years), the authors identified four distinct metabolic phases across the human lifespan (Rhoads & Anderson, 2021):
- Infancy and childhood (0–20 years): TEE adjusted for FFM rises sharply during infancy, peaks in early childhood (~1 year of age at ~50 % above adult levels), then progressively declines through adolescence.
- Adulthood plateau (20–60 years): A stable phase in which TEE adjusted for FFM remains essentially constant, independent of sex or reproductive status. Notably, sex differences in TEE disappear once FFM is accounted for — females do not have inherently lower metabolic rates than males when lean tissue mass is controlled.
- Late-life decline (> 60 years): A second declining phase begins around age 60, independent of changes in body composition or physical activity levels, reflecting a genuine reduction in tissue-level metabolic rate.
- Clinical relevance: The marked rise in incidence of chronic disease from late middle age closely aligns with the shift in TEE and progressive loss of adiposity, suggesting that metabolism may be a driver in ageing biology rather than merely a passive correlate (Pontzer et al., 2021; Rhoads & Anderson, 2021).
These findings have direct implications for BMR prediction in exercise and sports science contexts: equations validated in young athletic adults (e.g. Ten Haaf & Weijs, 2014) may systematically overestimate REE in masters athletes or older recreational exercisers, for whom age-related reductions in both FFM and tissue-specific metabolic rates must be considered.
- Pontzer et al. (2021) — Daily energy expenditure through the human life course (Science)
- Rhoads & Anderson (2021) — Taking the long view on metabolism (Science)
1.2.3 Online Calculators
The following tools allow students and practitioners to apply BMR/RMR prediction equations interactively without manual calculation. The USDA Dietary Reference Intakes (DRI) Calculator provides evidence-based energy and nutrient estimates for a wide range of age groups and activity levels, drawing on the equations recommended by the National Academies of Medicine. The Cunningham RMR Calculator by Peter Bond implements the Cunningham (1980) equation directly, requiring only a fat-free mass estimate — making it particularly useful for athletes and individuals with known body composition data.
1.3 Metabolic Strain and Physiological Responses
Physical activity exerts a metabolic strain on the organism. The physiological strain depends on:
- Type of activity — aerobic vs. anaerobic, resistance vs. endurance.
- Intensity — measured as % of V̇O₂max or % of maximal heart rate.
- Duration — single bout vs. cumulative effects.
- Frequency — how often the activity is performed.
- Individual factors — age, fitness level, health status.
The organism responds to metabolic strain through acute physiological adjustments (heart rate increase, breathing rate increase) and chronic adaptations (mitochondrial biogenesis, improved capillary density).
1.4 Physical Performance, Activity and Behaviour
From a biological point of view, movement is a vital skill enabling physical performance, physical activity, and behaviour. A minimum level of physical fitness is required to be physically active. Physical performance and physical activity are the main determining factors for behaviour in everyday life, at work, and in leisure time.
1.5 Oxygen — Essential for Energy Supply
Oxygen (O₂) is essential for the energy supply of cells. A prolonged lack of O₂ — usually the result of a circulatory disorder — initially leads to functional failures and later to irreversible cell and organ damage. There are no significant oxygen stores in cells, and oxygen-independent metabolism is insufficient for energy requirements. Therefore, sufficient O₂ must be constantly supplied via the circulatory system.
O₂ utilisation by organ:
- Kidneys: ~25 % O₂ utilisation
- Cerebral cortex, skeletal muscles, myocardium (rest): 40–60 %
- Working skeletal muscles and myocardium (heavy exercise): up to ~90 %
During exercise, O₂ consumption of cardiac muscle tissue increases 3–4 times above resting conditions; working skeletal muscle groups increase to more than 20–50 times the resting value.
Adaptation to O₂ deficiency: Depending on duration and extent, O₂ deficiency leads to limitations in organ function or cell death. In neurons, irreversible damage occurs after less than 10 minutes of anoxia; in skeletal muscles only after several hours. For the whole organism, the resuscitation time is approximately 4 minutes at normal body temperature.
Too much oxygen can be harmful — oxygen radicals damage cell membranes, enzymes and DNA. Reactive oxygen species continuously formed in cells play an important role as signalling molecules at low concentrations but cause cell damage at high concentrations.
1.6 V̇O₂ and Daily Behaviour
Any type of physical activity and therefore behaviour requires energy. The amount of oxygen required for energy metabolism is supplied via pulmonary respiration and transported via blood to organs such as skeletal muscles.
Exercise-intensity zones by V̇O₂ (ACSM).
| Intensity Level | V̇O₂ (mL·kg⁻¹·min⁻¹) |
|---|---|
| Very light | < 7.0 |
| Light | ≥ 7.0 and < 10.5 |
| Moderate | ≥ 10.5 and < 21.0 |
| Vigorous | ≥ 21.0 and < 30.8 |
| Near-maximal to maximal | ≥ 30.8 |
Exercise-intensity zones by V̇O₂ (ACSM).
1.7 V̇O₂ as a Measure of Energy Expenditure
Oxygen uptake provides information about the energy requirements and energy consumption of the organism. When providing energy, oxygen consumption depends on the type of energy source: fats require more oxygen to burn than carbohydrates or proteins, resulting in different physiological calorific values.
1.8 MET — Metabolic Equivalents of Task
1.8.1 Physical Activity Levels
The metabolic equivalent (MET) is an index of energy expenditure. One MET is the rate of EE while sitting at rest; by scientific convention, 1 MET = 3.5 mL·kg⁻¹·min⁻¹ O₂ uptake = 1 kcal·kg·h⁻¹ body weight.
Physical-activity levels by MET (Compendium).
| PA Level | MET range |
|---|---|
| Sedentary behaviour | 1.0–1.5 |
| Light | 1.6–2.9 |
| Moderate | 3.0–5.9 |
| Vigorous | ≥ 6 |
Physical-activity levels by MET (Compendium).
1.8.2 What Is MET?
1 MET corresponds to 3.5 mL·kg⁻¹·min⁻¹. Most source studies catalogued in the 2011 Compendium reported energy costs as either V̇O₂ (mL·kg⁻¹·min⁻¹) or MET using 3.5 as the denominator. There are differences between the standard denominator and the real RMR. For an individual with a predicted RMR = 2.8 mL·kg⁻¹·min⁻¹, the corrected MET would be 3.5/2.8 = 125 % of Compendium values.
1.8.3 MET ≠ MET?
1 MET is not always the same amount of V̇O₂. The standard 3.5 mL·kg⁻¹·min⁻¹ is a convention; individual resting metabolic rate differs. The Compendium MET level for any PA can be multiplied by the ratio (standard MET / individual predicted RMR) for individual correction.
1.9 MET-min
MET-minutes quantify the total amount of physical activity performed in a standardised manner. Calculated as: METs × duration in minutes.
Example: Jogging at 7 METs for 30 min on 3 days/week = 7 × 30 × 3 = 630 MET·min·wk⁻¹
MET-minutes are usually standardised per week or per day and used in physical activity guidelines and epidemiological studies.
One-Minute-Paper Topics
A One-Minute-Paper (OMP) is a short, focused prompt that students answer in ~60 seconds at the end of a session to consolidate learning, surface misconceptions, and provide formative feedback. When answering, be concise, specific, and use terminology from today’s session.
- What is the key distinction between “physical activity” and “exercise” according to Caspersen et al., and why does this distinction matter for public health recommendations?
- Name the four components of TDEE (BMR, RMR, TEF, AEE/NEAT) and explain which one is most modifiable through lifestyle behaviour.
Key References
- Caspersen CJ, Powell KE, Christenson GM. Physical activity, exercise, and physical fitness: definitions and distinctions for health-related research. Public Health Reports. 1985;100(2):126–131. ISSN 0033-3549.
- Cunningham JJ. A reanalysis of the factors influencing basal metabolic rate in normal adults. The American Journal of Clinical Nutrition. 1980;33(11):2372–2374. doi:10.1093/ajcn/33.11.2372.
- Harris JA, Benedict FG. A biometric study of human basal metabolism. Proceedings of the National Academy of Sciences. 1918;4(12):370–373. doi:10.1073/pnas.4.12.370.
- Pontzer H, Yamada Y, Sagayama H, et al. Daily energy expenditure through the human life course. Science. 2021;373(6556):808–812. doi:10.1126/science.abe5017.
- Rhoads TW, Anderson RM. Taking the long view on metabolism. Science. 2021 Aug 13;373(6556):738–739. doi:10.1126/science.abl4537. PMID: 34385381.
- Roza AM, Shizgal HM. The Harris Benedict equation reevaluated: resting energy requirements and the body cell mass. The American Journal of Clinical Nutrition. 1984;40(1):168–182. doi:10.1093/ajcn/40.1.168.
- Ten Haaf T, Weijs PJM. Resting energy expenditure prediction in recreational athletes of 18–35 years: confirmation of Cunningham equation and an improved weight-based alternative. PLOS ONE. 2014;9(9):e108460. doi:10.1371/journal.pone.0108460.
2 Homeostasis: Acute regulation
Learning objectives:
- The perturbation → correction → recovery loop for heart rate and ventilation
- Cardiovascular, respiratory, metabolic and thermoregulatory adjustments as homeostatic corrections
- O₂ transport and pulmonary gas exchange as the rationale behind them
2.1 Concept of Homeostasis
Homeostasis refers to the dynamic equilibrium of the internal environment, maintained through regulatory mechanisms that counteract disturbances. Physical activity is a significant disturbance to homeostasis, triggering rapid regulatory responses.
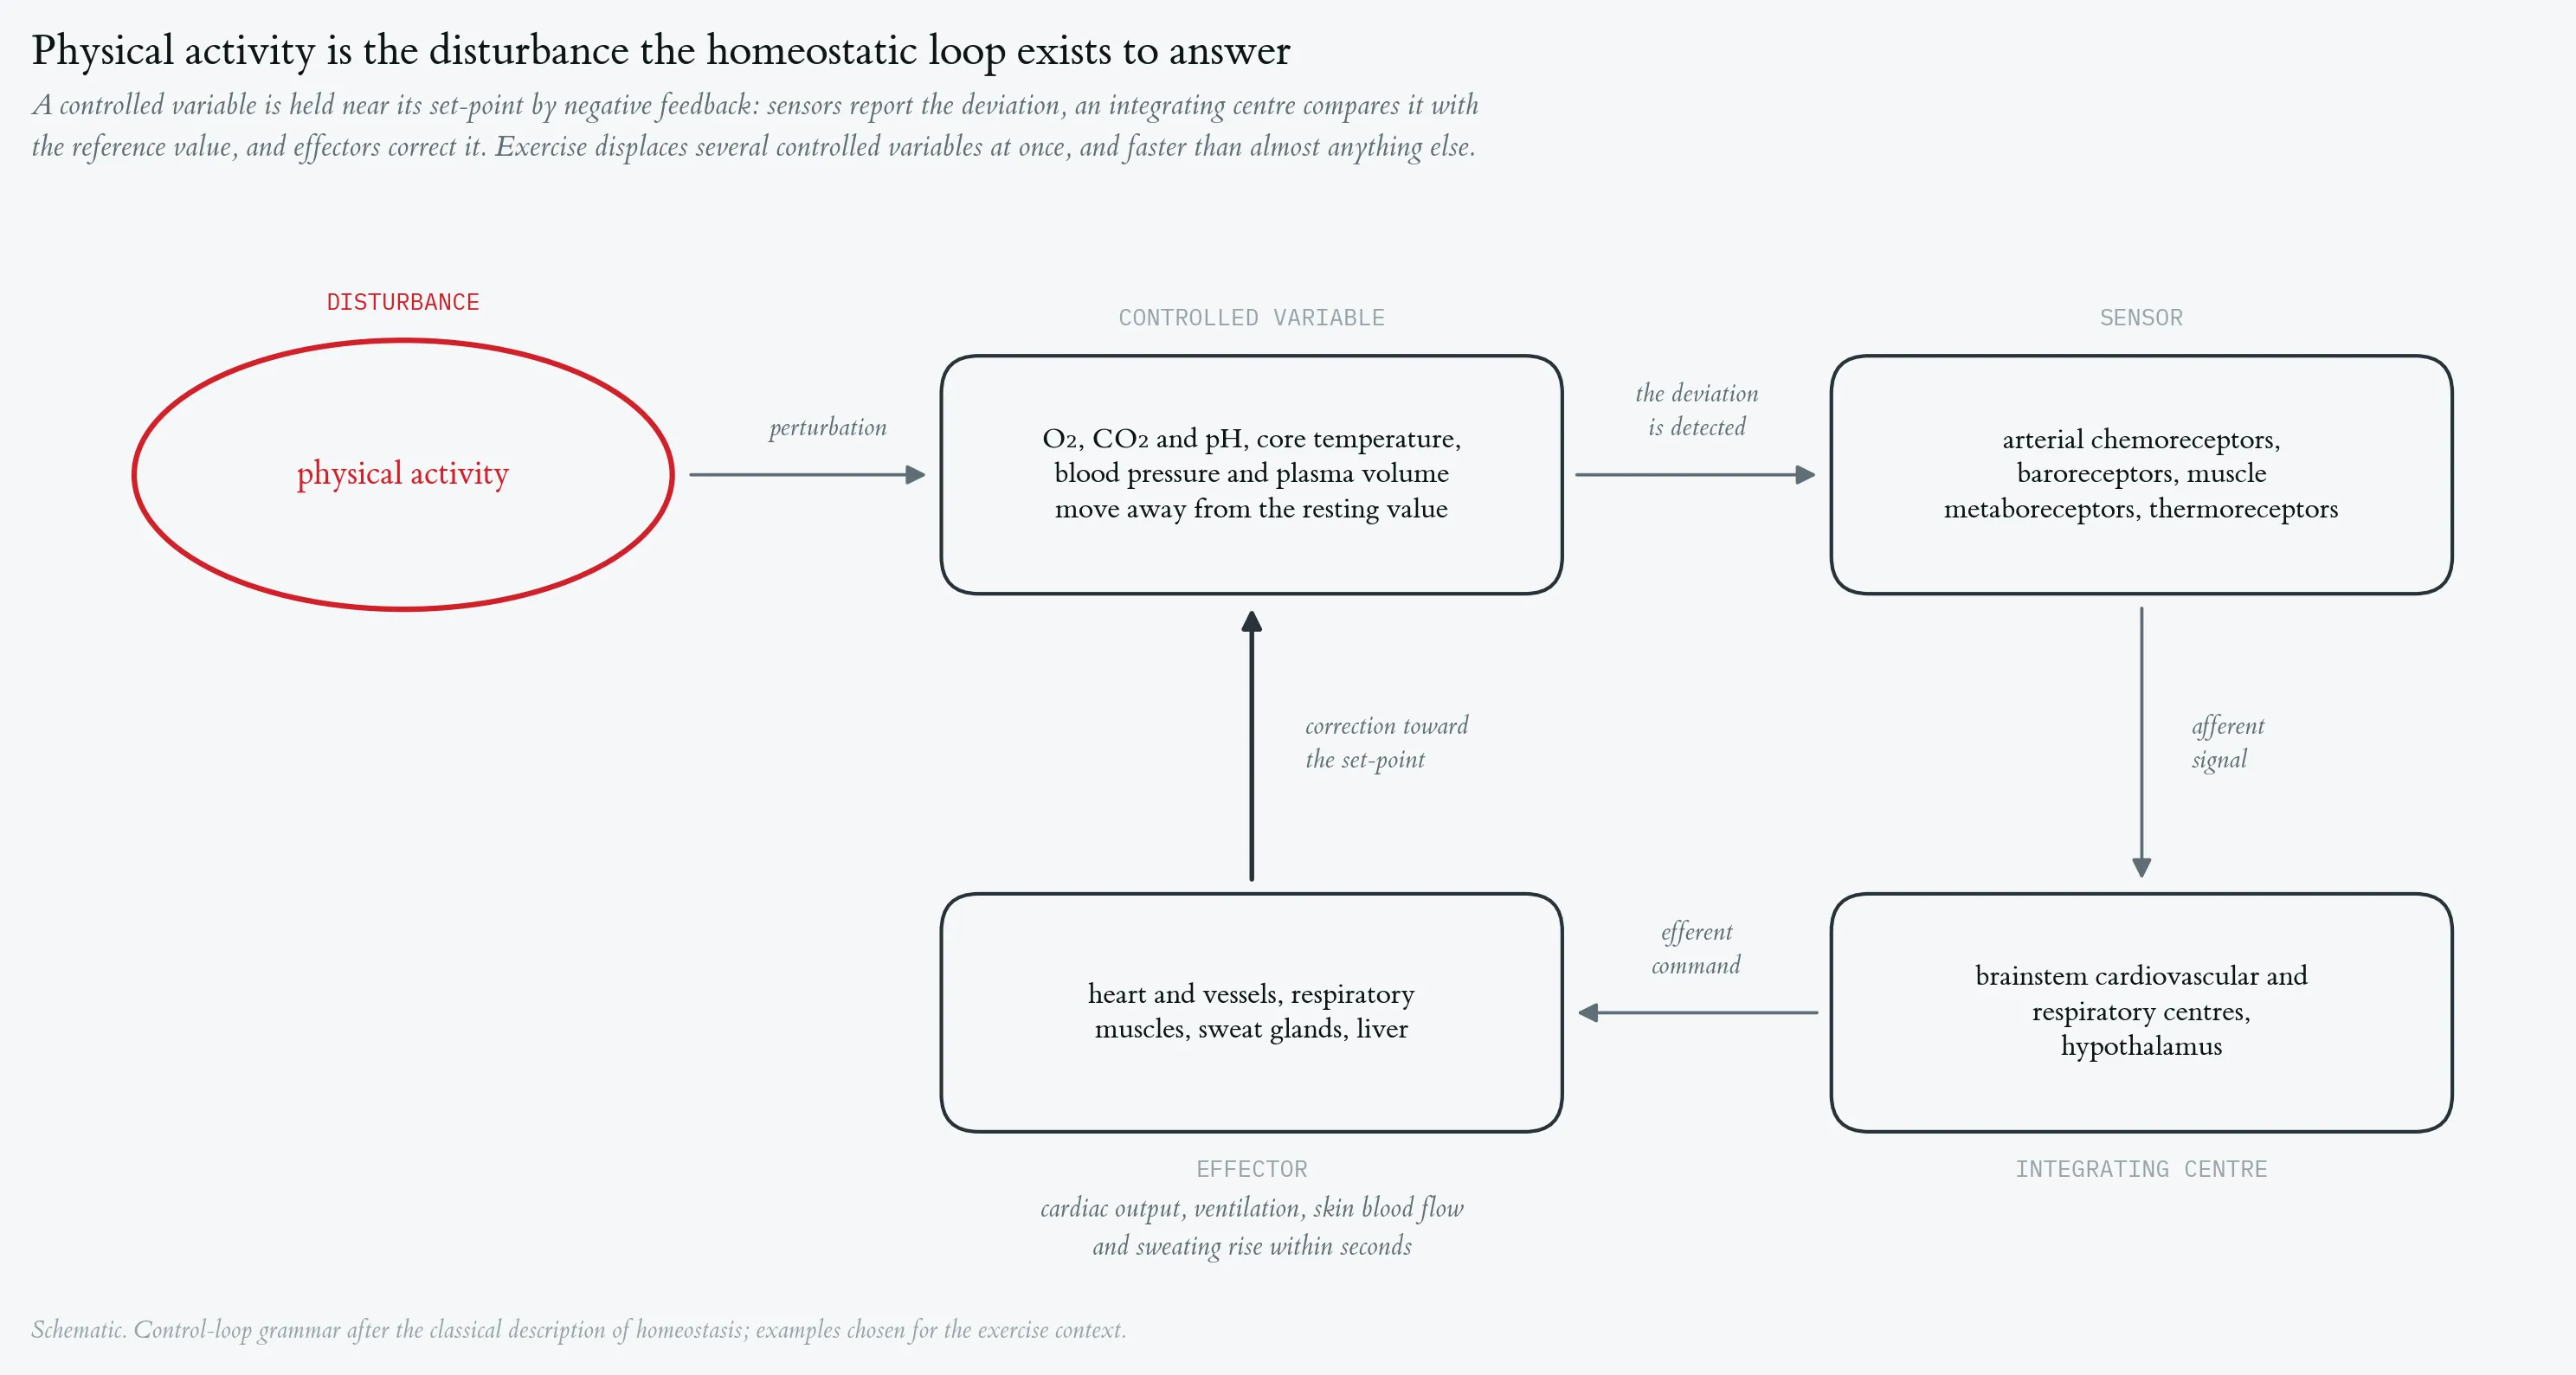
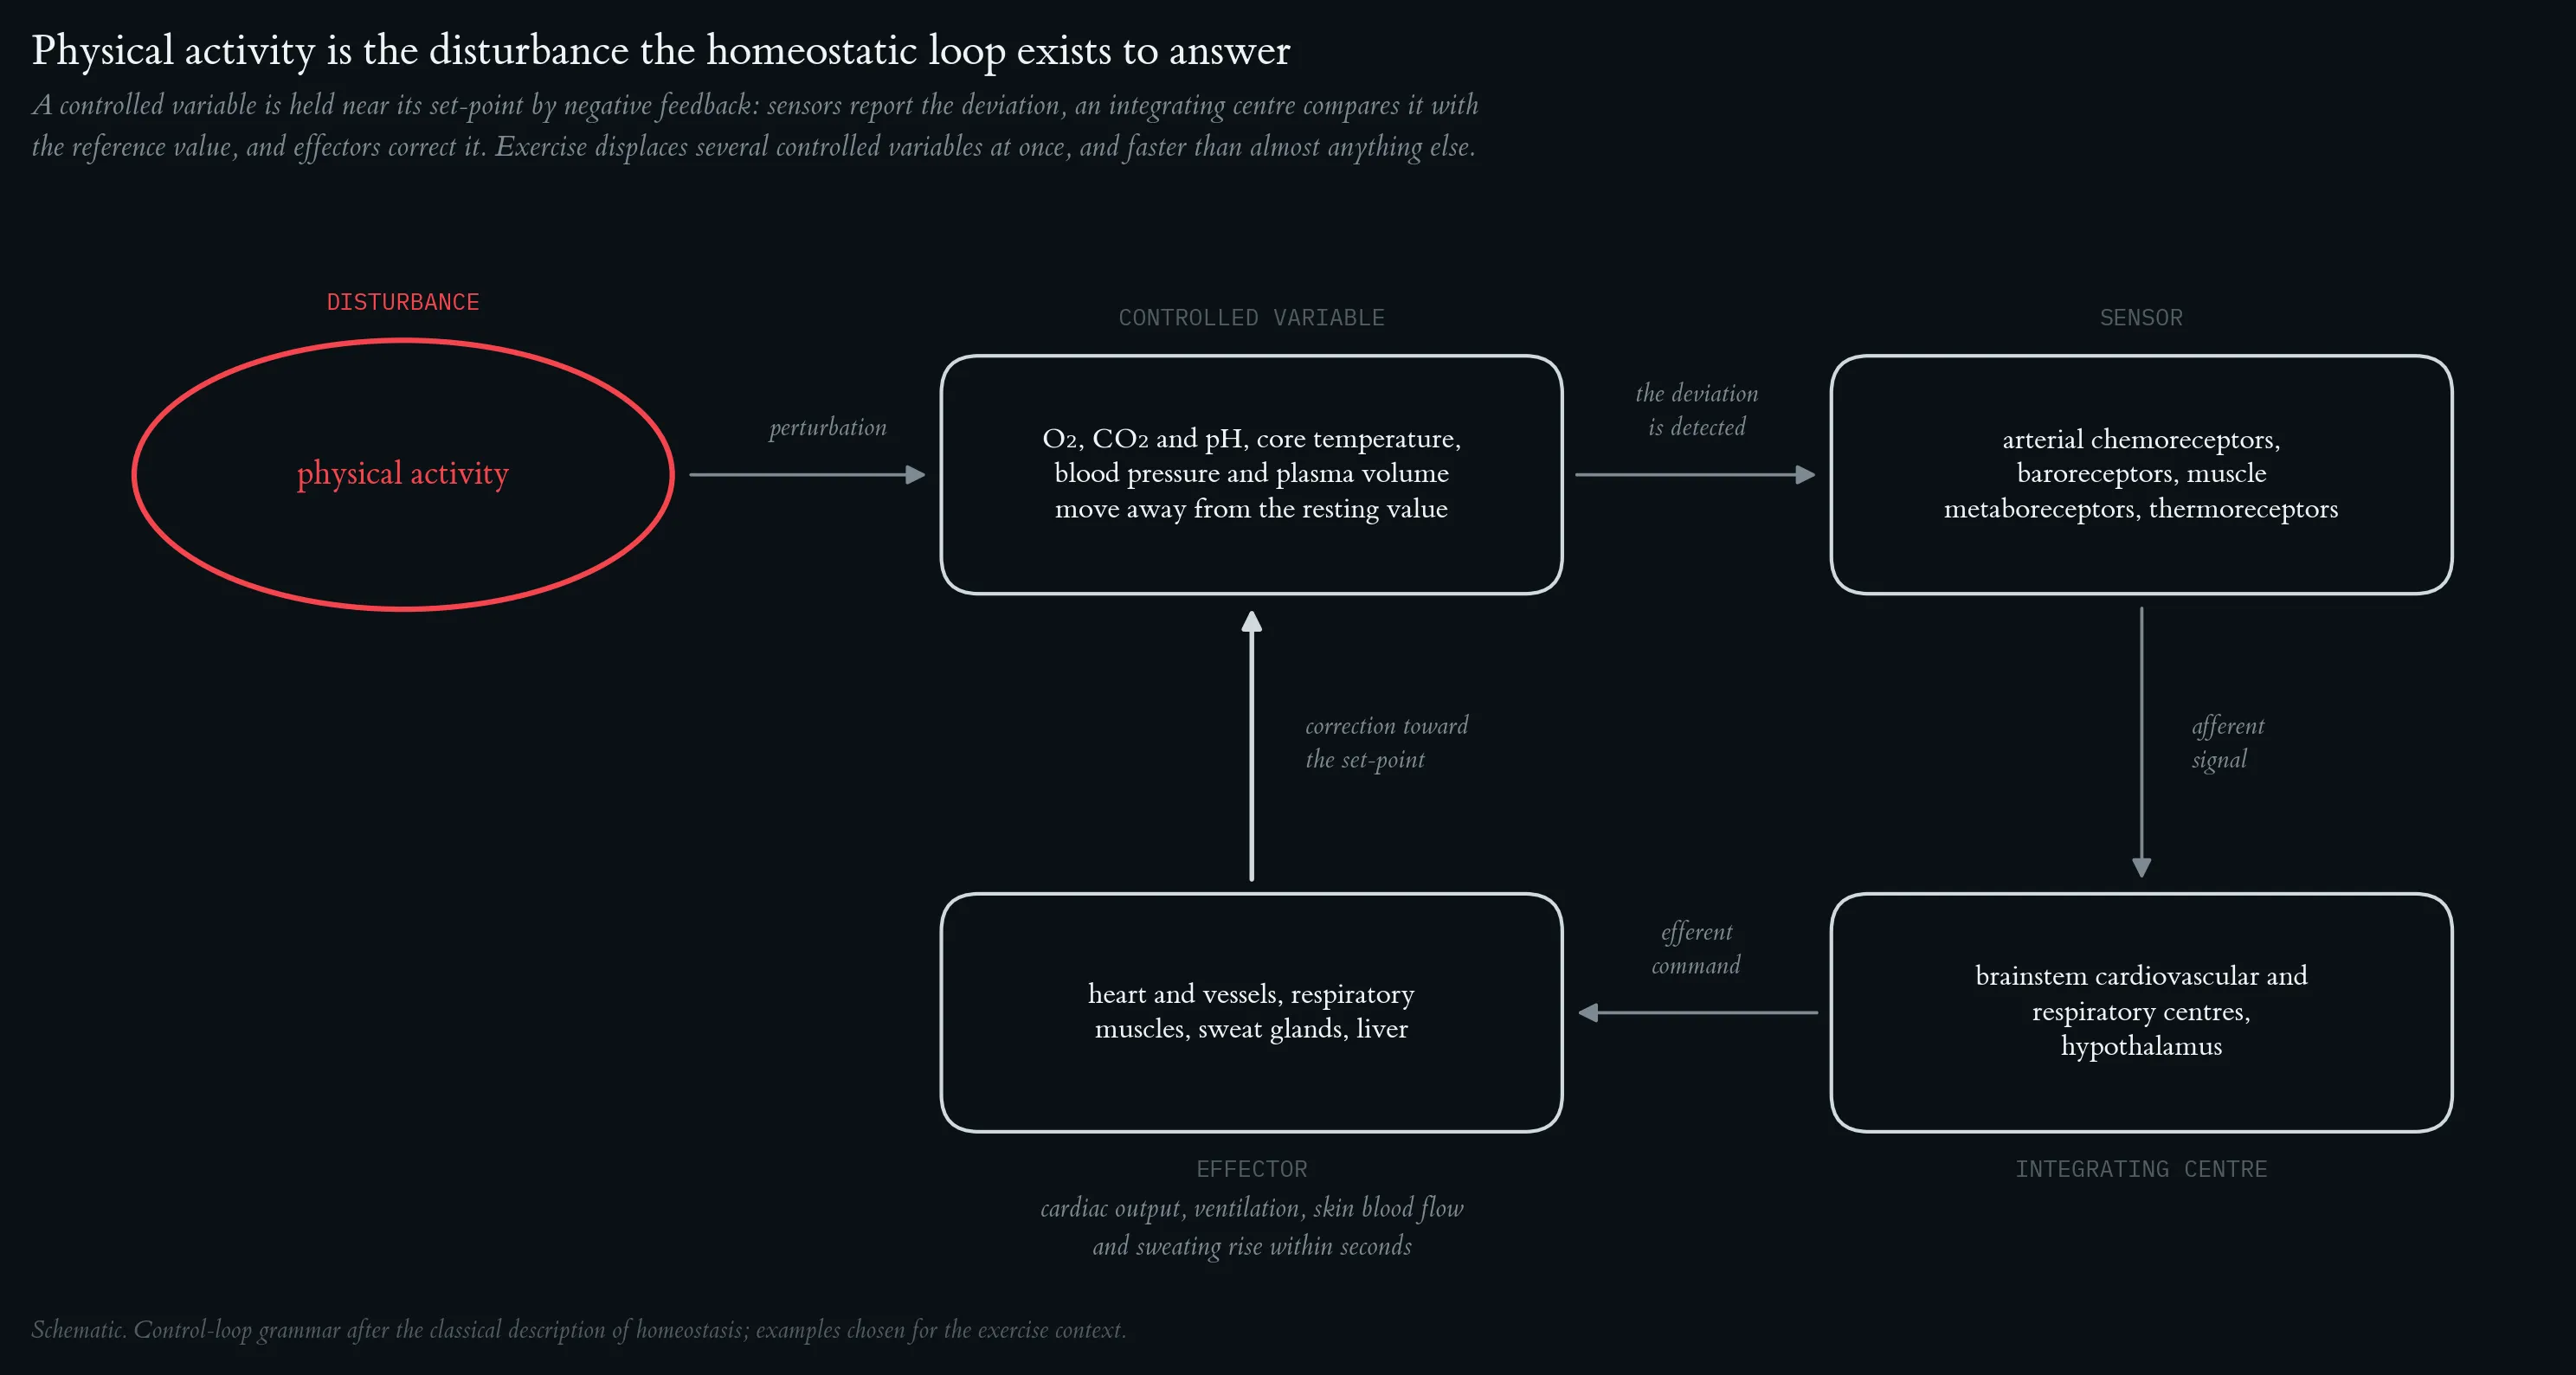
Homeostasis refers to the dynamic equilibrium of the internal environment, maintained through regulatory mechanisms that counteract disturbances. Physical activity is a significant disturbance to homeostasis, triggering rapid regulatory responses.
2.2 Acute Responses to Exercise
Acute physical stress, for example through physical activity, leads to a disruption of homeostasis. The disruption of homeostasis is rebalanced by physiological mechanisms and returns to a state of rest. For example, physical exertion leads to increased breathing in order to absorb more oxygen. In order for the oxygen in the blood to be transported to the muscles, the blood circulation must be increased. In order for the blood circulation to increase, the duration of the heartbeats must be shortened with a simultaneous increase in the stroke volume. In order to increase ventilation, the depth of the breath and the respiratory rate must be increased. The increase in circulation and ventilation leads to increased oxygen intake in the organism. Ventilation and duration of heart beats are typical physiological parameters to describe the functions of the respiratory and cardiovascular system
When the organism engages in physical activity, multiple physiological systems are activated simultaneously.
The figures in this section follow one such disturbance through a single measurement. A healthy male recreational athlete (23 years, 176 cm, 69 kg, BMI 22.3 kg · m⁻², general training background) performed a maximal incremental step test on a cycle ergometer, with the external work rate incremented by 50 W every three minutes from 50 W to a final 300 W stage that was terminated after 30 s at volitional exhaustion (peak 4.3 W · kg⁻¹). The lactate-based reference loads for this test are an aerobic threshold of 117 W and an individual anaerobic threshold of 145 W. Every recording is structured as an ABA protocol: phase A1 baseline rest, phase B the step test, and phase A2 passive recovery — the perturbation → correction → recovery loop made measurable.
Cardiorespiratory response to a maximal incremental step test, with mass-related oxygen uptake. Top strip: external work rate, incremented by 50 W every three minutes from 50 W to a final 300 W stage terminated after 30 s at volitional exhaustion. Phases are A1 baseline rest, B step test (red) and A2 passive recovery; vertical hairlines mark the two transitions. (A) Heart rate, beat-to-beat recording averaged in 10-s bins, rising from 51 to 187 bpm. (B) Ventilation (V̇E), rising from about 6 l · min⁻¹ at rest to 122.8 l · min⁻¹ at the end of the final stage, with a peak of 127.8 l · min⁻¹ ten seconds after load offset. (C) Mass-related oxygen uptake, V̇O₂ per body mass (69 kg), in ml · min⁻¹ · kg⁻¹. All three series are 10-s averages (197 samples, recording started 6.8 min before load onset).
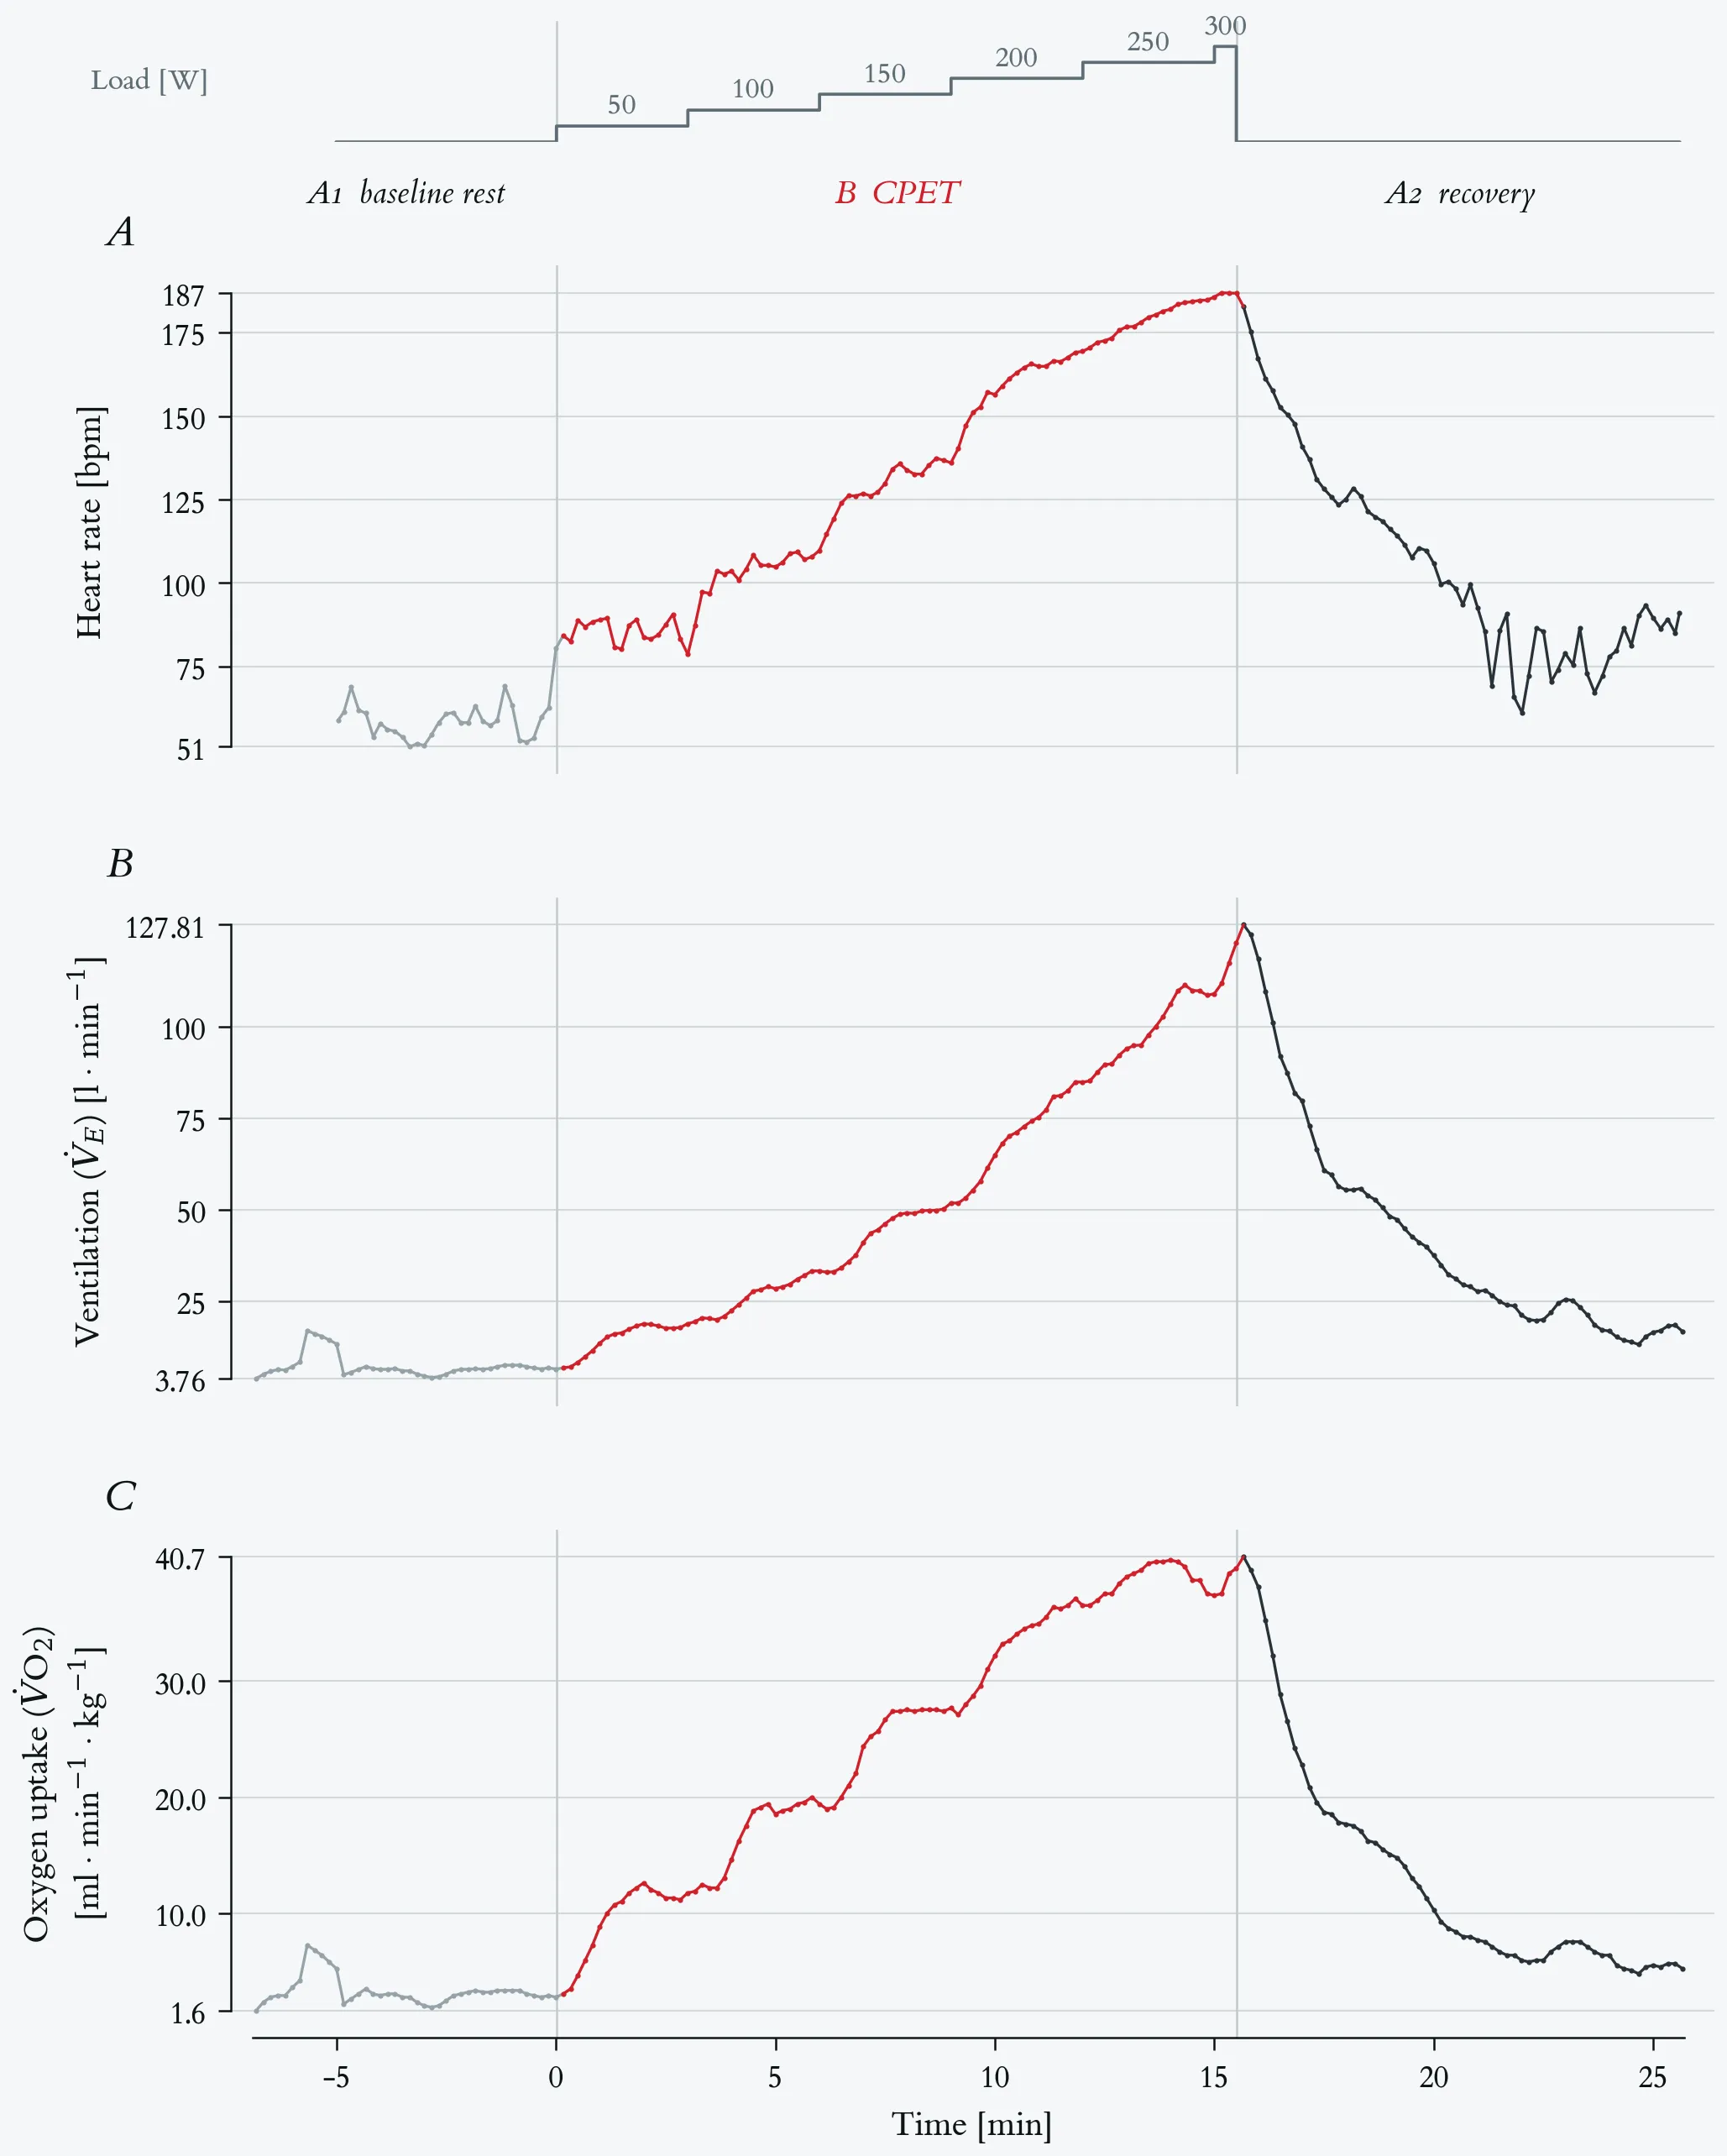
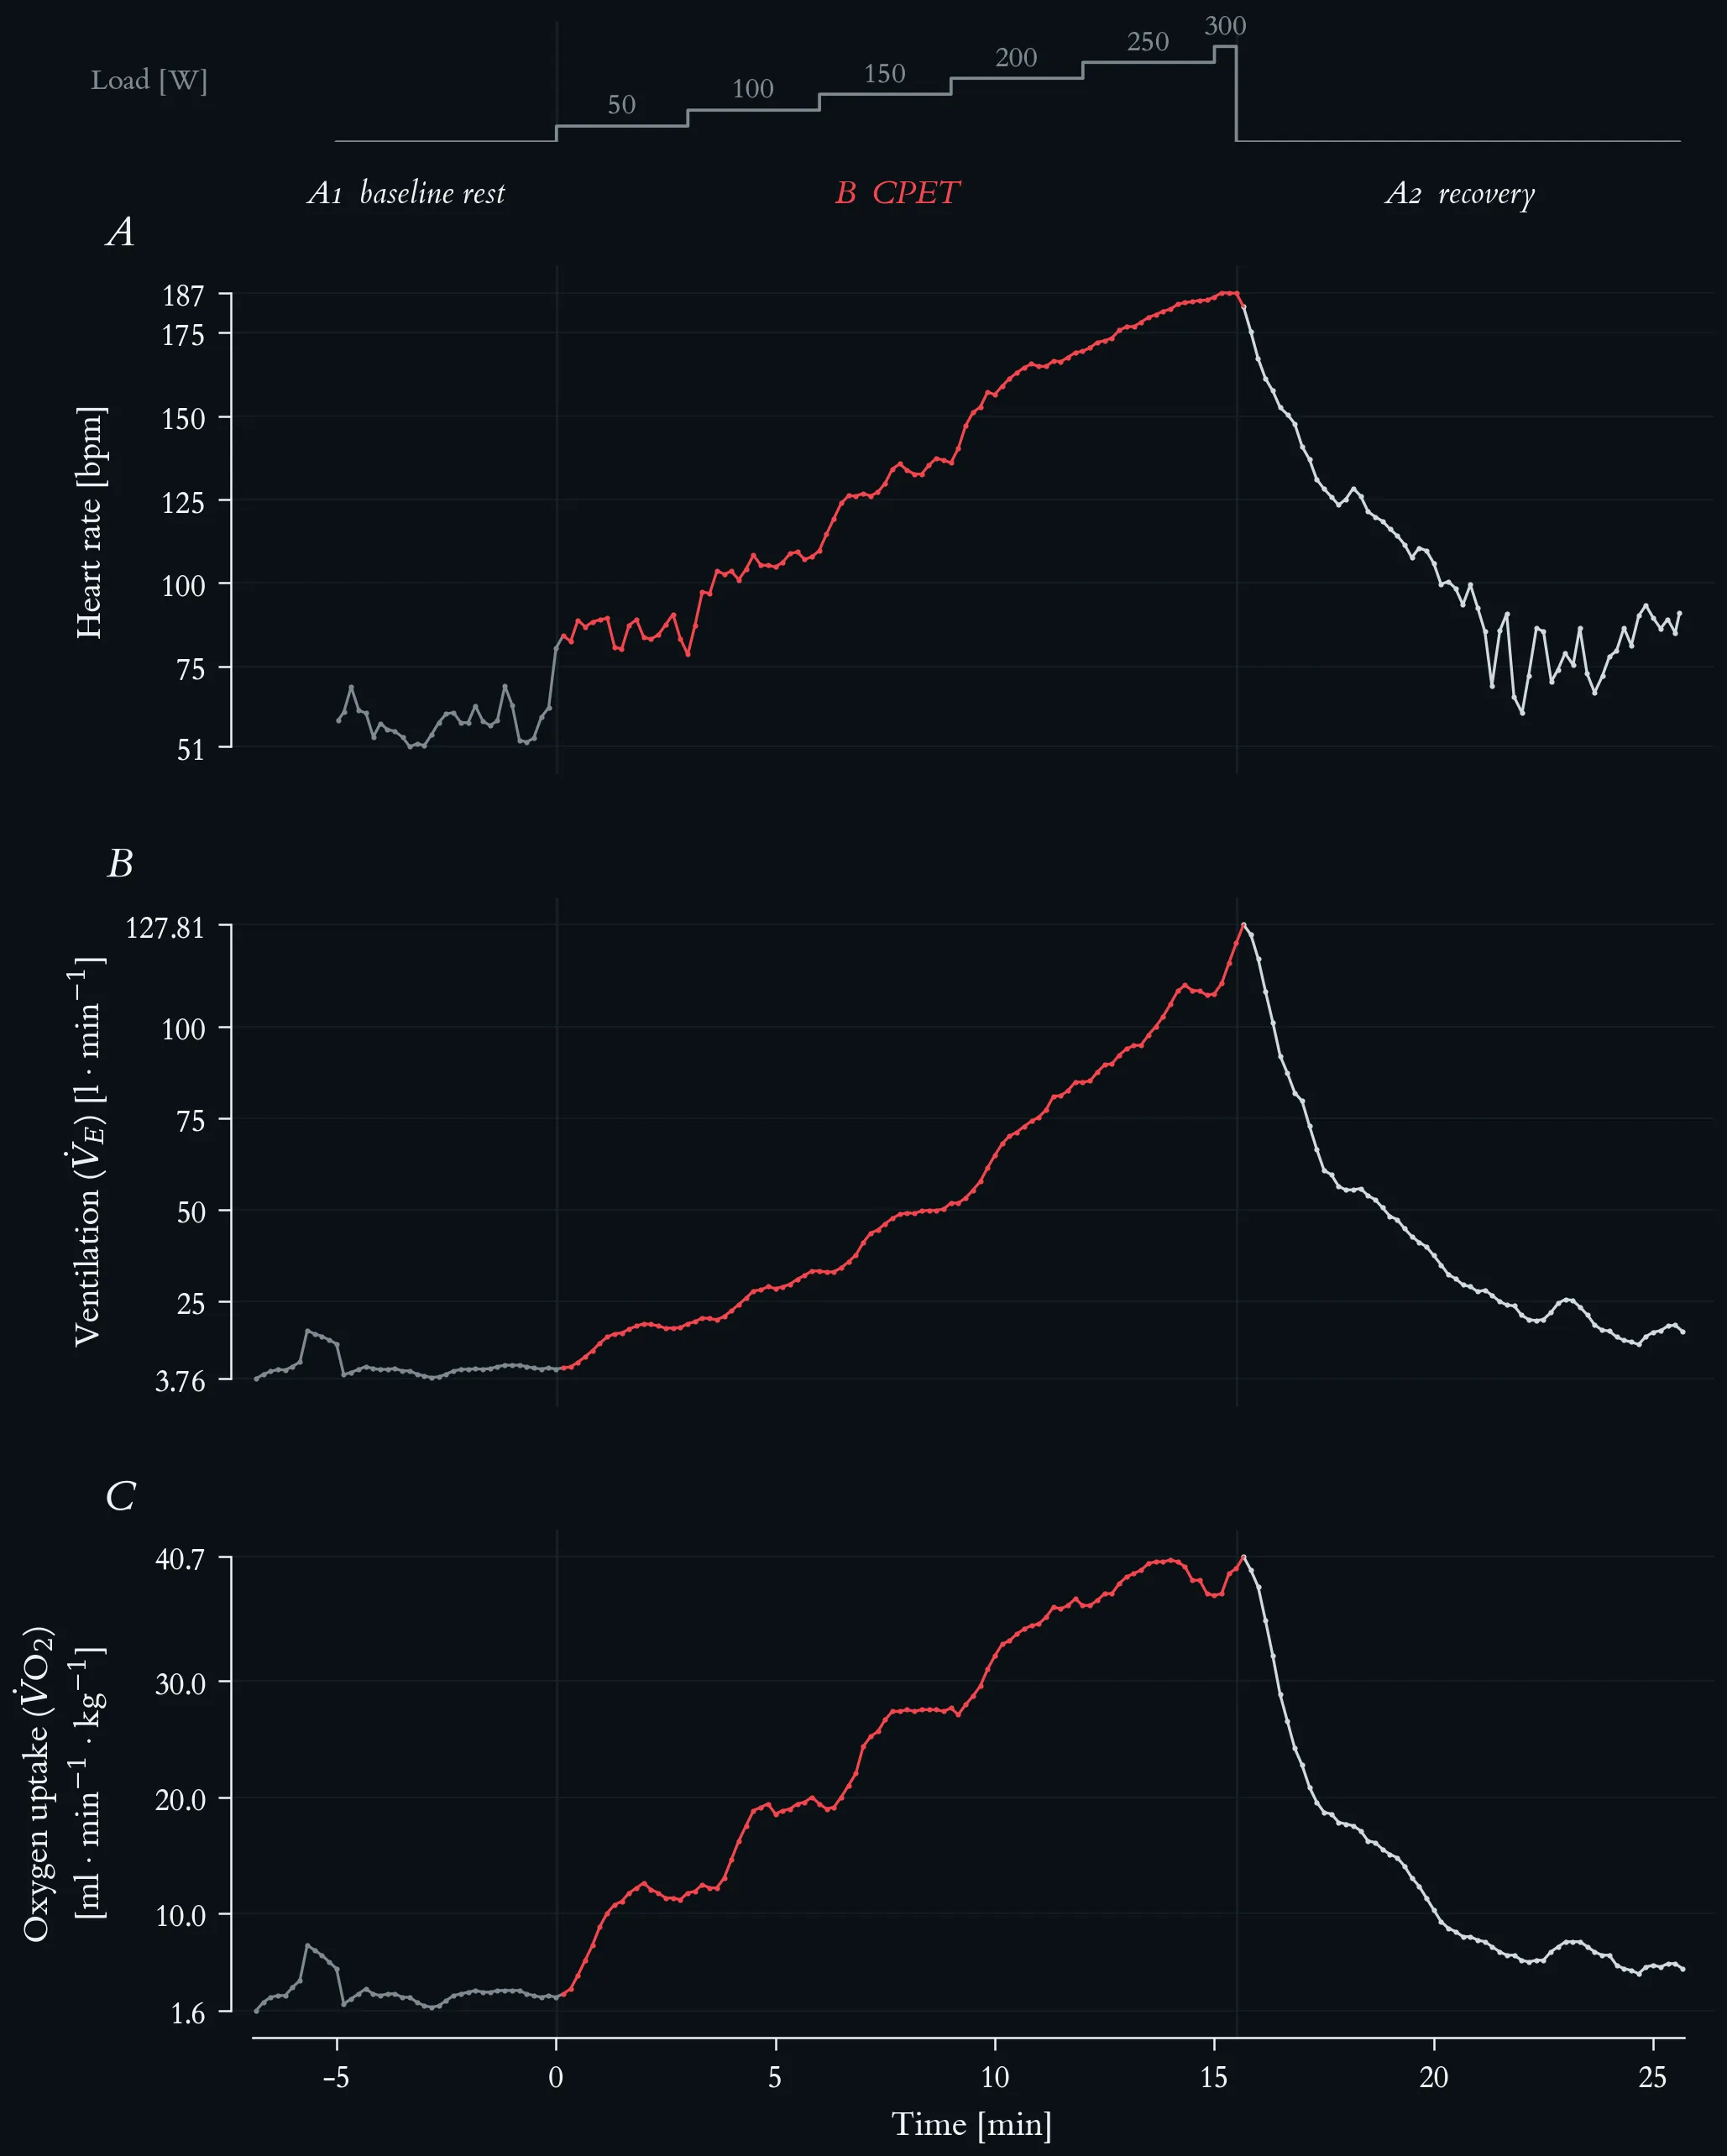
Cardiorespiratory response to a maximal incremental step test, with mass-related oxygen uptake. Top strip: external work rate, incremented by 50 W every three minutes from 50 W to a final 300 W stage terminated after 30 s at volitional exhaustion. Phases are A1 baseline rest, B step test (red) and A2 passive recovery; vertical hairlines mark the two transitions. (A) Heart rate, beat-to-beat recording averaged in 10-s bins, rising from 51 to 187 bpm. (B) Ventilation (V̇E), rising from about 6 l · min⁻¹ at rest to 122.8 l · min⁻¹ at the end of the final stage, with a peak of 127.8 l · min⁻¹ ten seconds after load offset. (C) Mass-related oxygen uptake, V̇O₂ per body mass (69 kg), in ml · min⁻¹ · kg⁻¹. All three series are 10-s averages (197 samples, recording started 6.8 min before load onset).
Resting V̇O₂ is 2.8 ml · min⁻¹ · kg⁻¹, roughly four fifths of one metabolic equivalent. End-of-stage values rise steeply and almost linearly to 200 W — 11.7 → 19.4 → 27.7 → 36.5 ml · min⁻¹ · kg⁻¹ — and then flatten at 37.4 and 39.7 over the two final stages. The peak of 40.7 ml · min⁻¹ · kg⁻¹ falls in the first recovery sample, ten seconds after load offset, the usual consequence of 10-s averaging and gas-transport delay; it is therefore the peak value of the test, not a steady-state value of the 300 W stage.
The ventilation and oxygen-uptake panels separate below and above the threshold region: while V̇O₂ stops rising proportionally from 200 W onward, V̇E keeps accelerating (84.8 → 109.0 → 122.8 l · min⁻¹), so the ventilatory equivalent for oxygen rises from about 31 at rest to 45 at peak. This disproportionate ventilatory rise sets in above the individual anaerobic threshold of 145 W. Values are uncorrected 10-s averages; no plateau criterion is applied.
Heart rate, ventilation and mass-related oxygen uptake at the end of each stage of the maximal incremental step test.
| Load [W] | Time [min] | HR [bpm] | V̇E [l · min⁻¹] | V̇O₂ [ml · min⁻¹ · kg⁻¹] |
|---|---|---|---|---|
| rest (A1) | −6.8 – 0.0 | 58 | 6.4 | 2.8 |
| 50 | 0.2 – 3.0 | 85 | 18.8 | 11.7 |
| 100 | 3.2 – 6.0 | 103 | 33.2 | 19.4 |
| 150 | 6.2 – 9.0 | 129 | 51.8 | 27.7 |
| 200 | 9.2 – 12.0 | 160 | 84.8 | 36.5 |
| 250 | 12.2 – 15.0 | 179 | 109.0 | 37.4 |
| 300 | 15.2 – 15.5 | 187 | 122.8 | 39.7 |
| peak (A2, +10 s) | 15.7 | — | 127.8 | 40.7 |
Heart rate, ventilation and mass-related oxygen uptake at the end of each stage of the maximal incremental step test.
2.2.1 Cardiovascular Response
- Heart rate increases to deliver more oxygen and nutrients to working muscles.
- Stroke volume increases — the heart pumps more blood per beat.
- Blood pressure rises — systolic increases more than diastolic.
- Blood flow redistribution — 20–25 % of cardiac output at rest goes to muscles; during exercise, this increases to 85–90 %.
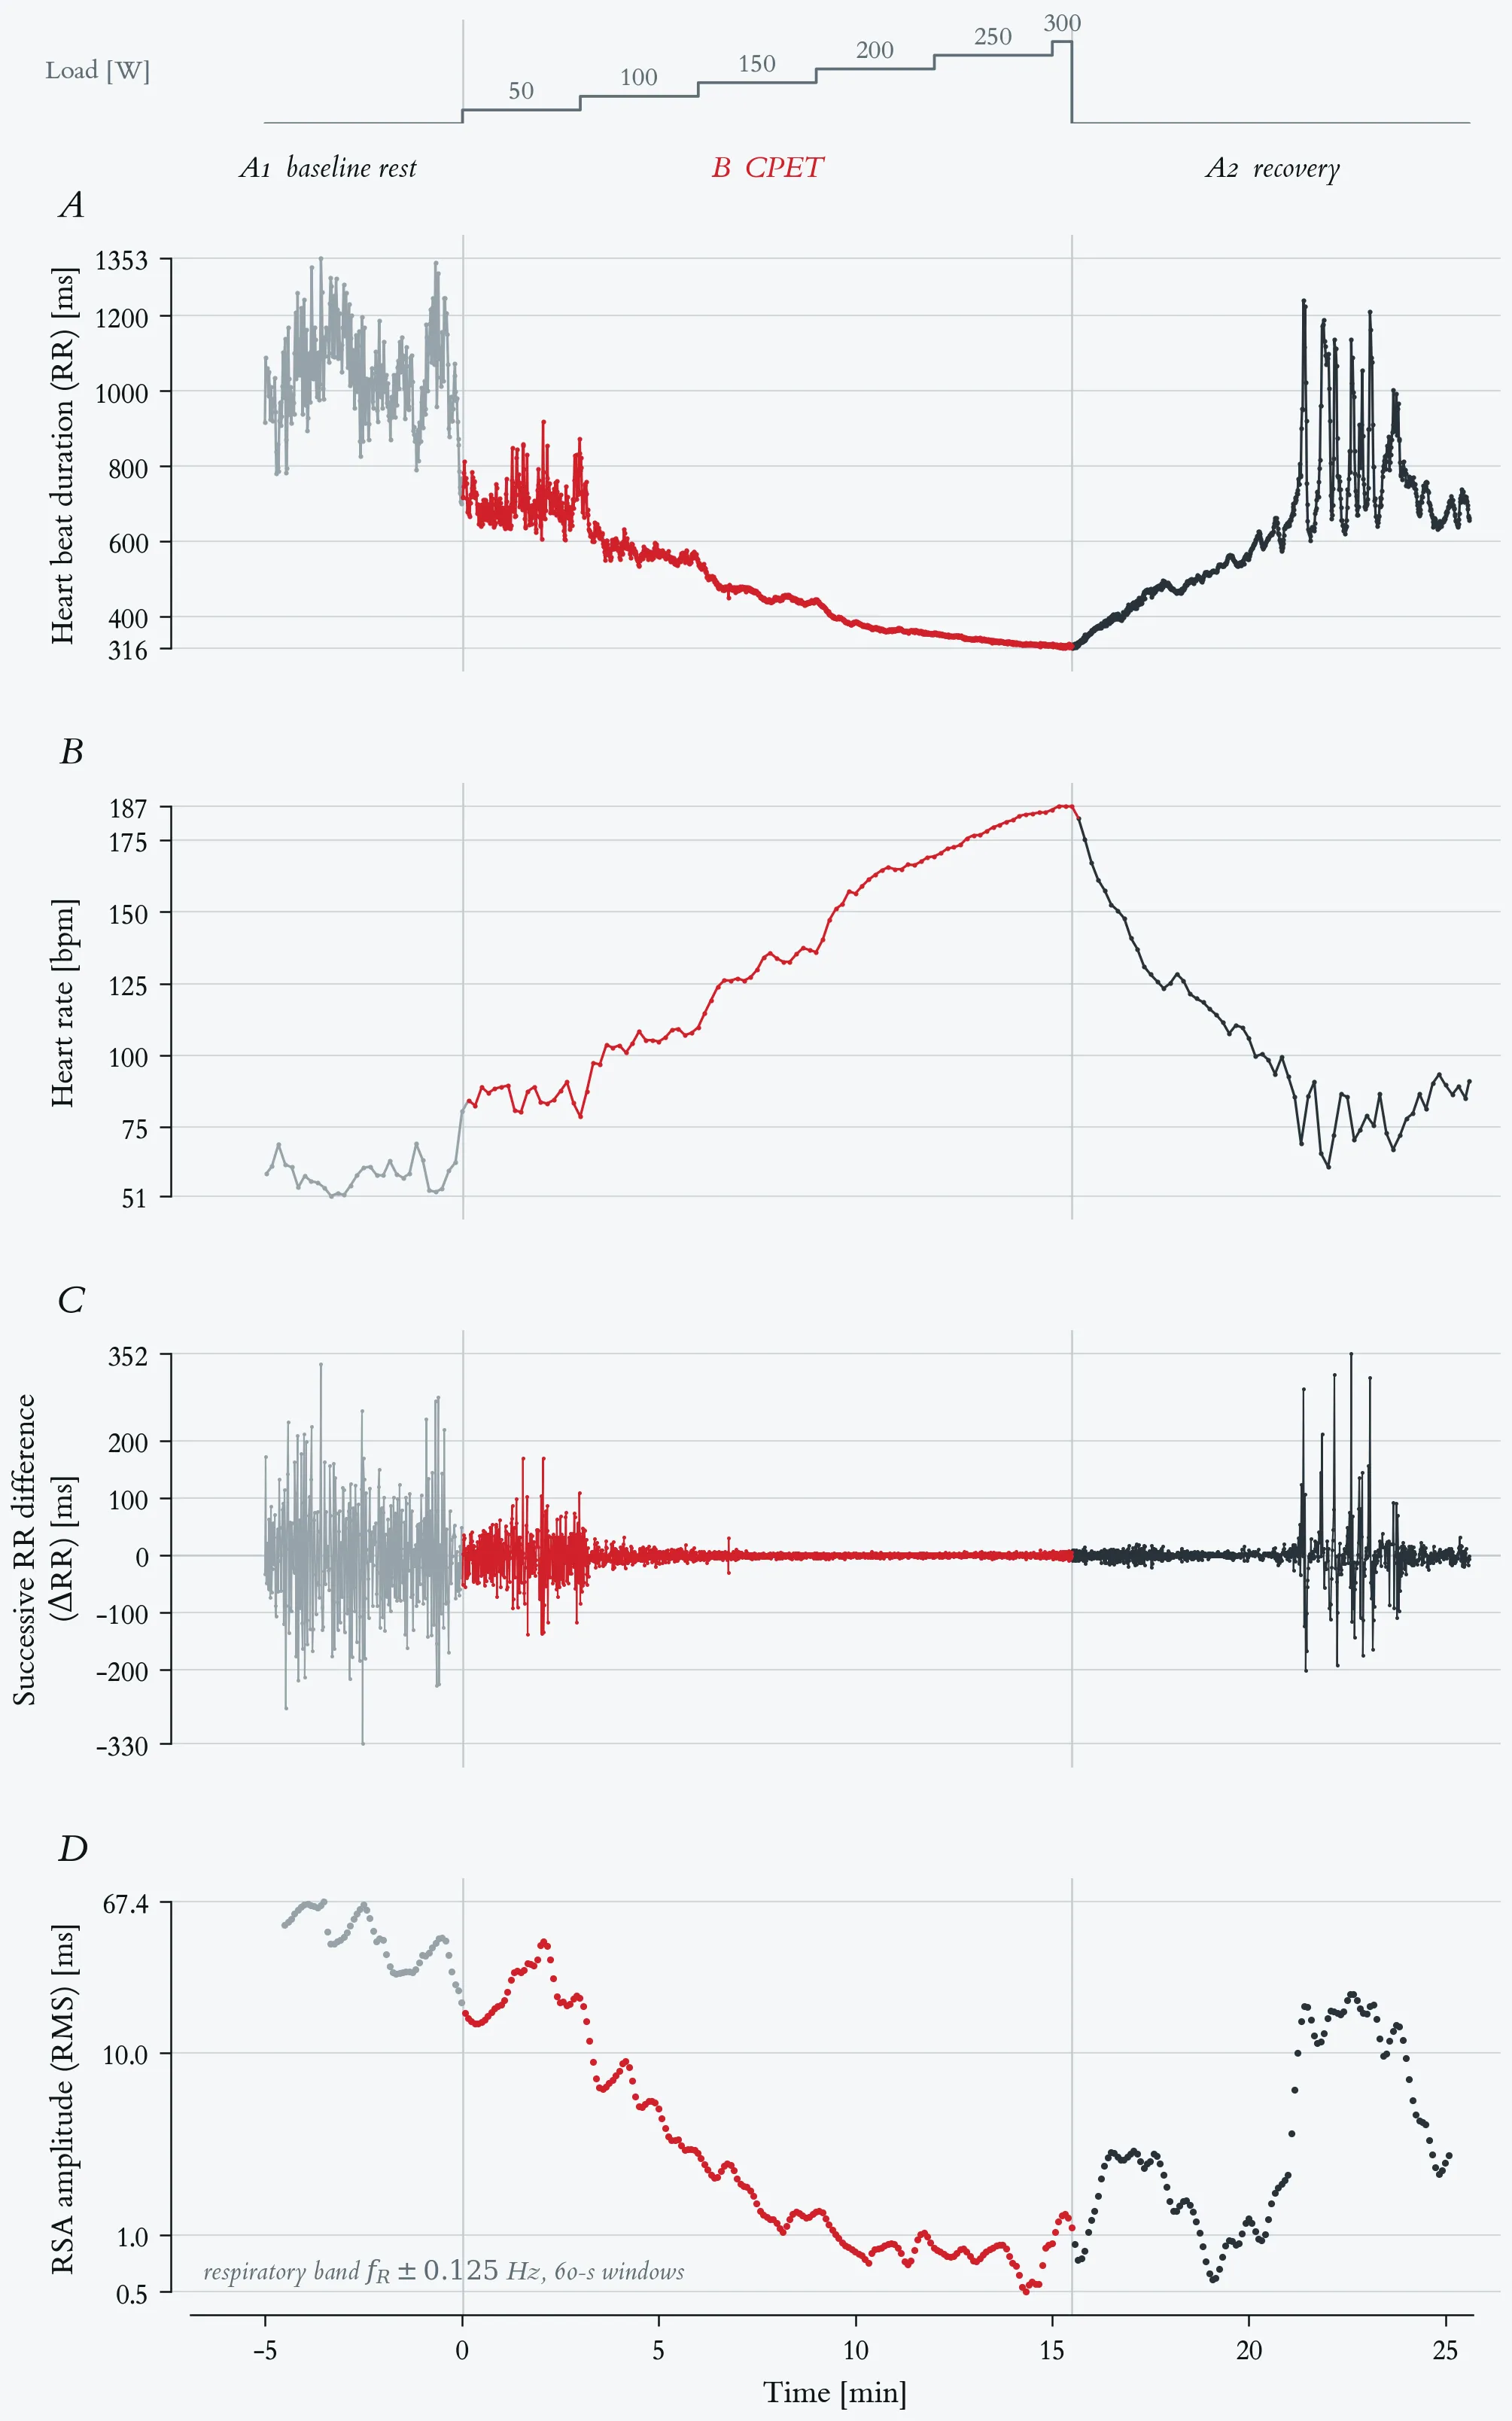
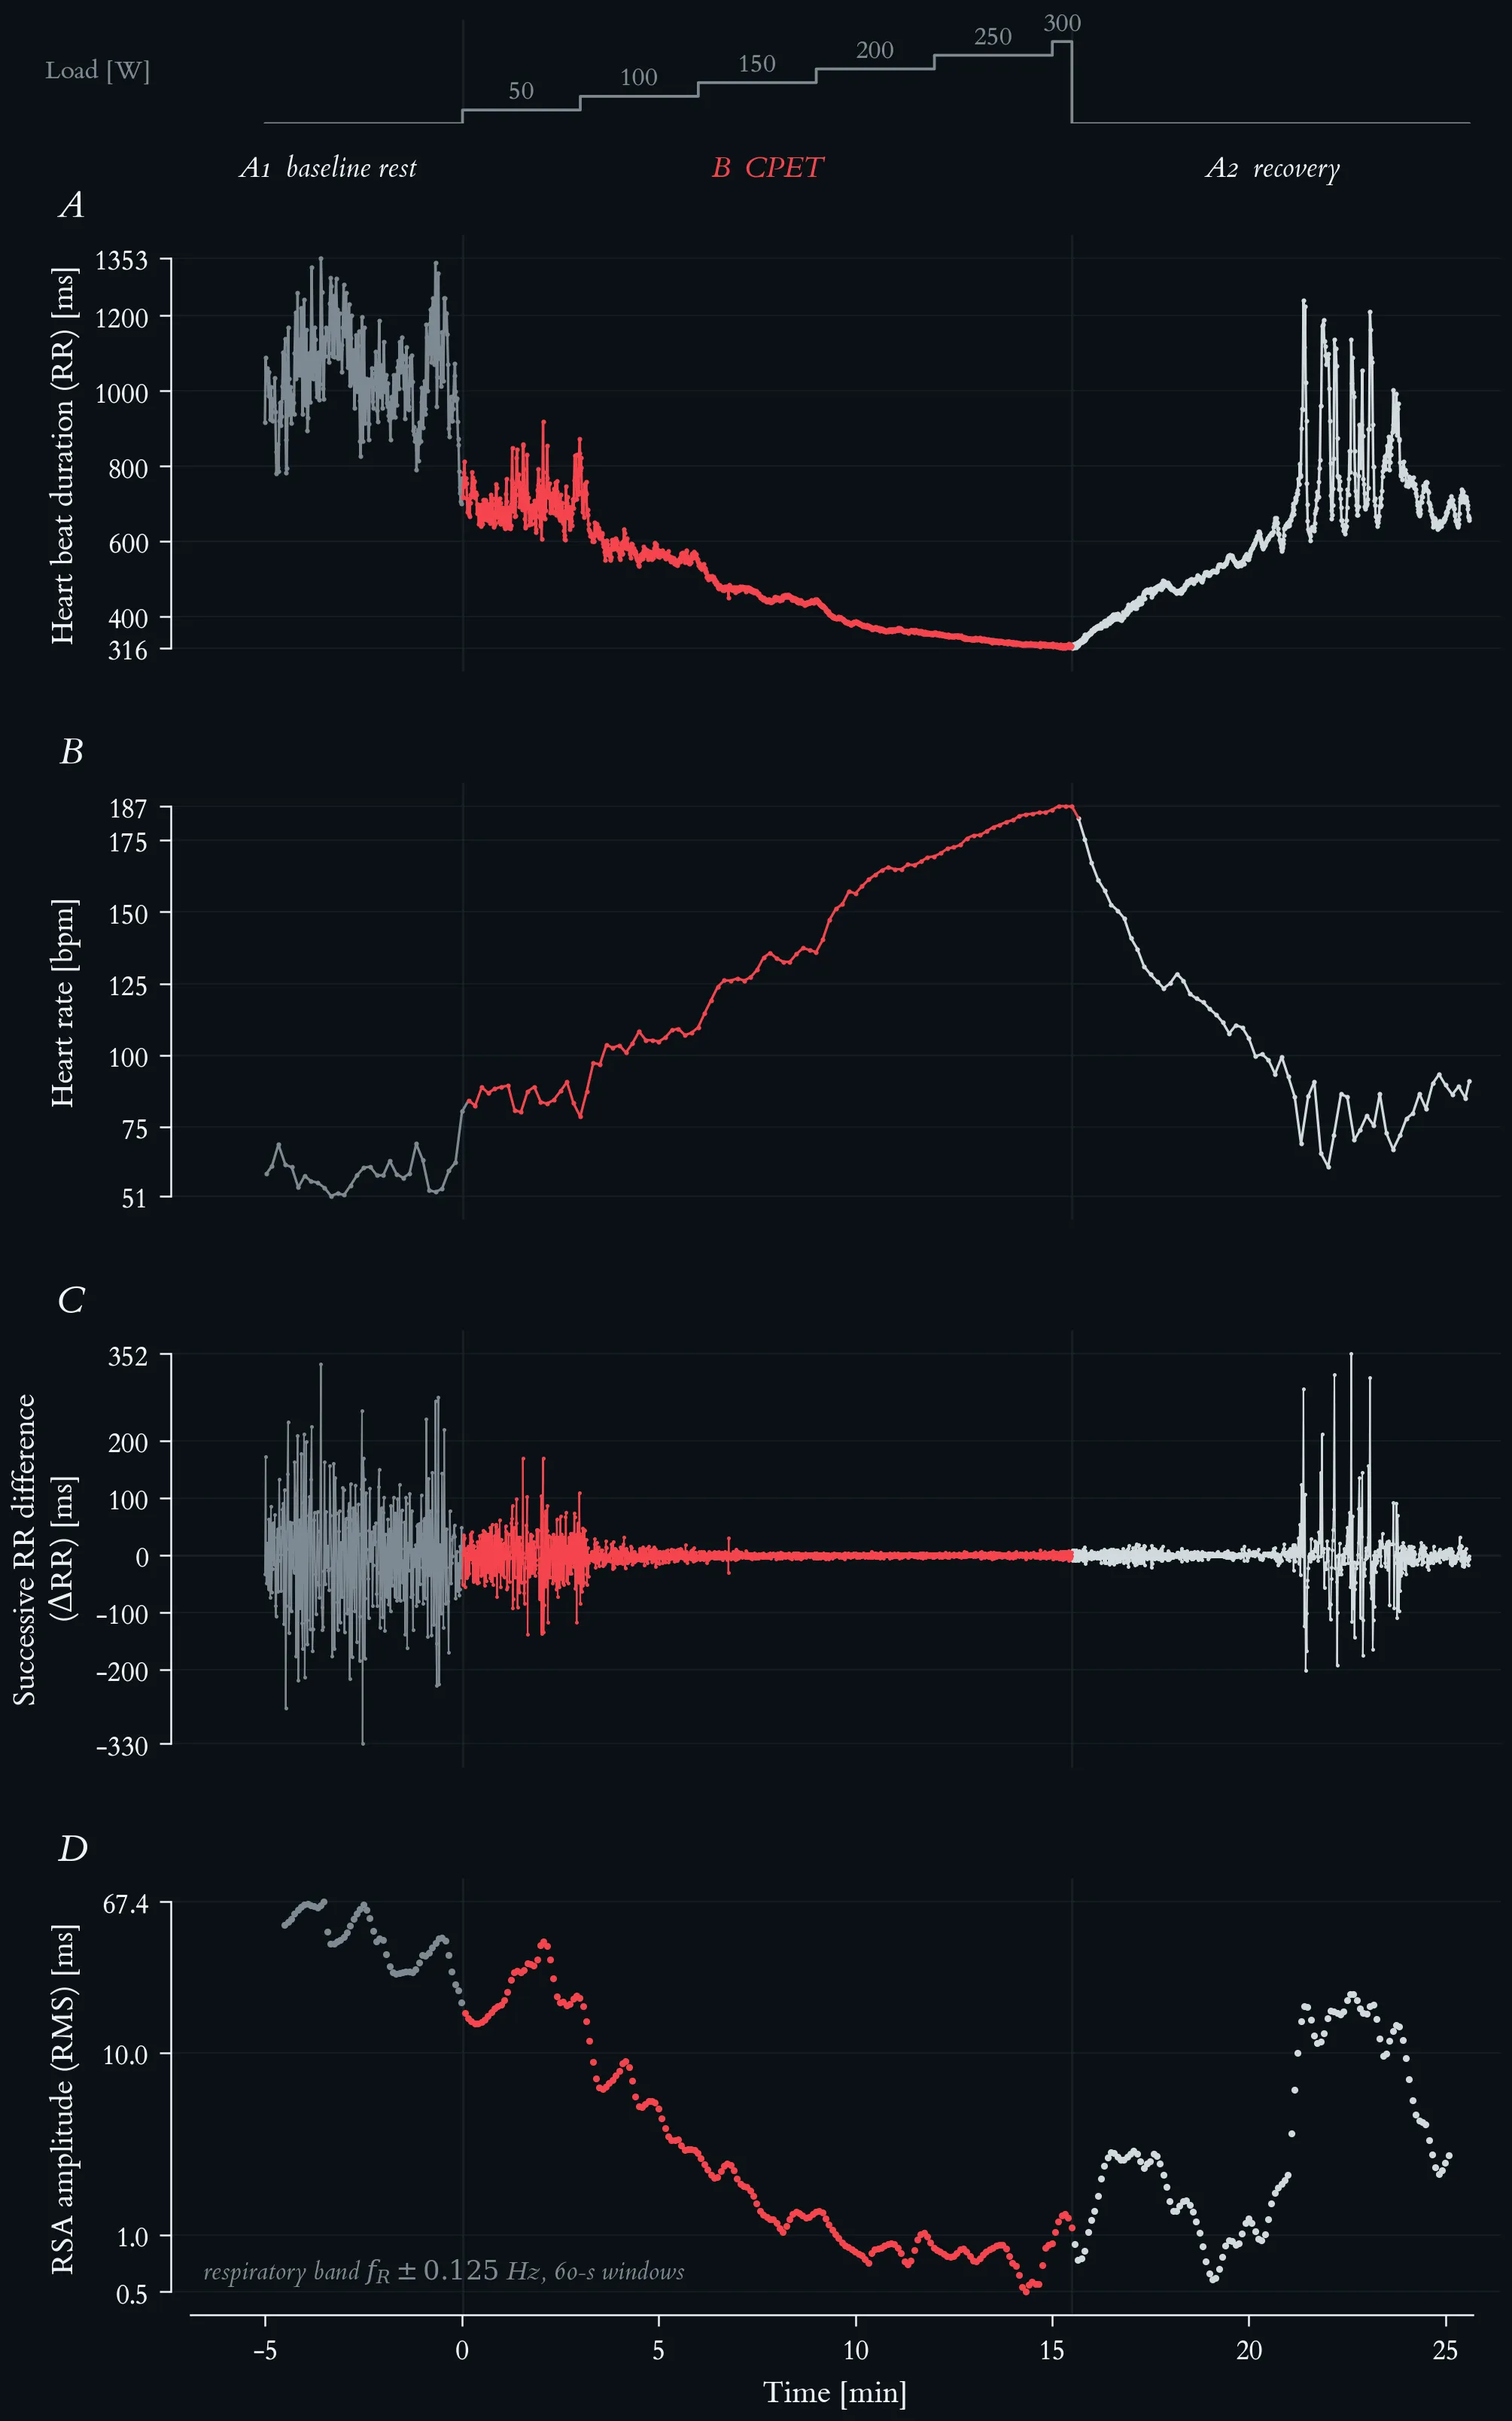
The rise in heart rate is only the visible half of the cardiac response. Underlying it is a shift in cardiac autonomic control — withdrawal of vagal (parasympathetic) activity and increasing sympathetic drive — which shows itself not in the level of the signal but in its beat-to-beat variability.
Beat-to-beat cardiac autonomic response across the ABA exercise protocol. Top strip: external work rate, stepped by 50 W every three minutes from 50 to 300 W. Phases are A1 baseline rest (5.0 min, 293 beats), B CPET (15.5 min, 2059 beats, red), and A2 recovery (10.1 min, 1070 beats); vertical hairlines mark the two transitions. (A) Beat-to-beat RR interval (n = 3422 beats). Mean RR falls from 1029 ms at rest to 452 ms under load and reaches its minimum of 316 ms at exhaustion. (B) Heart rate, the same recording averaged in 10-s bins, rising from 51 to 187 bpm. (C) Successive RR differences (ΔRR), the beat-to-beat change that panel A carries only implicitly. The scatter collapses from ±330 ms at rest to a near-flat band during the ramp — root mean square of successive differences 102 ms in A1, 16.9 ms across B, and 2.6 ms over the final five minutes of loading — and the large excursions return within the first minutes of A2, where isolated beats again differ by more than 300 ms. (D) RSA amplitude: the RMS of the RR oscillation inside a respiration-guided band, f_R ± 0.125 Hz, with f_R taken from the concurrent measured breathing frequency; 60-s windows stepped by 5 s, logarithmic axis. Because breathing frequency rises from 0.22 to 0.98 Hz over this test, the classic high-frequency band (0.15–0.40 Hz) would miss the respiratory peak from the 150 W stage onward and underestimate it by a factor of five at 250 W.
Beat-to-beat cardiac autonomic response across the ABA exercise protocol. Top strip: external work rate, stepped by 50 W every three minutes from 50 to 300 W. Phases are A1 baseline rest (5.0 min, 293 beats), B CPET (15.5 min, 2059 beats, red), and A2 recovery (10.1 min, 1070 beats); vertical hairlines mark the two transitions. (A) Beat-to-beat RR interval (n = 3422 beats). Mean RR falls from 1029 ms at rest to 452 ms under load and reaches its minimum of 316 ms at exhaustion. (B) Heart rate, the same recording averaged in 10-s bins, rising from 51 to 187 bpm. (C) Successive RR differences (ΔRR), the beat-to-beat change that panel A carries only implicitly. The scatter collapses from ±330 ms at rest to a near-flat band during the ramp — root mean square of successive differences 102 ms in A1, 16.9 ms across B, and 2.6 ms over the final five minutes of loading — and the large excursions return within the first minutes of A2, where isolated beats again differ by more than 300 ms. (D) RSA amplitude: the RMS of the RR oscillation inside a respiration-guided band, f_R ± 0.125 Hz, with f_R taken from the concurrent measured breathing frequency; 60-s windows stepped by 5 s, logarithmic axis. Because breathing frequency rises from 0.22 to 0.98 Hz over this test, the classic high-frequency band (0.15–0.40 Hz) would miss the respiratory peak from the 150 W stage onward and underestimate it by a factor of five at 250 W.
Panel C makes vagal withdrawal and its reinstatement legible as a change in variability rather than in level: respiratory sinus arrhythmia dominates the resting signal, disappears under sympathetic drive, and reappears abruptly once the load is removed. The RR interval and ΔRR values are single-beat measurements without artefact correction; the root-mean-square figures are descriptive summaries of these non-stationary phases, not HRV indices in the conventional short-term-stationary sense.
Panels C and D answer two different questions, and putting them on one axis is the point of this figure. Panel C shows how much beat-to-beat variability there is; panel D shows how much of it is respiratory. Under load the two agree: RSA amplitude falls from 43 ms at rest to 1.4 ms by the 150 W stage — the stage containing the individual anaerobic threshold — and to a minimum of 0.49 ms at 250 W, a factor of 54 in amplitude and about 2900 in power. Normalised to the mean RR the collapse survives, 4.06 % to 0.23 %, so it is not an arithmetic consequence of shorter beats.
2.2.2 Respiratory Response
- Breathing frequency increases to enhance gas exchange.
- Tidal volume increases — greater volume of air per breath.
- Minute ventilation (V̇E) increases proportionally to exercise intensity.
- V̇O₂ increases — more oxygen is extracted from inhaled air.
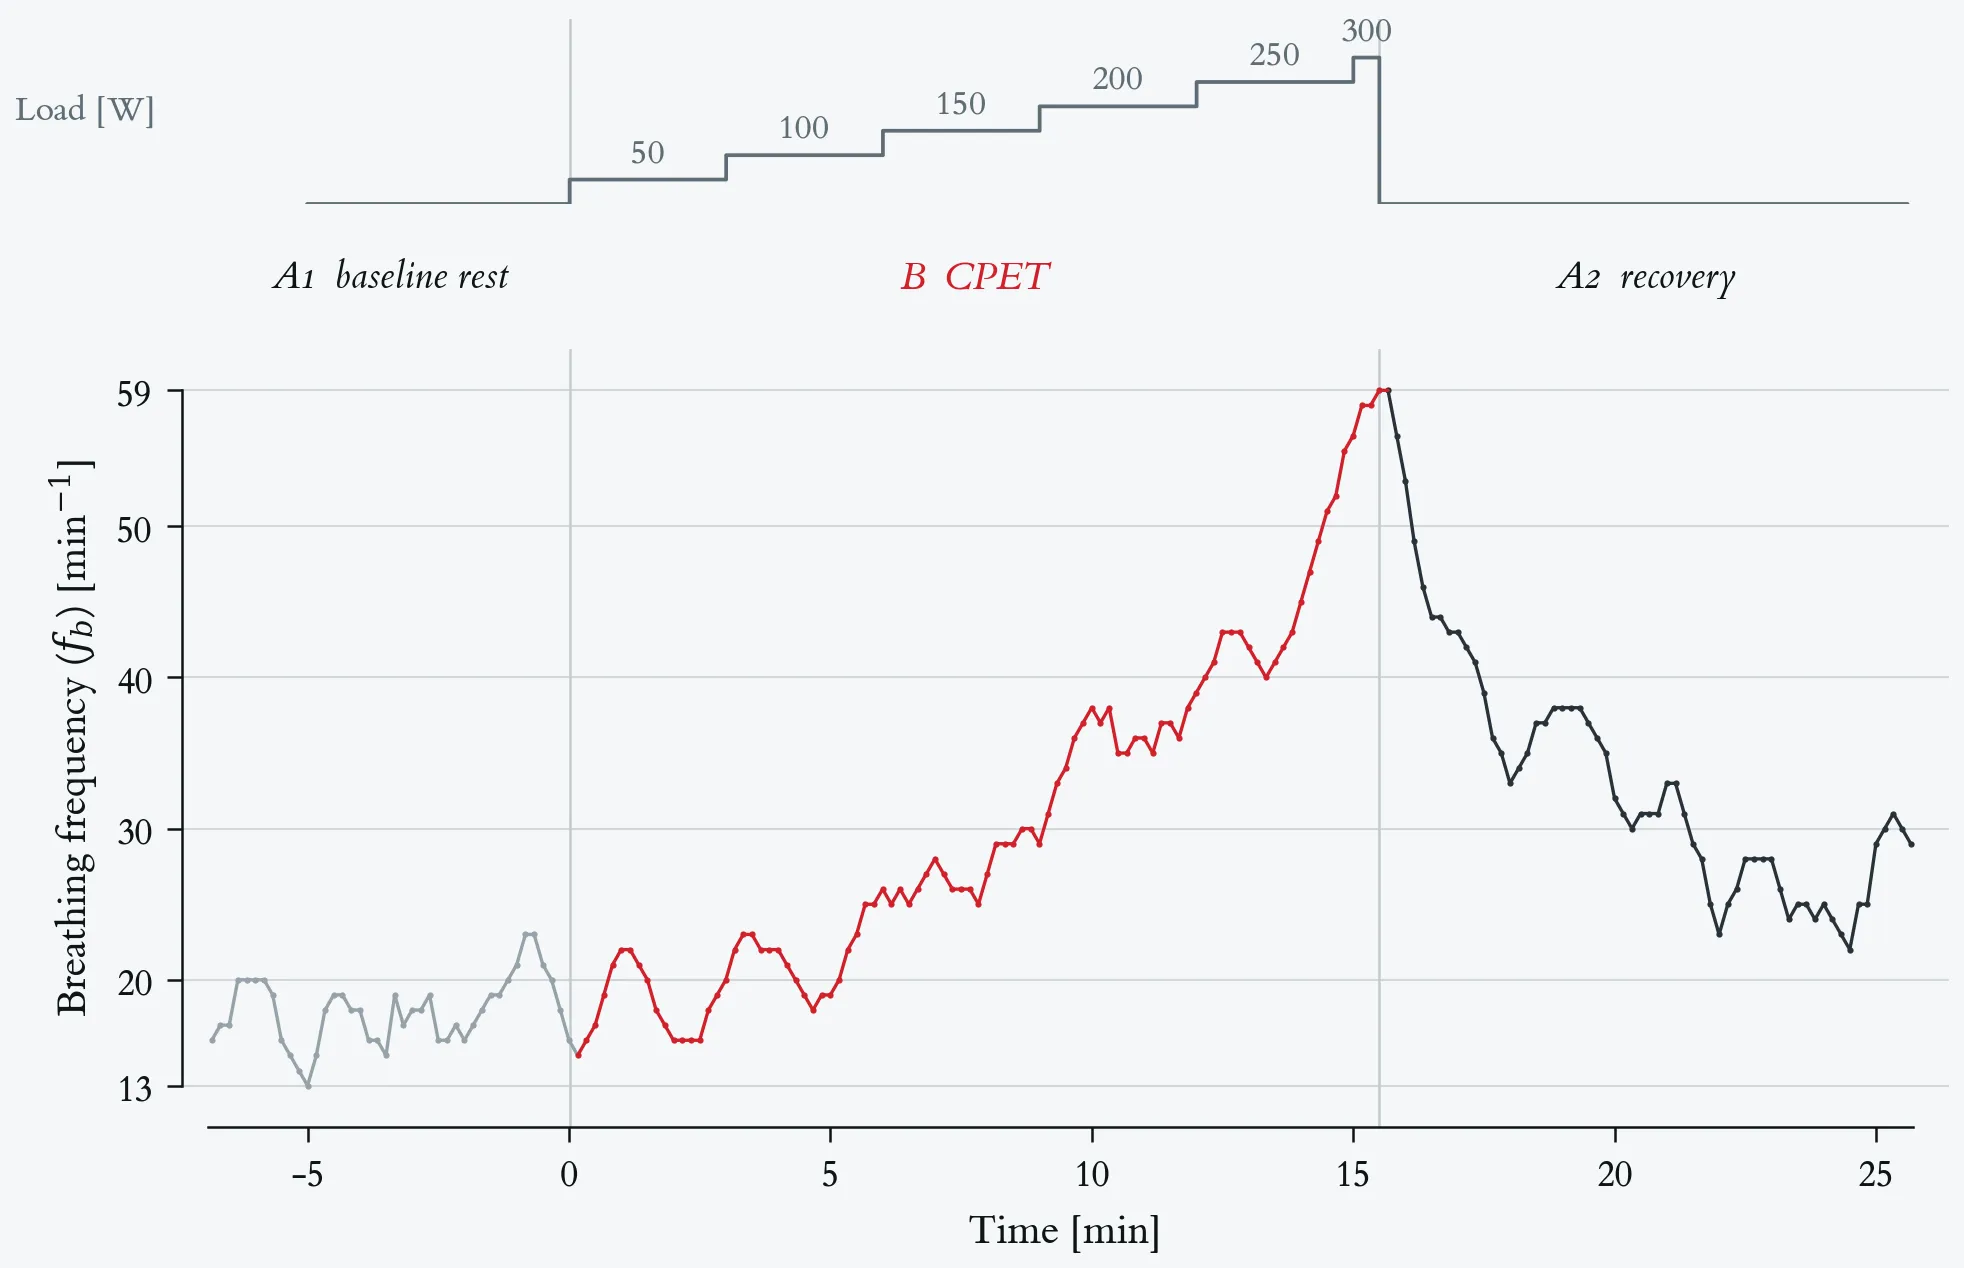
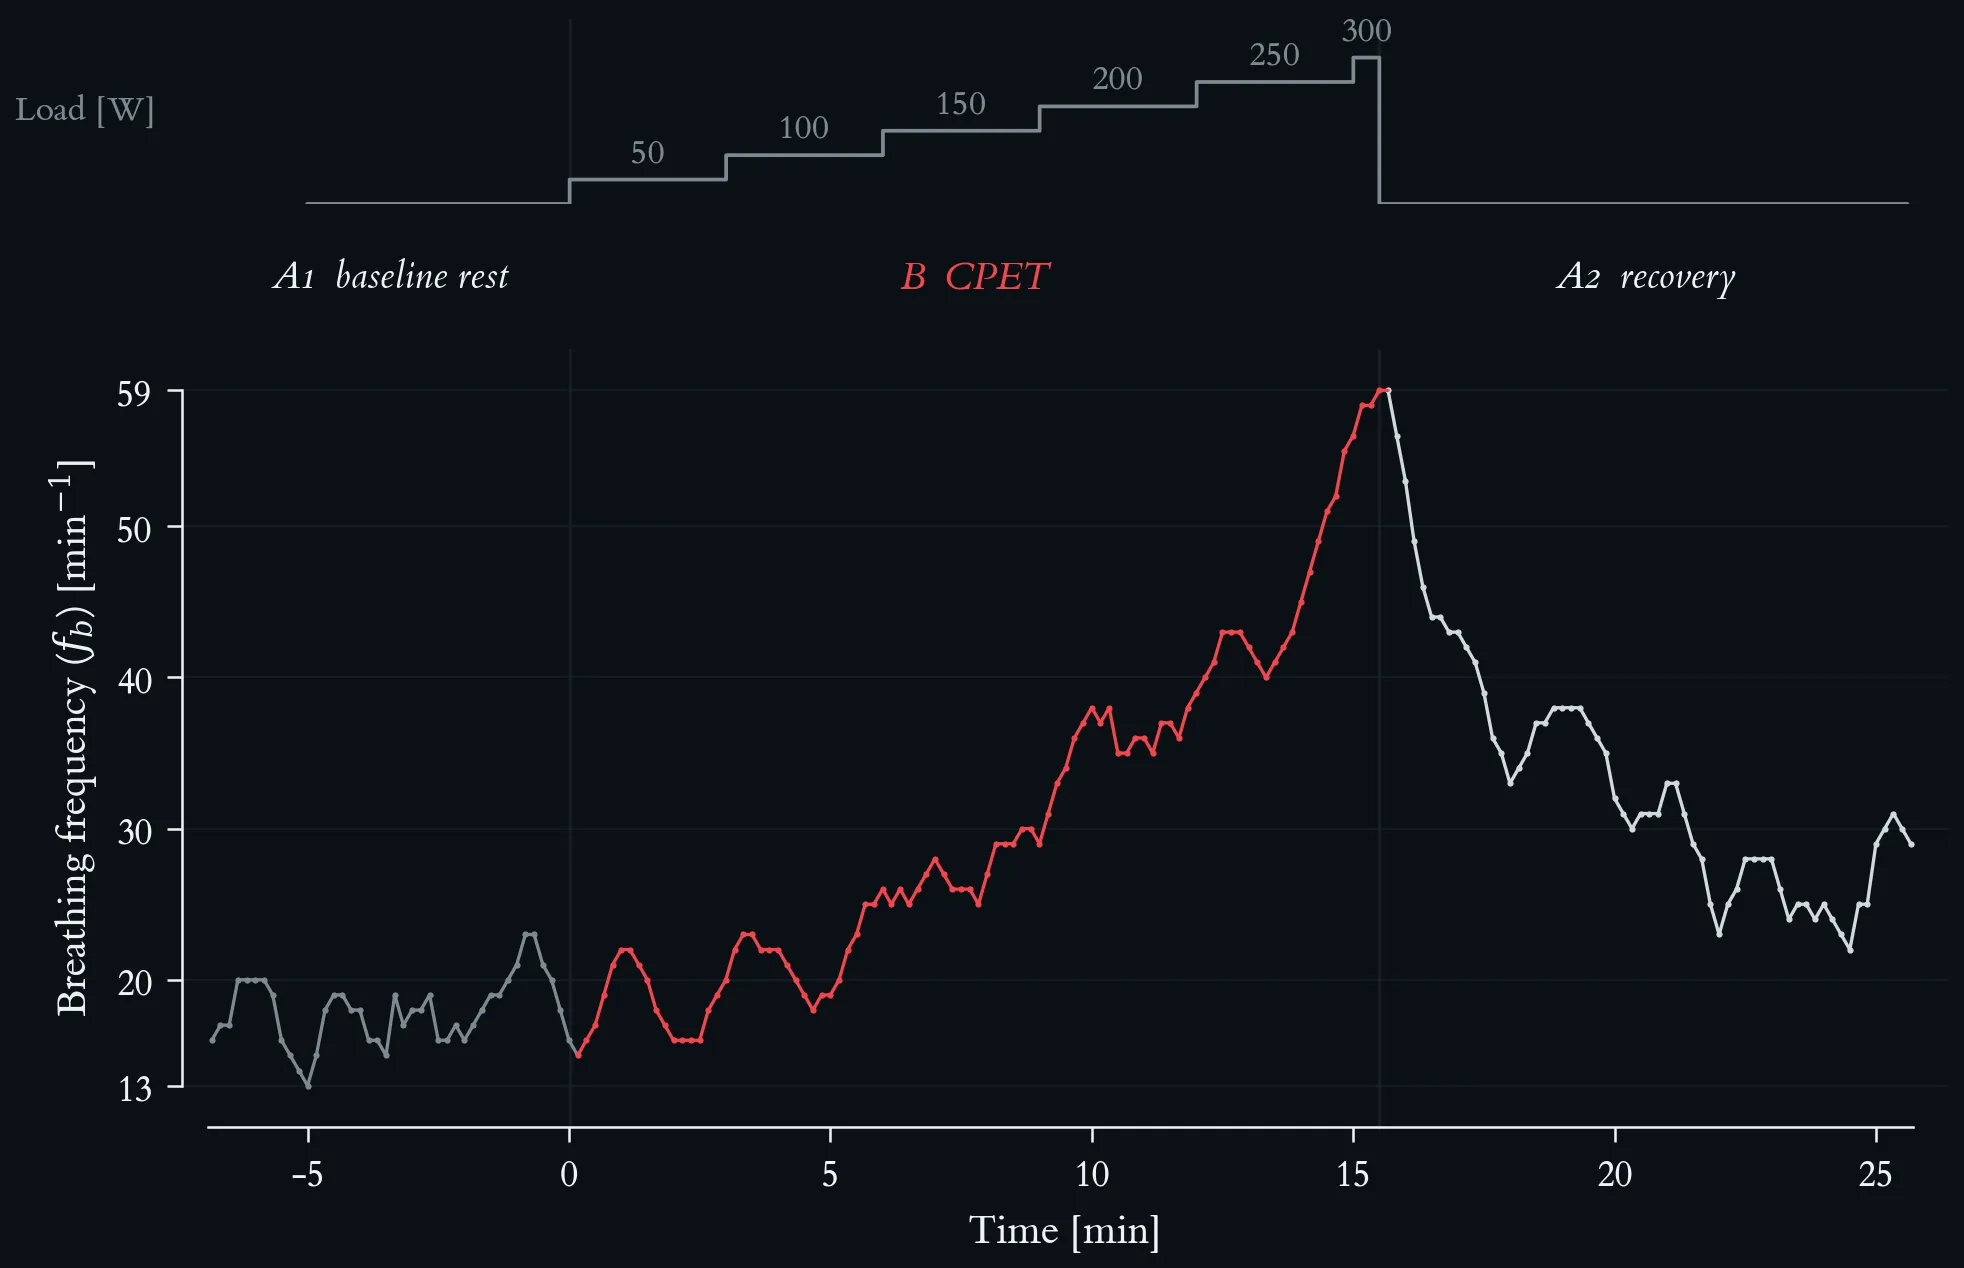
Minute ventilation is the product of breathing frequency and tidal volume, and the two contribute unequally across the intensity range.
Breathing frequency across the maximal incremental step test. Top strip: external work rate, incremented by 50 W every three minutes from 50 W to a final 300 W stage terminated after 30 s at volitional exhaustion. Lactate-based reference loads: aerobic threshold 117 W, individual anaerobic threshold 145 W. Phases are A1 baseline rest, B step test (red) and A2 passive recovery; vertical hairlines mark the two transitions. Breathing frequency (fb) as 10-s averages from the metabolic cart, 196 samples.
Breathing frequency across the maximal incremental step test. Top strip: external work rate, incremented by 50 W every three minutes from 50 W to a final 300 W stage terminated after 30 s at volitional exhaustion. Lactate-based reference loads: aerobic threshold 117 W, individual anaerobic threshold 145 W. Phases are A1 baseline rest, B step test (red) and A2 passive recovery; vertical hairlines mark the two transitions. Breathing frequency (fb) as 10-s averages from the metabolic cart, 196 samples.
Resting fb is about 18 min⁻¹ and varies between 13 and 23 min⁻¹ without a trend. End-of-stage values rise slowly through the first three stages (20 → 26 → 29 min⁻¹ at 50, 100 and 150 W) and then steeply: 39 min⁻¹ at 200 W, 56 min⁻¹ at 250 W and 59 min⁻¹ in the final stage, the peak of the test. Almost half of the total rise therefore occurs in the last two stages, above the individual anaerobic threshold. In recovery fb falls to about 30 min⁻¹ within three minutes and then stays well above the resting level for the remaining seven minutes. The steep late rise is the frequency component of the ventilatory response: tidal volume has stopped rising by the 250 W stage, so from there on ventilation is increased almost entirely by breathing faster. Values are uncorrected 10-s averages; the peak is a single 10-s sample, not a steady-state value.
Breathing frequency at the end of each stage of the maximal incremental step test.
| Load [W] | Time [min] | fb [min⁻¹] |
|---|---|---|
| rest (A1) | −6.8 – 0.0 | 16 (median 18) |
| 50 | 0.2 – 3.0 | 20 |
| 100 | 3.2 – 6.0 | 26 |
| 150 | 6.2 – 9.0 | 29 |
| 200 | 9.2 – 12.0 | 39 |
| 250 | 12.2 – 15.0 | 56 |
| 300 | 15.2 – 15.5 | 59 (peak) |
| recovery end (A2) | 25.7 | 29 |
Breathing frequency at the end of each stage of the maximal incremental step test.
2.2.3 Metabolic Response
- ATP demand increases — muscle contractions require rapid ATP regeneration.
- Substrate utilization shifts — at low intensities, fats dominate; at high intensities, carbohydrates predominate.
- Lactate production increases — anaerobic metabolism becomes significant above the anaerobic threshold.
- Hormone secretion increases — catecholamines, cortisol, and glucagon mobilize energy substrates.
The shift in substrate utilisation can be read directly from gas exchange. The respiratory exchange ratio (RER = V̇CO₂/V̇O₂) approximates the respiratory quotient of the oxidised substrates: about 0.7 for pure fat oxidation, 1.0 for pure carbohydrate oxidation, and — above 1.0 — the signature of non-metabolic CO₂ released by bicarbonate buffering of accumulating lactate.
Mass-related oxygen uptake and respiratory exchange ratio across the maximal incremental step test. Top strip: external work rate, incremented by 50 W every three minutes from 50 W to a final 300 W stage terminated after 30 s at volitional exhaustion. Lactate-based reference loads: aerobic threshold 117 W, individual anaerobic threshold 145 W. Phases are A1 baseline rest, B step test (red) and A2 passive recovery; vertical hairlines mark the two transitions. Both series are 10-s averages from the metabolic cart, 196 samples. (A) Mass-related oxygen uptake, V̇O₂ per body mass (69 kg), in ml · min⁻¹ · kg⁻¹, rising from 2.8 at rest to a peak of 40.7 in the first recovery sample. (B) Respiratory exchange ratio (RER), with a hairline at 1.00.
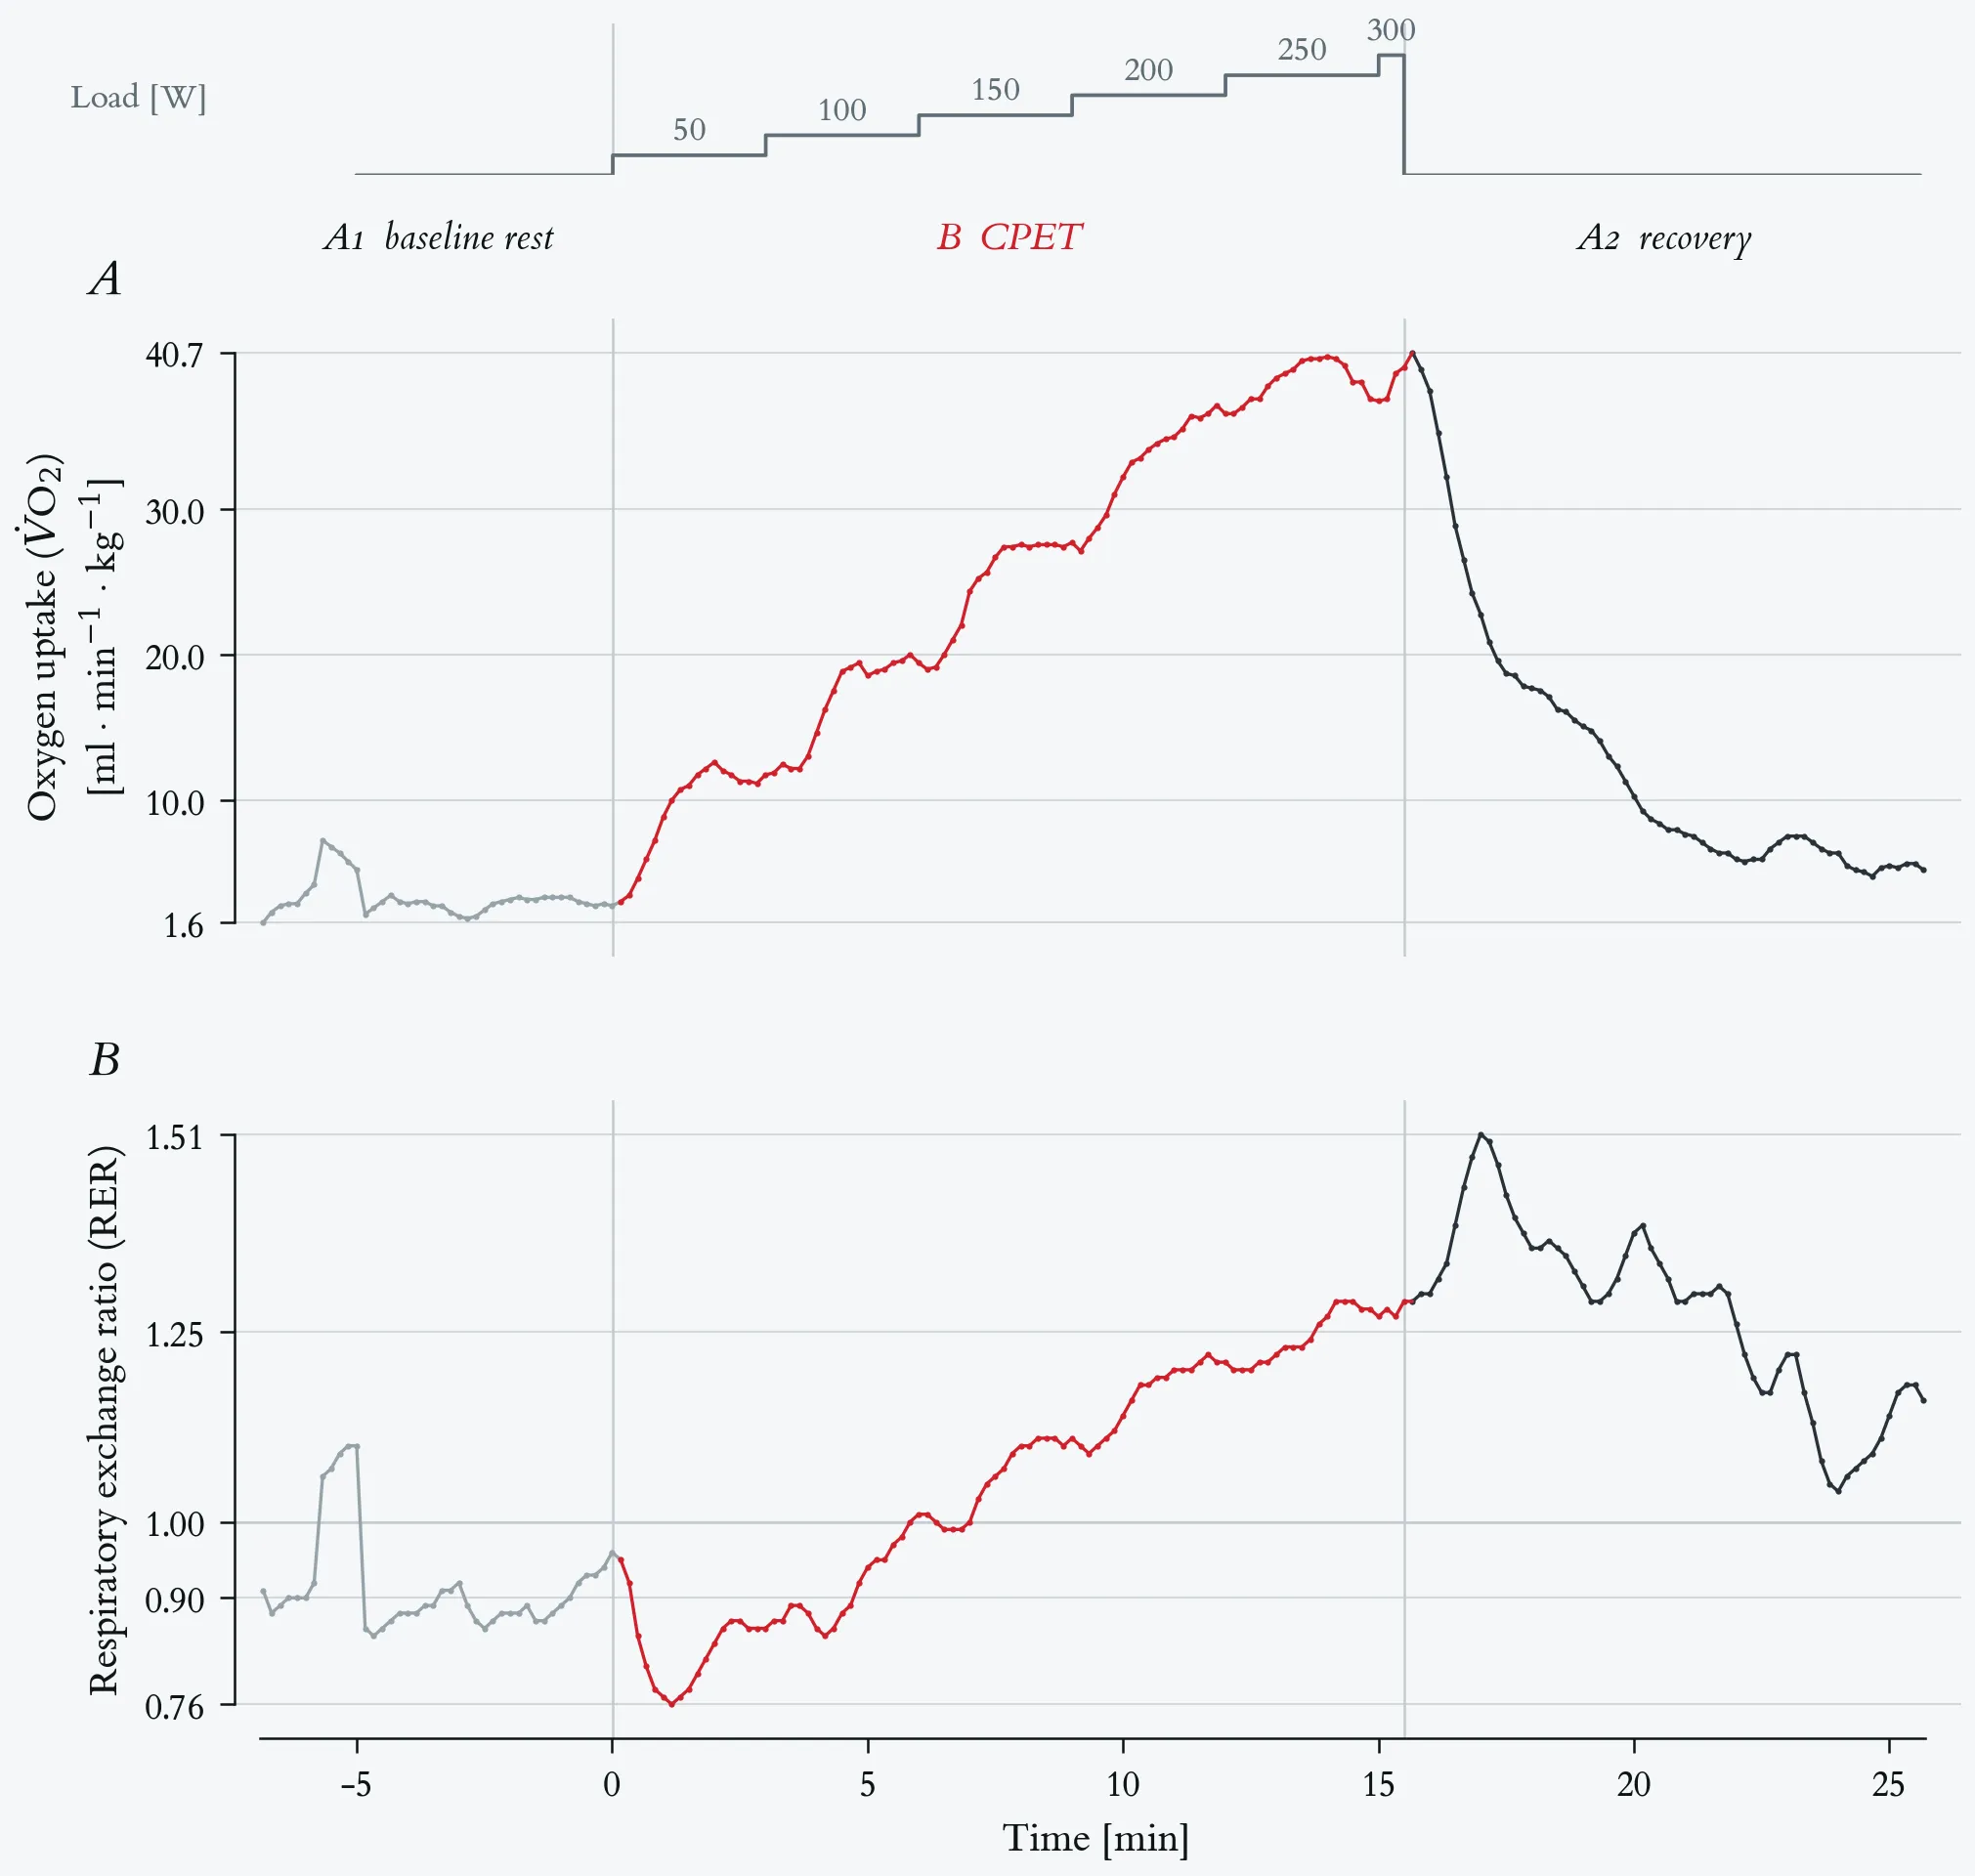
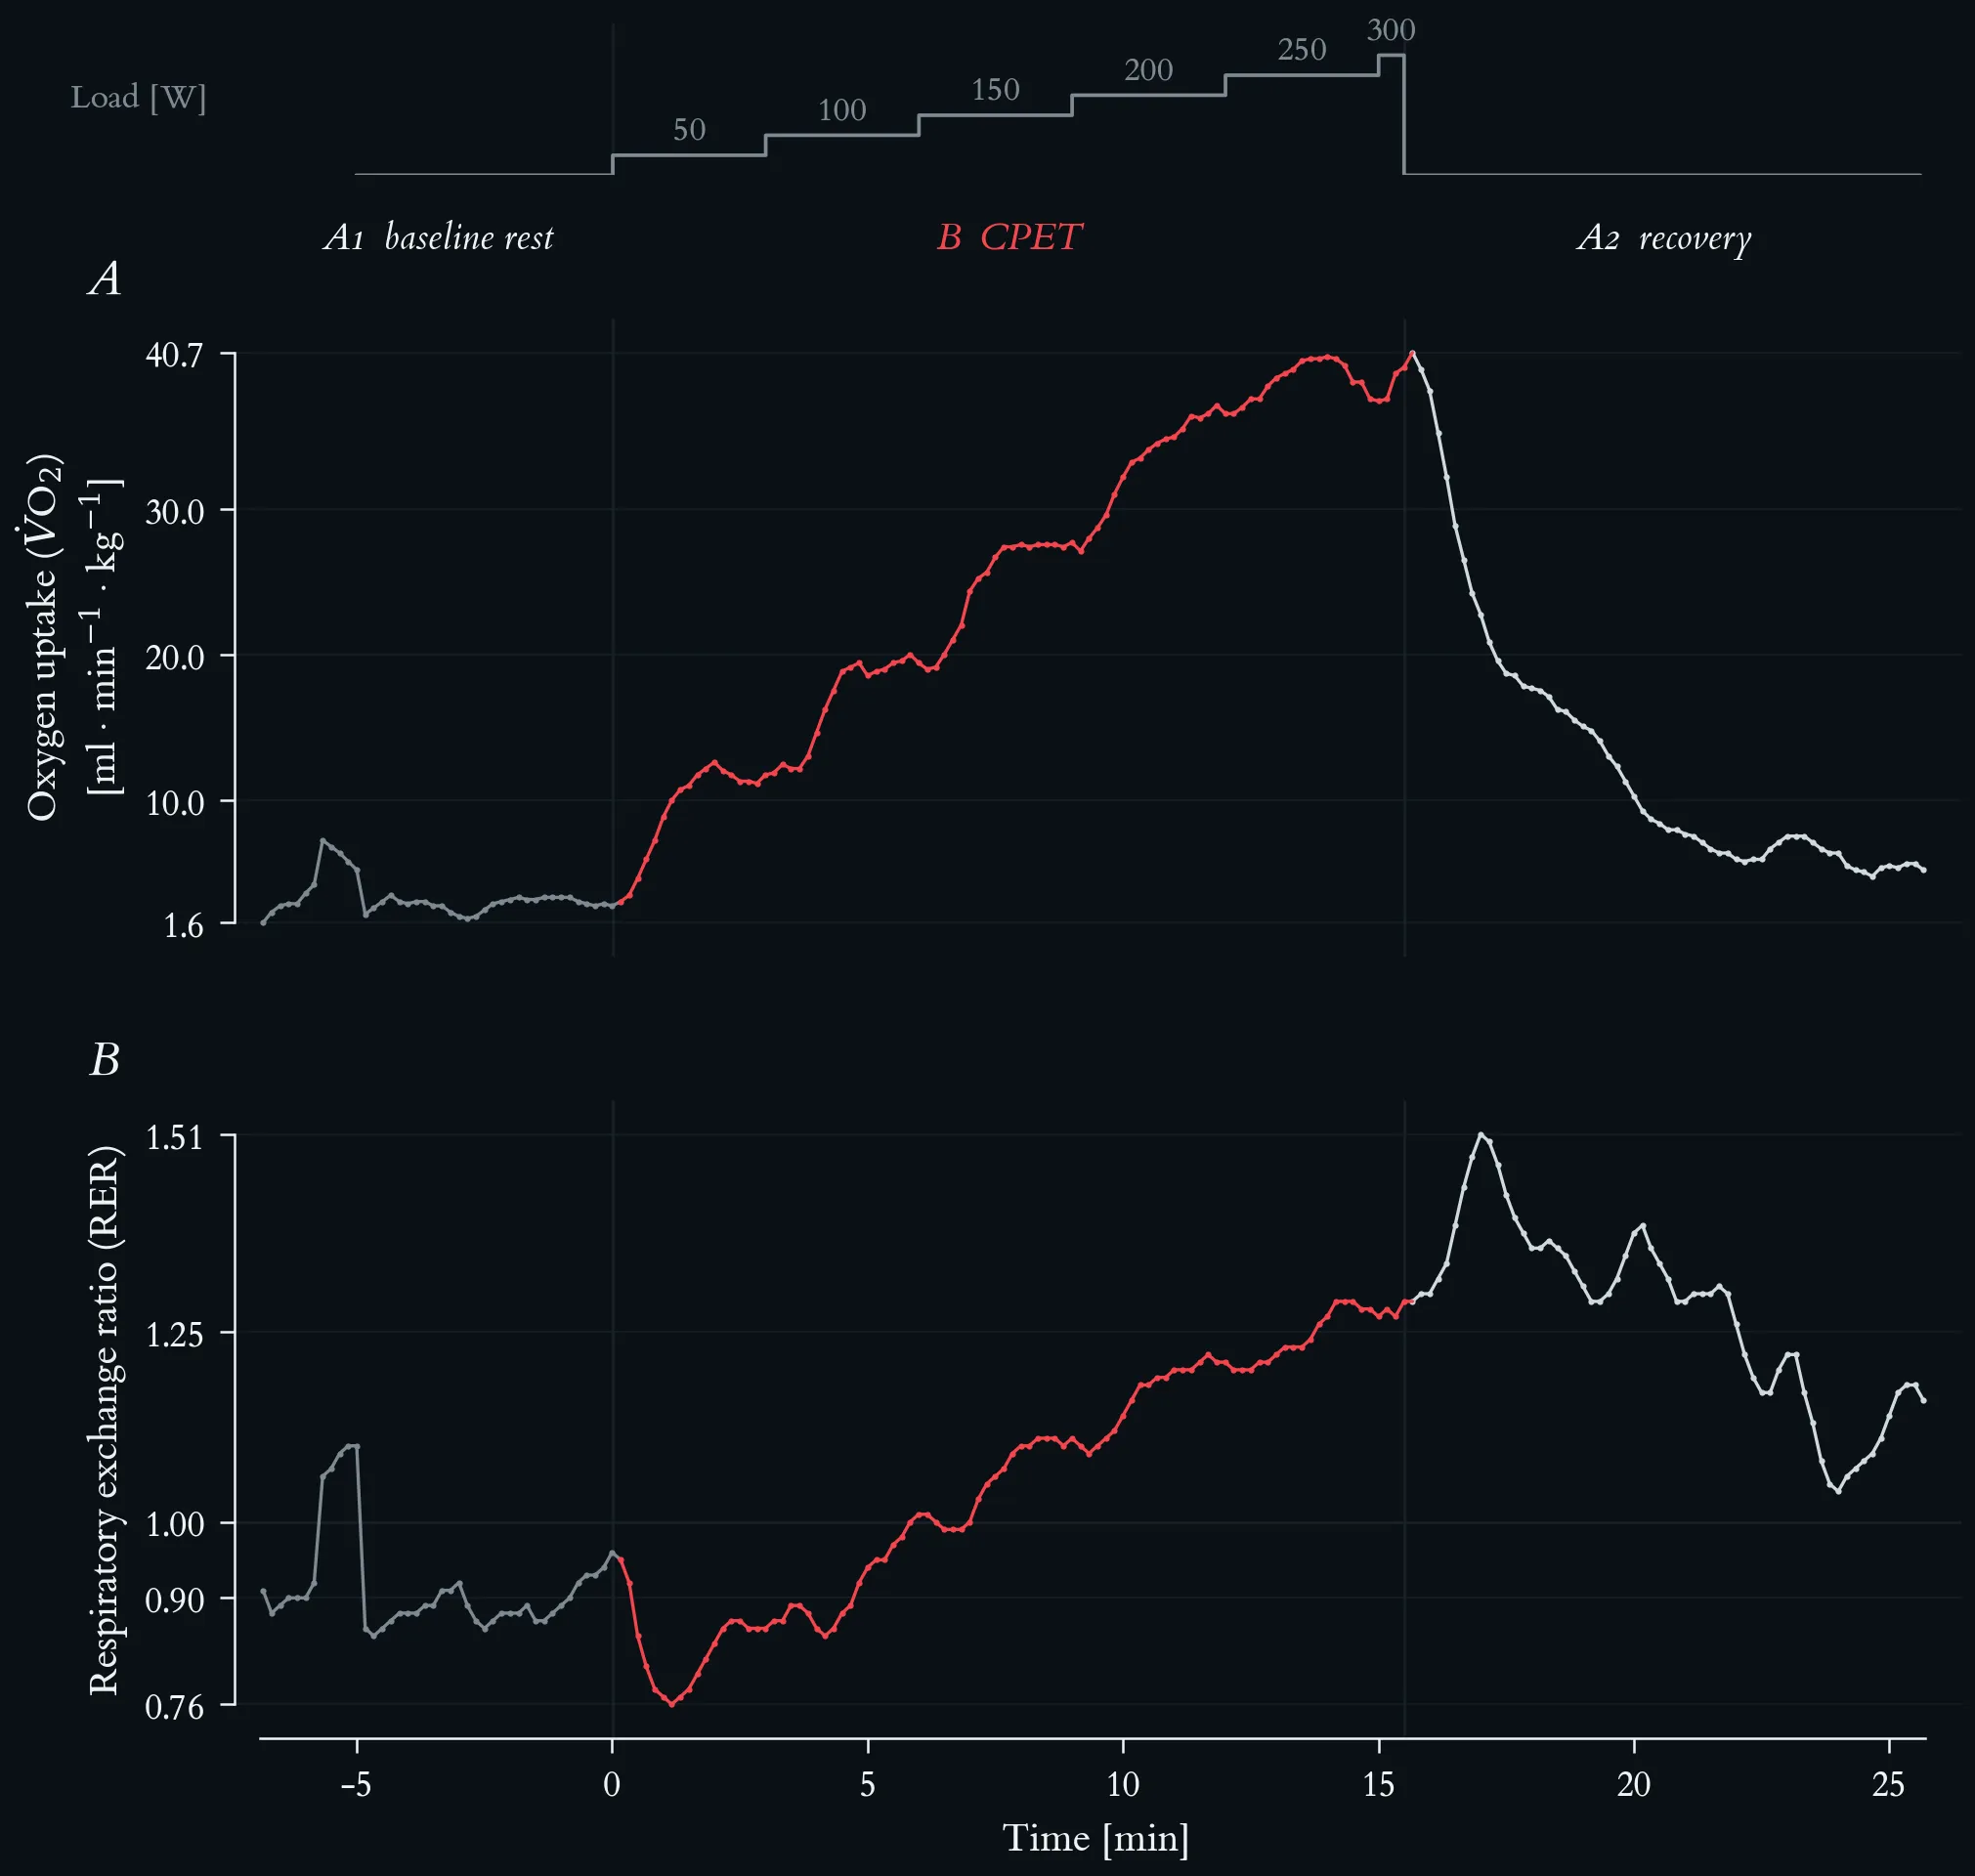
Mass-related oxygen uptake and respiratory exchange ratio across the maximal incremental step test. Top strip: external work rate, incremented by 50 W every three minutes from 50 W to a final 300 W stage terminated after 30 s at volitional exhaustion. Lactate-based reference loads: aerobic threshold 117 W, individual anaerobic threshold 145 W. Phases are A1 baseline rest, B step test (red) and A2 passive recovery; vertical hairlines mark the two transitions. Both series are 10-s averages from the metabolic cart, 196 samples. (A) Mass-related oxygen uptake, V̇O₂ per body mass (69 kg), in ml · min⁻¹ · kg⁻¹, rising from 2.8 at rest to a peak of 40.7 in the first recovery sample. (B) Respiratory exchange ratio (RER), with a hairline at 1.00.
RER sits near 0.89 at rest, drops to 0.76 in the first minute of loading — the usual lag of CO₂ output behind O₂ uptake at exercise onset — and then rises steadily. It crosses 1.00 at 5.8 min, inside the 100 W stage, at a V̇O₂ of 20.0 ml · min⁻¹ · kg⁻¹, that is at about half of the peak value. At the end of the test RER reaches 1.29, so the criterion of RER ≥ 1.15 at maximum is clearly met. The highest value of the whole recording, 1.51, falls at 17.0 min in recovery, when bicarbonate buffering of the accumulated lactate continues to release CO₂ while oxygen uptake has already fallen; RER stays above 1.0 for the entire ten minutes of recovery.
Mass-related oxygen uptake and respiratory exchange ratio at the end of each stage of the maximal incremental step test.
| Load [W] | Time [min] | V̇O₂ [ml · min⁻¹ · kg⁻¹] | RER |
|---|---|---|---|
| rest (A1) | −6.8 – 0.0 | 2.8 | 0.96 (median 0.89) |
| 50 | 0.2 – 3.0 | 11.7 | 0.86 |
| 100 | 3.2 – 6.0 | 19.4 | 1.01 |
| 150 | 6.2 – 9.0 | 27.7 | 1.11 |
| 200 | 9.2 – 12.0 | 36.5 | 1.21 |
| 250 | 12.2 – 15.0 | 37.4 | 1.27 |
| 300 | 15.2 – 15.5 | 39.7 | 1.29 |
| peak (A2) | 15.7 / 17.0 | 40.7 | 1.51 |
Mass-related oxygen uptake and respiratory exchange ratio at the end of each stage of the maximal incremental step test.
2.2.4 Temperature Regulation
- Core body temperature rises due to metabolic heat production.
- Sweating increases — the primary mechanism for heat dissipation during exercise.
- Skin blood flow increases — facilitates heat loss to the environment.
2.3 Recovery and Return to Baseline
Upon cessation of exercise, the organism enters a recovery phase characterized by:
- Gradual reduction in heart rate and breathing rate — occurs in stages (fast and slow phases).
- Restoration of muscle glycogen — aided by insulin sensitivity and GLUT4 translocation.
- Lactate clearance — lactate is oxidized in slow-twitch fibers and the liver.
- Hormonal normalization — stress hormones return to baseline; anabolic hormones increase.
- EPOC (Excess Post-Exercise Oxygen Consumption) — elevated metabolic rate persisting after exercise, fueling recovery processes.
Practical insight: The recovery phase is critical. Regular physical activity improves the efficiency of these regulatory mechanisms, reducing the time required to return to baseline and enhancing overall homeostatic stability.
2.4 Normoxia and Energy Supply
Normoxia means that sufficient O₂ is available at all times for all tasks of a cell, tissue or organ. Under normoxic conditions the O₂ requirement for the respiratory chain is covered by a corresponding O₂ supply.
The short-term increase in O₂ supply can be achieved through increased blood flow; in the medium term through increased O₂ capacity of the blood. Various hormones, body temperature, and mitochondrial uncoupling proteins (e.g. UCP1) influence basal O₂ consumption. Consumption-increasing hormones include catecholamines and thyroid hormones.
2.5 O₂ Deficiency and Energy Supply
O₂ deficiency leads to severely restricted ATP formation. Anaerobic glycolysis cannot compensate for a disruption in O₂ supply in the long term. The resulting lactate and protons transported from cells into the extracellular space can lead to tissue acidosis.
Dry-air composition and partial pressures at sea level.
| Component | Volume (%) | Partial pressure (mmHg) |
|---|---|---|
| N₂ | 78.09 | 593.45 |
| O₂ | 20.95 | 159.21 |
| Ar | 0.927 | 7.04 |
| CO₂ | 0.039 | 0.293 |
Dry-air composition and partial pressures at sea level.
2.6 Breathing and Gas Exchange
Gas exchange occurs in the alveoli by diffusion. After ventilation transports O₂-rich gas into the alveoli, O₂ is absorbed into the blood and CO₂ released. The 1st Fick diffusion law describes pulmonary gas exchange: diffusion current is proportional to the partial pressure difference and exchange area, and inversely proportional to layer thickness. The Krogh diffusion constant for CO₂ is approximately 20 times that of O₂.
At rest:
- Alveolar O₂ fraction: 14 % by volume; O₂ partial pressure: ~100 mmHg
- Alveolar CO₂ fraction: 5.6 % by volume; CO₂ partial pressure: ~40 mmHg
The diffusion capacity for adults at rest is normally 30 mL·min⁻¹·mmHg⁻¹. Contact time for equilibration of partial pressures in the pulmonary capillaries: approximately 0.3–0.7 s.
One-Minute-Paper Topics
A One-Minute-Paper (OMP) is a short, focused prompt that students answer in ~60 seconds at the end of a session to consolidate learning, surface misconceptions, and provide formative feedback. When answering, be concise, specific, and use terminology from today’s session.
- Describe the cascade of cardiovascular adjustments (heart rate, stroke volume, blood redistribution) that occur within the first minutes of aerobic exercise. What is the homeostatic “goal” of these changes?
- How does minute ventilation (V̇E) respond during an incremental exercise test, and what physiological purpose does this serve for maintaining homeostasis?
- What is excess post-exercise oxygen consumption (EPOC), and which metabolic processes does it fund during recovery? Why is it clinically relevant?
- Explain in your own words what Walter Cannon meant by “the wisdom of the body.” How does exercise challenge and ultimately reinforce this wisdom?
Key References
- Cannon WB. The Wisdom of the Body. W. W. Norton & Company; 1932.
- Caspersen CJ, Powell KE, Christenson GM. Physical activity, exercise, and physical fitness: definitions and distinctions for health-related research. Public Health Reports. 1985;100(2):126–131. ISSN 0033-3549.
3 Hormesis: Chronic Adaptation & Clinical Edge
Learning objectives:
- The hormetic dose-response: sub-threshold, hormetic and overload zones
- The dual identity of IL-6, ROS and NF-κB as error signal and adaptive trigger
- Homeostasis vs hormesis in ME/CFS and Long COVID, and the exercise–sleep relationship
3.1 From Homeostatic Regulation to Hormetic Adaptation
The acute physiological responses described in Section 2 restore internal equilibrium through negative feedback — a process canonically attributed to Claude Bernard and Walter Cannon (Cannon, 1932). However, the observation that repeated exercise bouts lead not merely to restoration of the original baseline but to a higher functional set-point demands a second explanatory framework: hormesis (Calabrese & Baldwin, 2002; Calabrese & Mattson, 2017).
Hormesis describes the biphasic dose-response relationship in which low-to-moderate doses of a stressor produce beneficial effects opposite to those observed at high doses (Calabrese & Baldwin, 2002). In exercise physiology, this means that the very inflammatory mediators serving as homeostatic error signals — IL-6, reactive oxygen species (ROS), NF-κB — simultaneously function as dose-dependent adaptive triggers when present at appropriate magnitudes and durations (Calabrese & Mattson, 2017).
More formally, “hormesis refers to adaptive responses of biological systems to moderate environmental or self-imposed challenges through which the system improves its functionality and/or tolerance to more severe challenges. In other words, hormesis is a coordinated response of cells and organisms to an imposed or intrinsically generated challenge that involves multiple integrative signal-transduction processes, each of which is quantitatively hormetic, to coordinate a final holistic response” (Calabrese & Mattson, 2017).
3.2 Hormetic Stress Response
Skeletal muscle and the broader physiological system perpetually encounter intrinsic mechanical and metabolic challenges imposed by physical activity. To cope with exercise-induced stressors — including mechanical loading, metabolic perturbation, oxidative stress, hypoxia, muscle damage, and thermal stress arising from sustained exertion — living organisms have evolved adaptive, protective training responses. At the molecular, cellular, and whole-organism levels, these responses share common regulatory features collectively termed ‘exercise stress’ and rely on evolutionarily conserved, exercise-responsive transcriptional networks (Bauer et al., 2024). The pattern of exercise-induced adaptations is dictated not only by the specific type of training stimulus (e.g., resistance, endurance, or concurrent exercise) but also by its intensity, frequency, and duration — variables central to exercise programming. Each of these factors, alone or in combination, can transiently disrupt physiological homeostasis and impair functional capacity. Sub-maximal training loads, however, elicit beneficial adaptive responses — including muscle hypertrophy, mitochondrial biogenesis, and improved cardiovascular function — that attenuate the physiological cost of subsequent bouts of the same or related exercise stress. This dose-dependent, biphasic adaptive property is known as ‘hormesis’ (Calabrese & Mattson, 2017; Bauer et al., 2024). A hallmark of exercise-induced hormesis is that the adaptive response to a given exercise stressor can extend cross-protective effects against future, and apparently unrelated, forms of physiological stress. The architecture of the exercise-responsive transcriptional network, whereby distinct modes of training regulate overlapping profiles of effector genes — including those encoding heat shock proteins, pro- and anti-inflammatory immune responses, antioxidant enzymes, and angiogenic factors — provides a compelling mechanistic explanation for this phenomenon (Bauer et al., 2024).
Homeostasis time-course: the IL-6 peak, delayed IL-10/IL-1Ra counter-response, functional capacity dip, and the set-point reference line, with annotated phase zones.
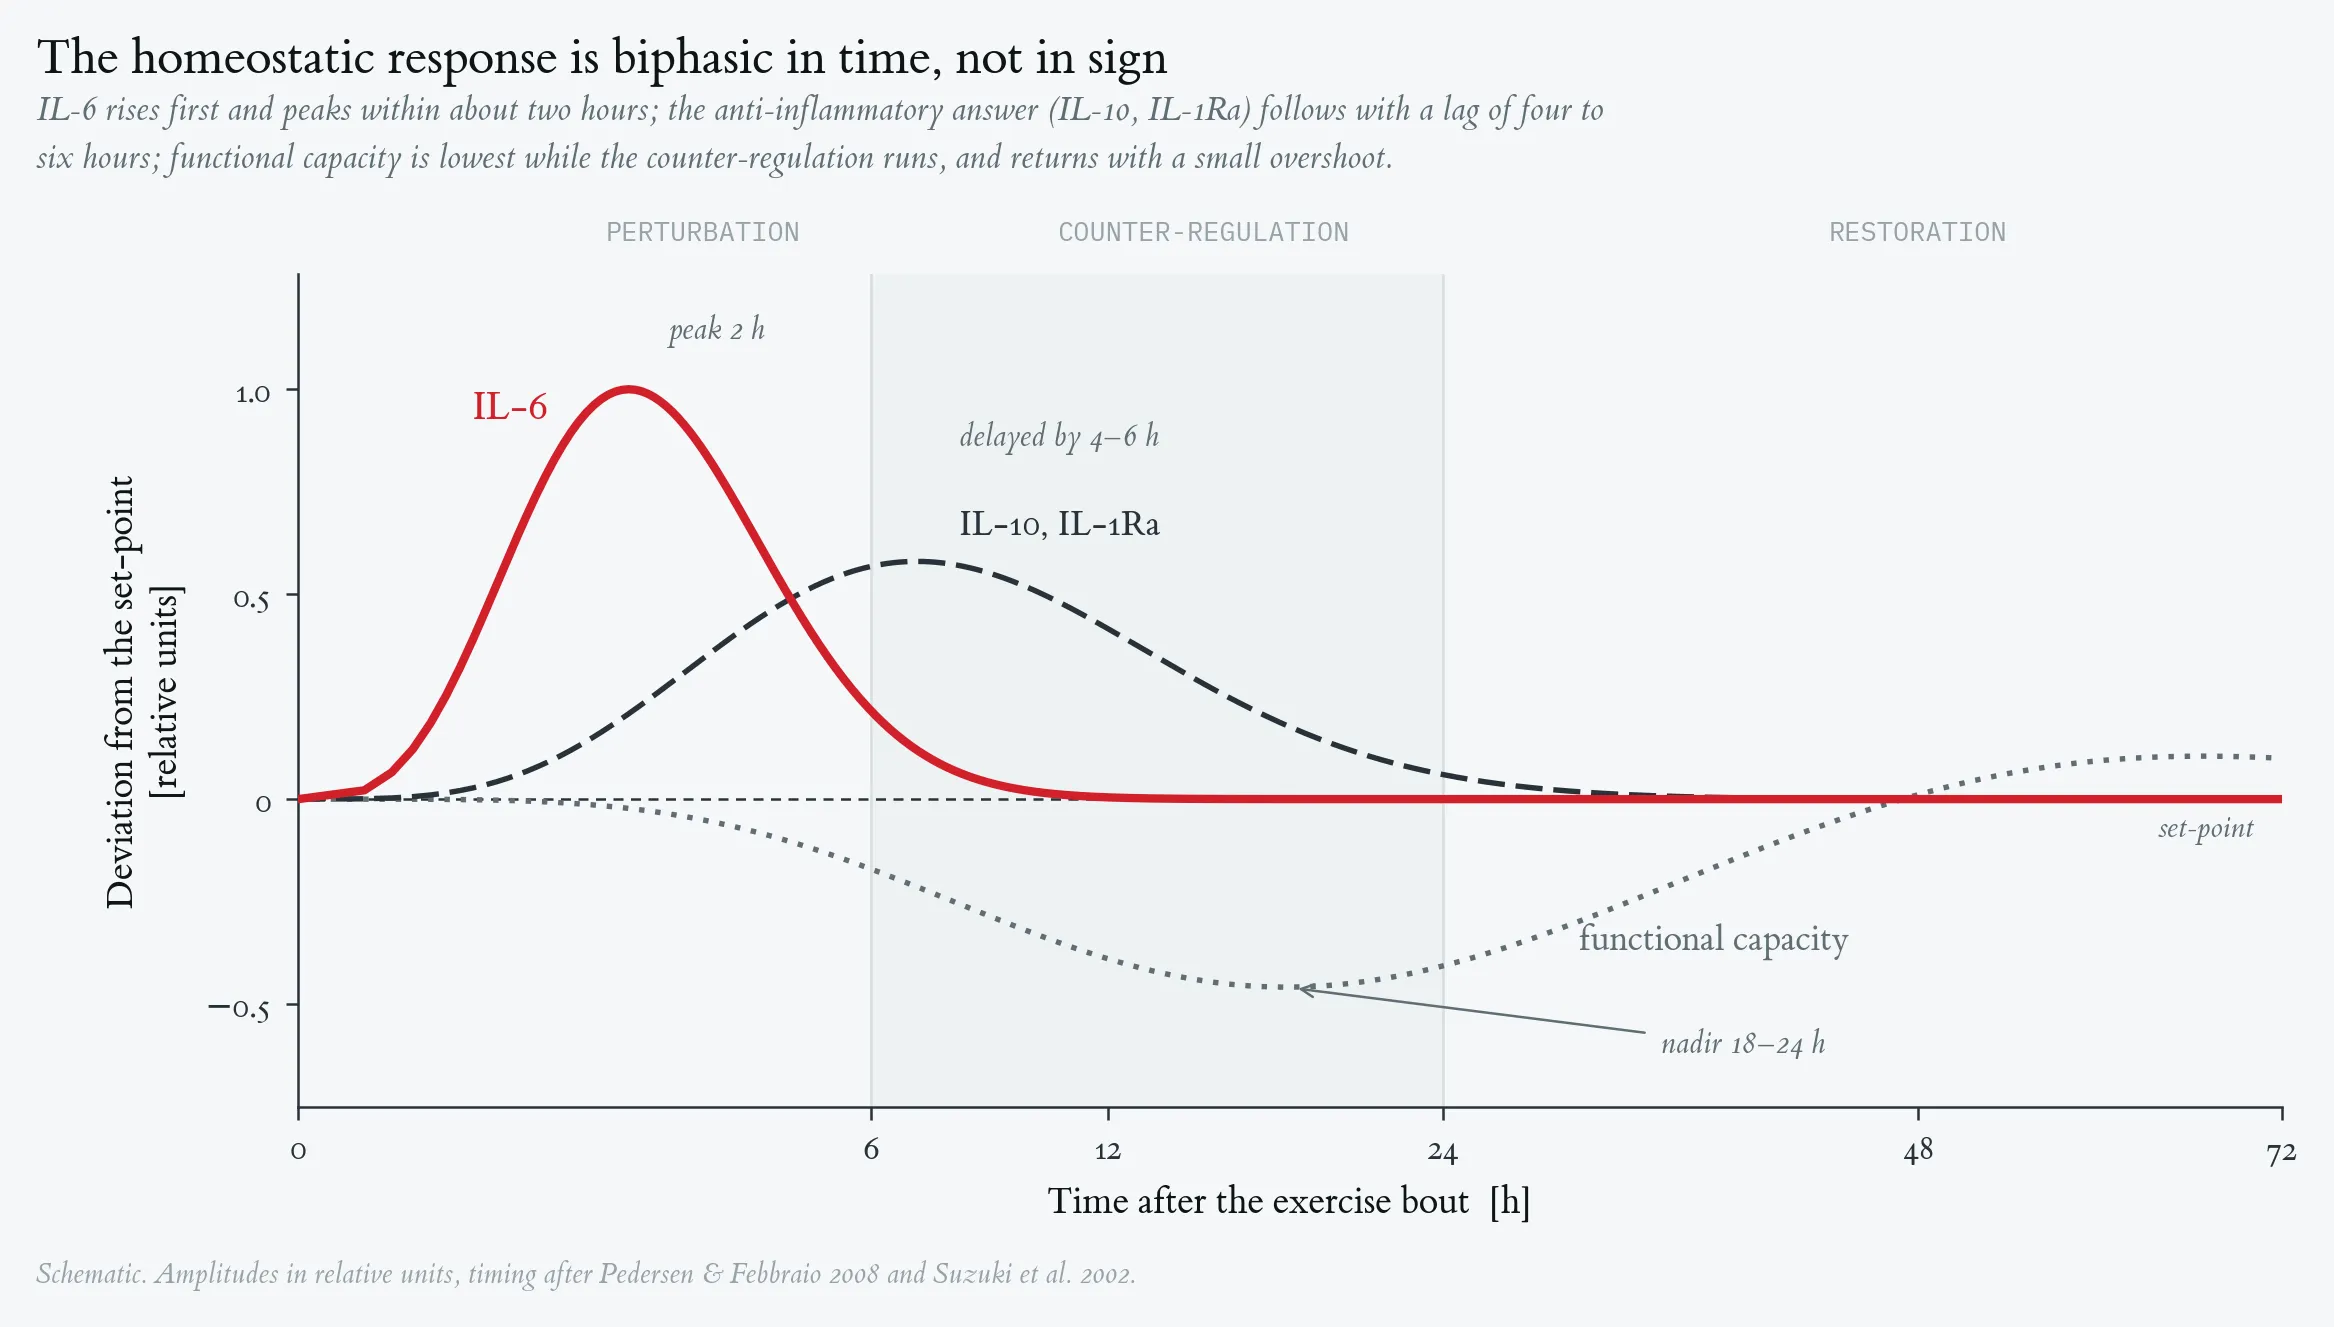
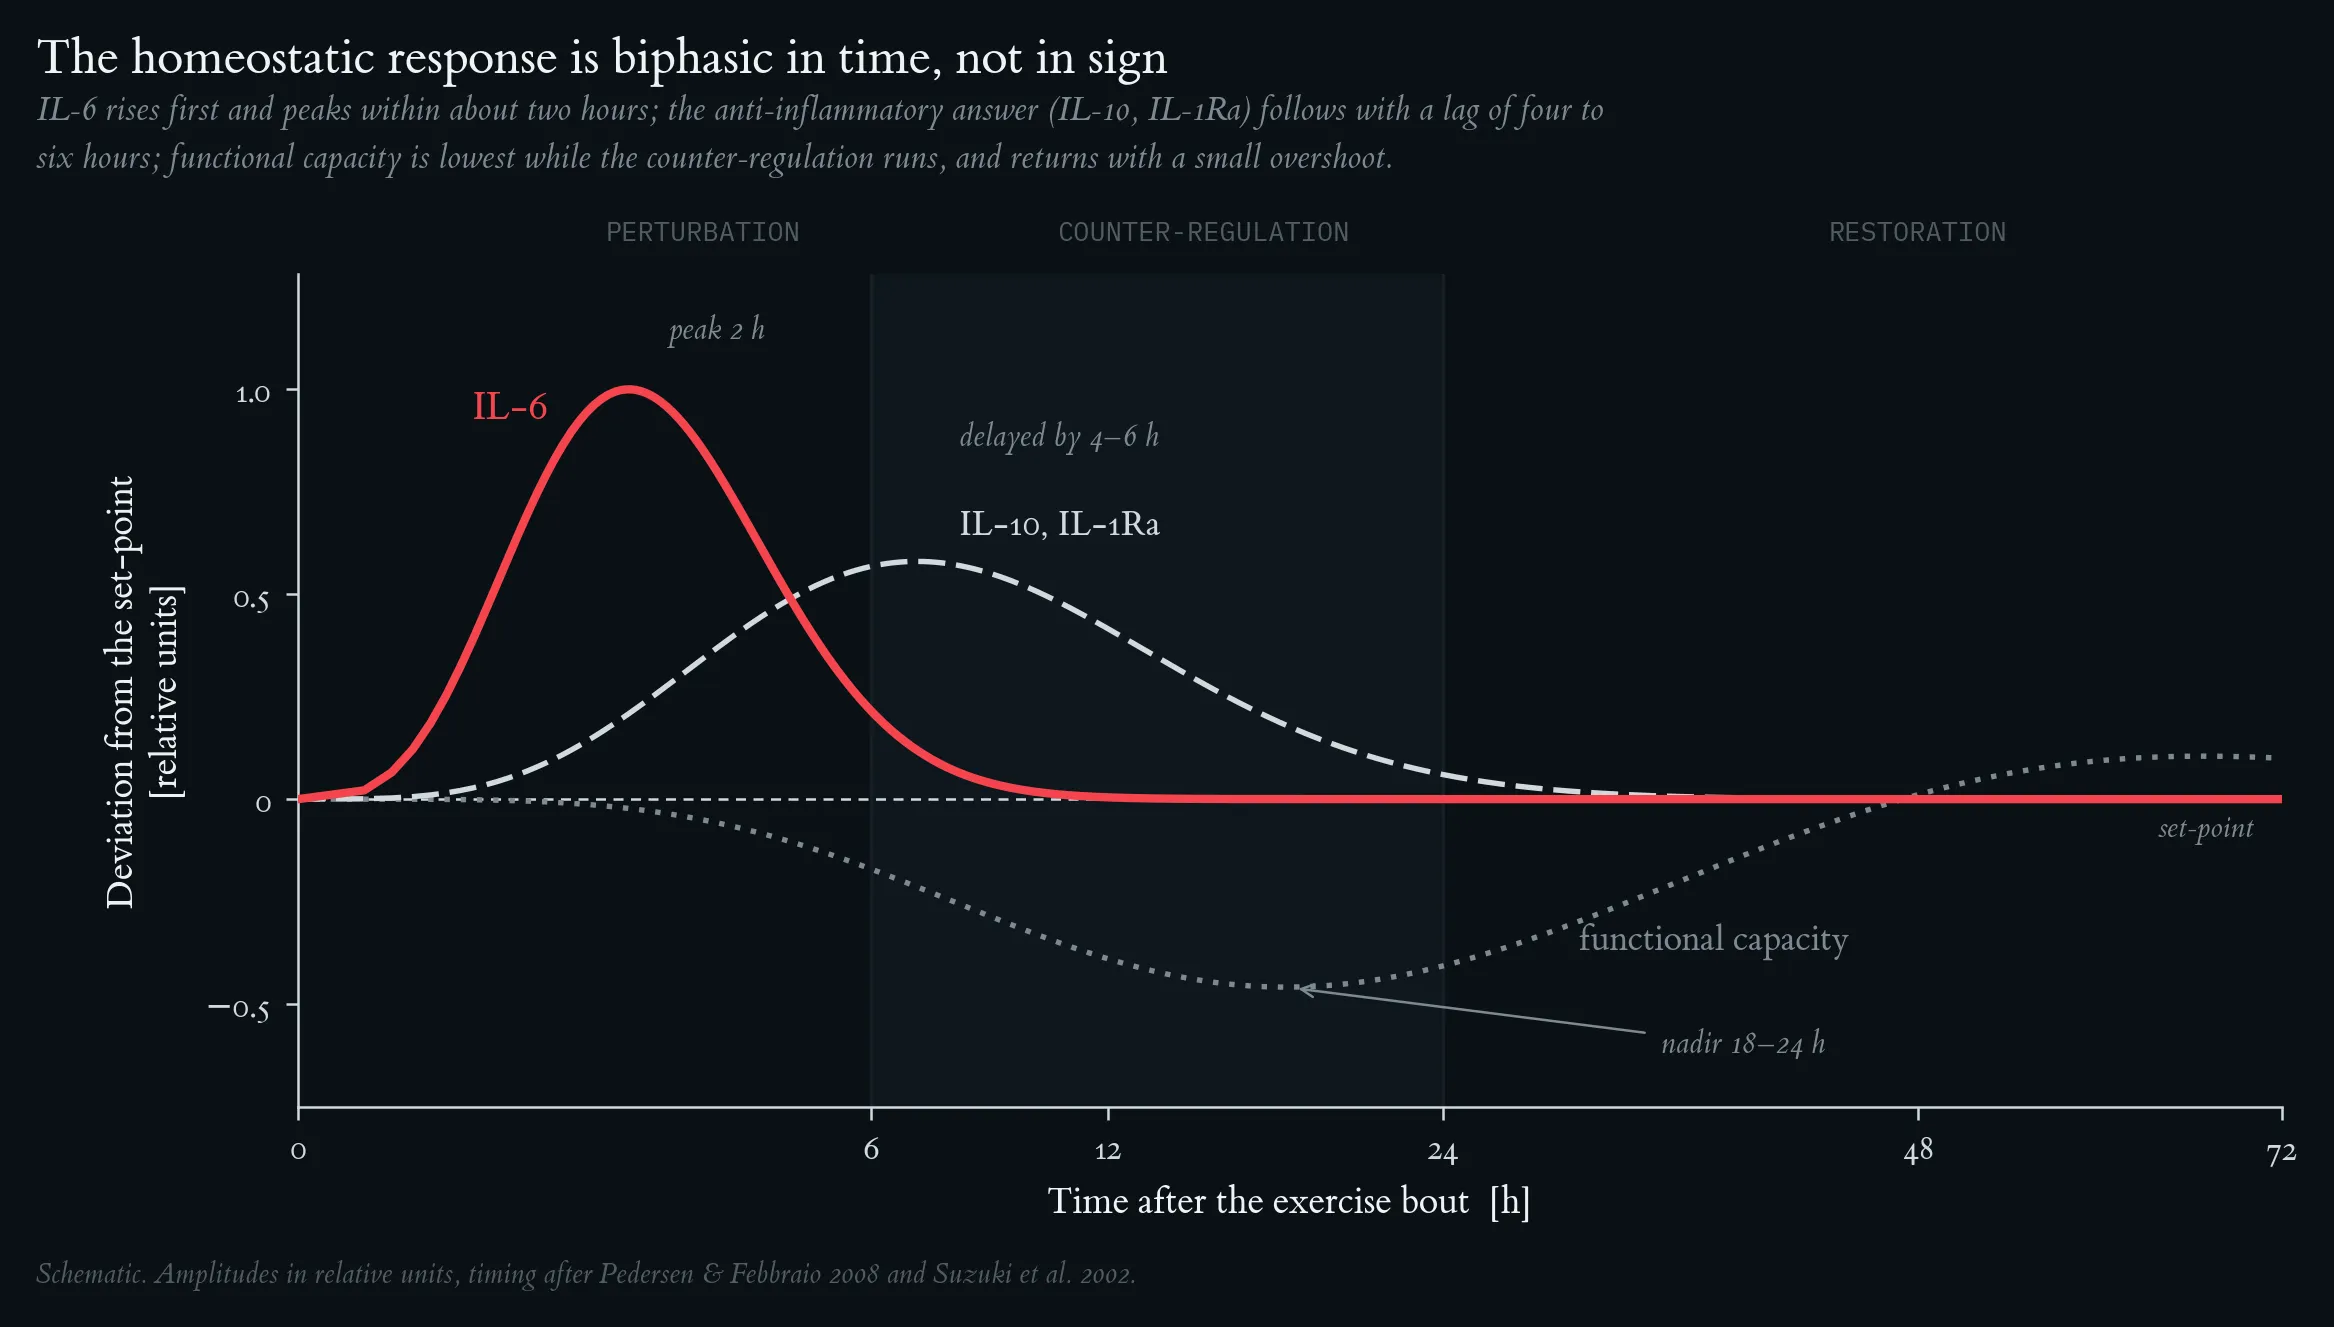
Homeostasis time-course: the IL-6 peak, delayed IL-10/IL-1Ra counter-response, functional capacity dip, and the set-point reference line, with annotated phase zones.
Hormesis dose-response: the full J-curve (URTI risk), bell-shaped adaptive benefit, and monotonically rising inflammatory load, with the three dose zones (sub-threshold / hormetic / overload) shaded.
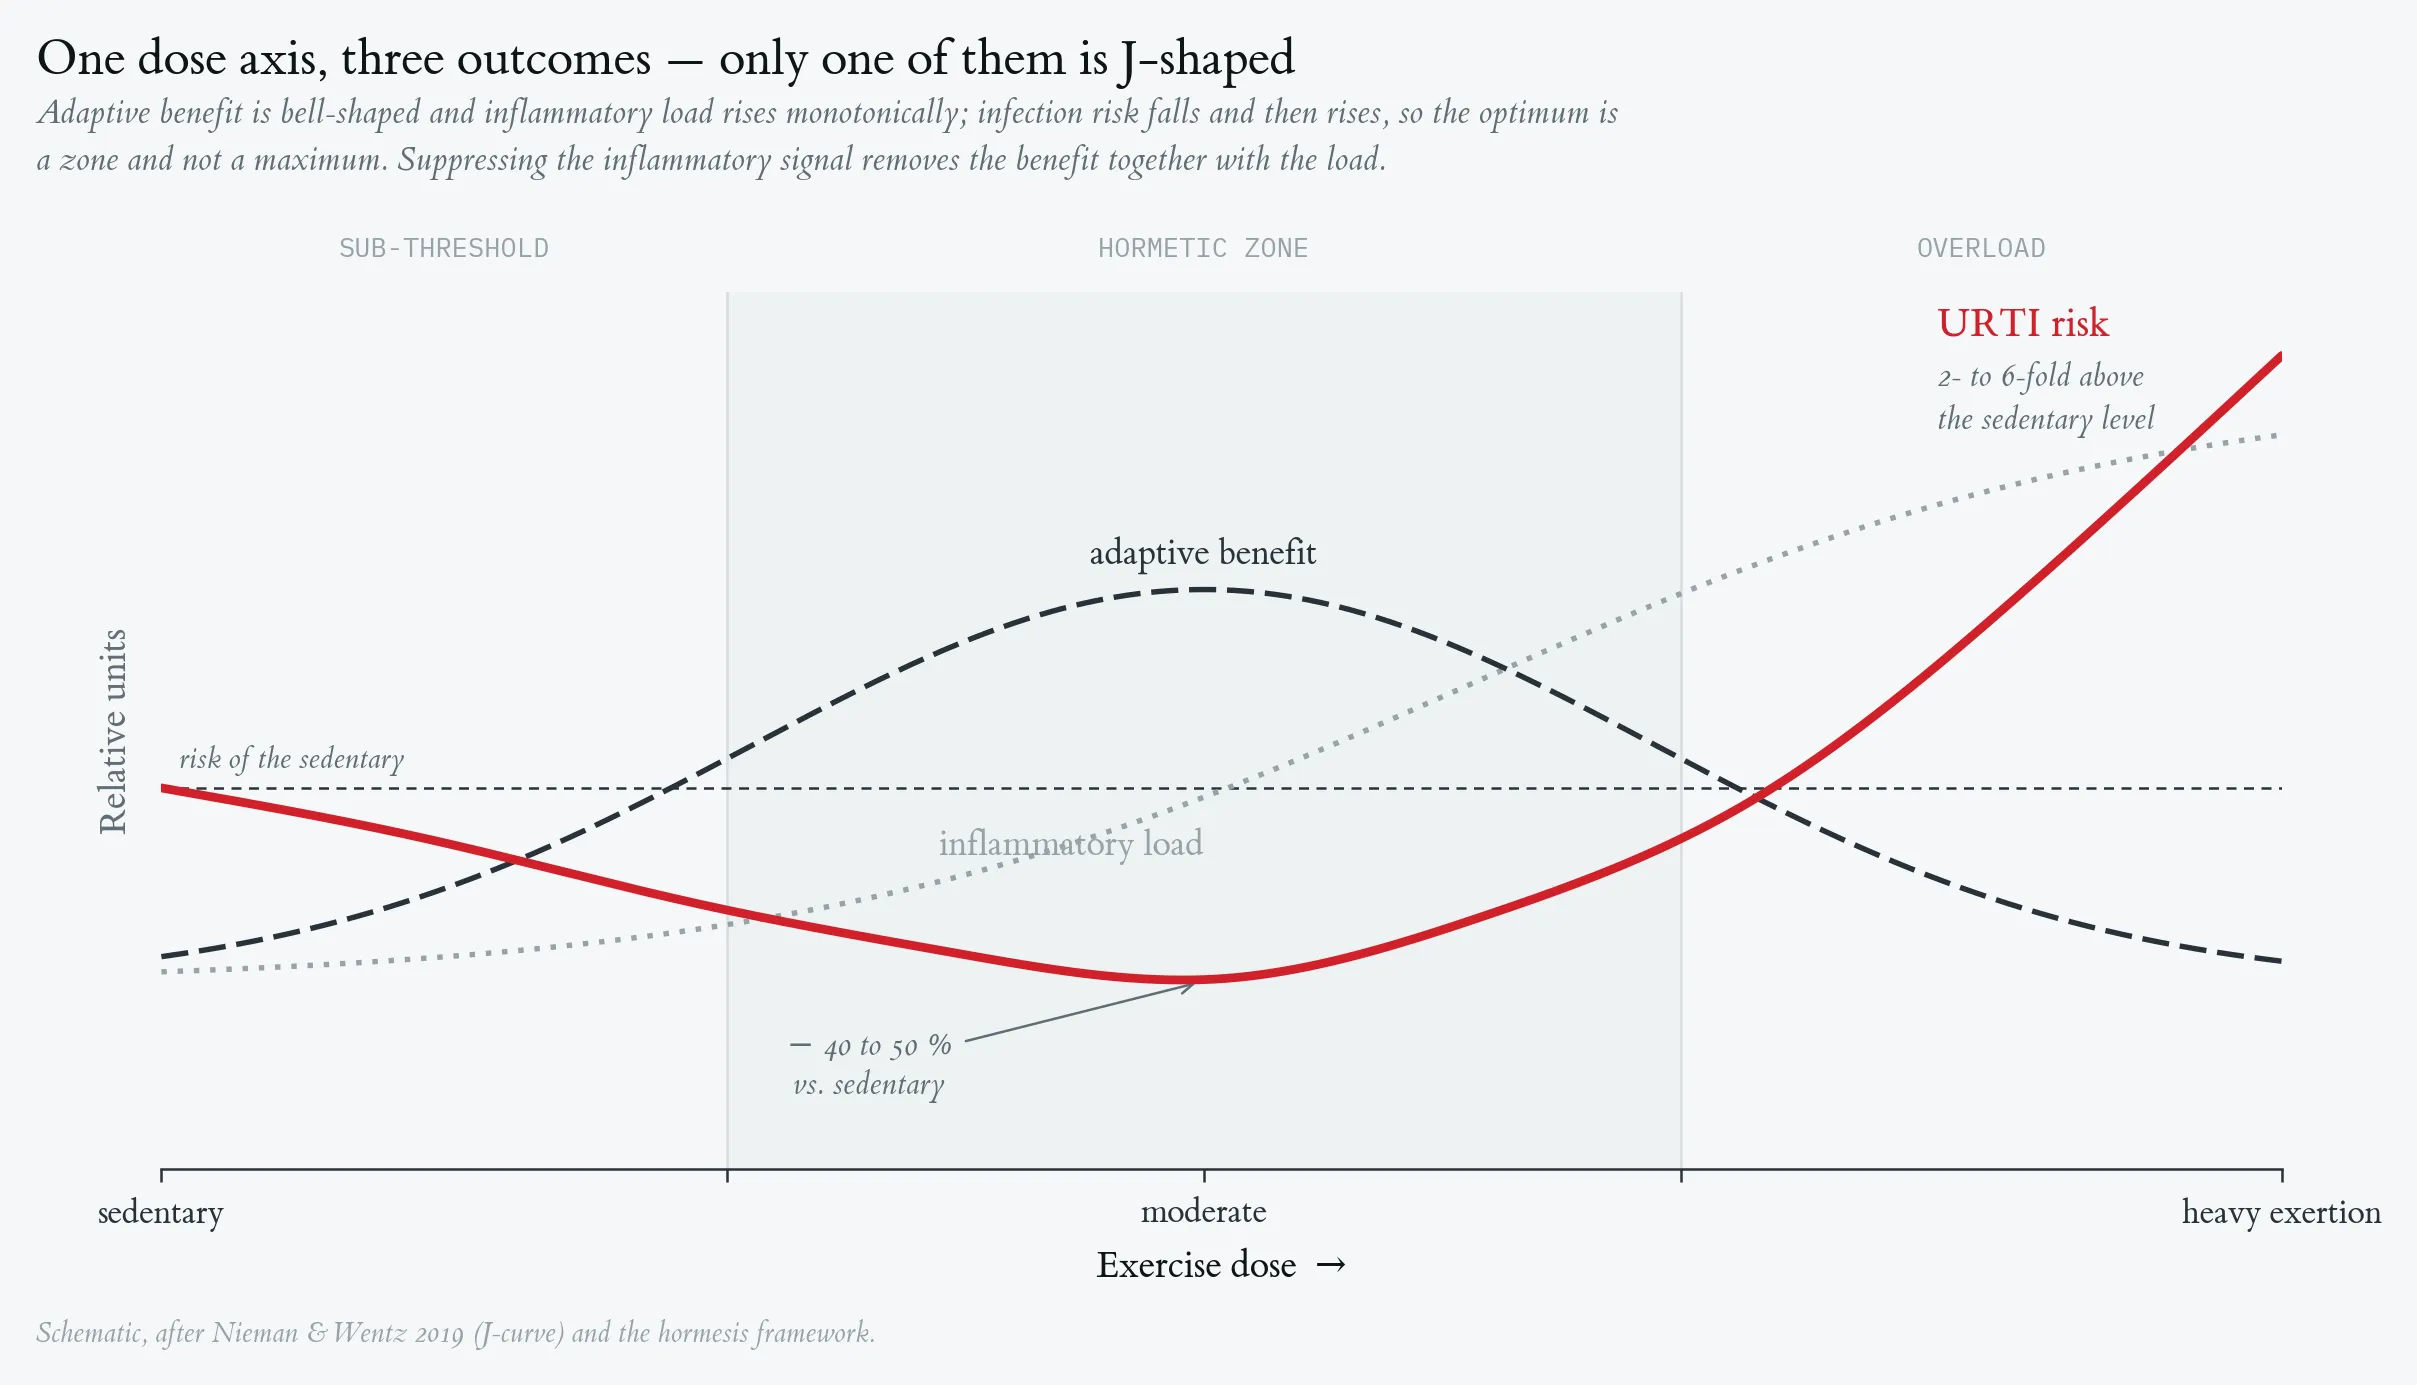
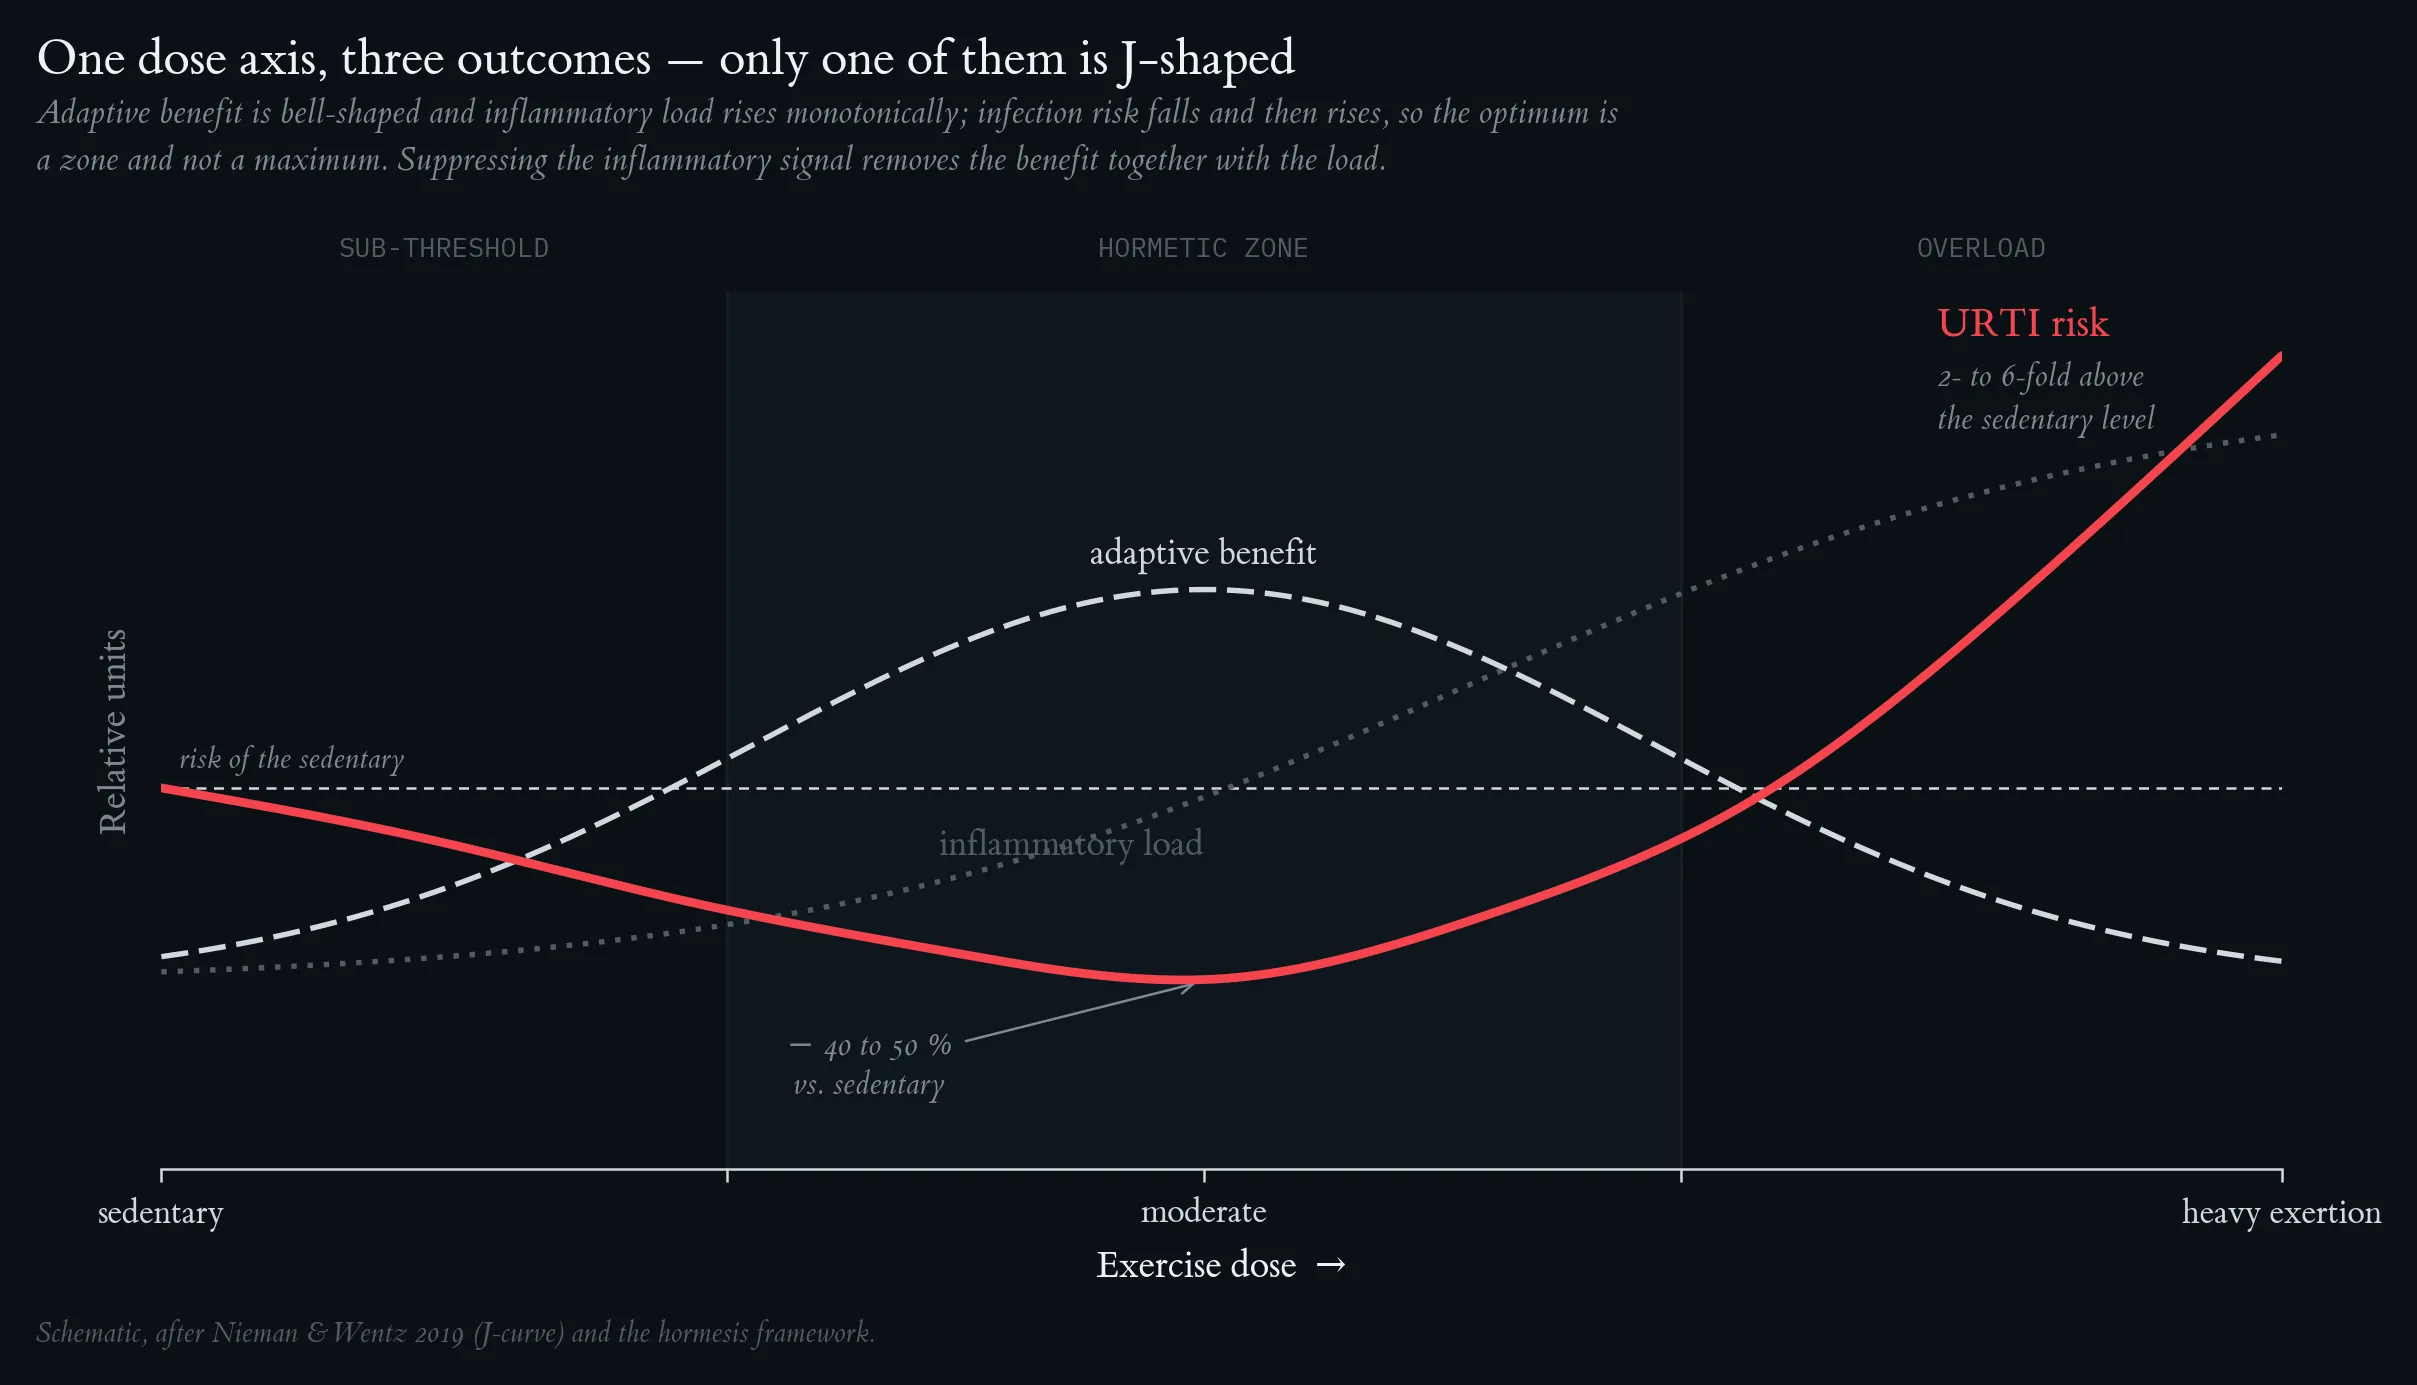
Hormesis dose-response: the full J-curve (URTI risk), bell-shaped adaptive benefit, and monotonically rising inflammatory load, with the three dose zones (sub-threshold / hormetic / overload) shaded.
3.3 The Dual Identity of Inflammatory Mediators
The juxtaposition of homeostasis and hormesis reveals that the same molecular entities serve different functional roles depending on dose and context (Puta & Gabriel, 2025):
- Interleukin-6 (IL-6) functions as a homeostatic error signal communicating perturbation magnitude to the hypothalamus and liver, yet simultaneously acts as a myokine with insulin-sensitising, lipolytic, and anti-inflammatory properties that drive long-term adaptation (Pedersen & Febbraio, 2008).
- Reactive oxygen species (ROS) act as homeostatic damage markers activating NF-κB-driven repair programs at low concentrations, while simultaneously triggering Nrf2-mediated antioxidant upregulation through a hormetic pathway (Ristow et al., 2009).
- NF-κB activates both pro-inflammatory gene targets (TNF-α, IL-1β, COX-2) and protective ones (antioxidant enzymes, anti-apoptotic factors), with the net outcome determined by the intensity and duration of its activation (Puta & Gabriel, 2025).
3.4 Molecular Mediators of the Hormetic Response
At the molecular level, the hormetic response to exercise is mediated by overlapping stress-response pathways (Calabrese & Baldwin, 2002; Calabrese & Mattson, 2017):
- Nrf2 (nuclear factor erythroid 2-related factor 2): activated by exercise-generated ROS; drives the transcription of antioxidant enzymes (SOD, catalase, glutathione peroxidase) and phase II detoxification enzymes.
- PGC-1α (peroxisome proliferator-activated receptor gamma coactivator 1-alpha): activated by AMP/ATP ratio, intracellular calcium, and ROS; orchestrates mitochondrial biogenesis, fibre type transition, and VEGF-driven angiogenesis.
- Heat-shock proteins (HSPs), particularly HSP70 and HSP90: upregulated in response to thermal and oxidative stress; act as molecular chaperones protecting structural and contractile proteins.
- Autophagy induction: exercise activates AMPK-mediated autophagy, clearing dysfunctional organelles and misfolded proteins, contributing to cellular quality control.
A crucial insight is that complete suppression of inflammation — for example through NSAIDs or antioxidants immediately post-exercise — may blunt the adaptive signal and attenuate training-induced gains (Paulsen et al., 2014; Selye, 1946).
3.5 Biphasic Dose-Response and the J-Curve of Immune Function
The hormesis framework organises the exercise dose-response into three operationally distinct zones (Puta & Gabriel, 2025; Nieman, 1994):
- Sub-threshold zone (sedentary to light activity): insufficient stimulus for meaningful adaptive programming.
- Hormetic zone (moderate to vigorous exercise): net adaptive benefit peaks; URTI risk falls approximately 38 % below population average (Nieman, 1994); Nrf2 and PGC-1α pathways are maximally activated.
- Overload zone (extreme training load): inflammatory load overwhelms adaptive reserves; immune suppression ensues consistent with the open-window hypothesis (Nieman, 1994; Nieman & Wentz, 2019).
The J-curve of upper respiratory tract infection (URTI) risk across the exercise intensity spectrum, first articulated by Nieman (Nieman, 1994), is the most widely cited empirical anchor for the hormetic dose-response in exercise immunology. At the moderate exercise level, URTI risk reaches its nadir; at the heavy-to-extreme transition, URTI risk exceeds the sedentary baseline, marking the operational equivalent of the hormetic toxicity threshold.
3.6 Complementary Temporal Scales
Homeostasis and hormesis are not competing theories but complementary descriptions of the same biology at different temporal scales (Puta & Gabriel, 2025):
- In the acute window (0–24 h post-exercise), the homeostatic frame predominates: the organism’s priority is to restore internal equilibrium through negative feedback.
- In the sub-acute and chronic adaptation window (24 h to multiple training cycles), the hormetic frame becomes operative: if the inflammatory signal was of appropriate magnitude and the resolution phase was complete, molecular memory — in the form of elevated Nrf2 target gene expression, increased mitochondrial density, and epigenetic modification of stress-response promoters — shifts the set-point upward (supercompensation).
Mechanistic contrast between homeostasis and hormesis frameworks applied to exercise-induced inflammation (adapted from Puta & Gabriel, 2025).
| Dimension | Homeostasis framework | Hormesis framework |
|---|---|---|
| Primary signal role of IL-6/ROS | Error signal (perturbation magnitude) | Adaptive stimulus (dose-dependent trigger) |
| Feedback direction | Negative (corrective) | Forward at low dose; negative at overload |
| Set-point outcome | Preserved at baseline | Elevated (supercompensation) |
| Dose-response shape | Linear / monotonic resolution | Biphasic / inverted-U |
| Inflammation framing | Perturbation to be resolved | Necessary adaptive trigger |
| Key regulatory node | IL-10 axis, HPA cortisol | Nrf2, PGC-1α, HSPs, autophagy |
| Optimal treatment strategy | Anti-inflammatory resolution support | Preserve signal; avoid premature blunting |
| Failure mode | Unresolved chronic inflammation | Overtraining / immunosuppression |
Mechanistic contrast between homeostasis and hormesis frameworks applied to exercise-induced inflammation (adapted from Puta & Gabriel, 2025).
3.7 Pathological Contexts: ME/CFS, Long COVID, and Post-Exertional Malaise
In populations with myalgic encephalomyelitis/chronic fatigue syndrome (ME/CFS) and Long COVID, post-exertional malaise (PEM) represents a pathological exaggeration of the post-exercise inflammatory state (Carruthers et al., 2011; Komaroff & Lipkin, 2021). Within the dual-framework model, PEM can be conceptualised as a combination of two discrete abnormalities (Puta & Gabriel, 2025):
- Failure of homeostatic resolution: the counter-regulatory response (IL-10, IL-1Ra) is either insufficient, delayed, or overridden by persistent upstream activation, leaving the inflammatory perturbation unresolved beyond 24–48 h.
- Right-shift or inversion of the hormetic dose-response curve: the threshold between the sub-threshold and overload zones narrows critically, such that exercise doses producing adaptive benefits in healthy individuals fall within or above the overload zone for the affected individual.
This model provides a theoretical basis for the observation that graded exercise therapy (GET) — predicated on the homeostatic assumption that graduated perturbations will lead to adaptive set-point elevation — is not only ineffective but actively harmful in ME/CFS, because the hormetic adaptive machinery is unavailable or compromised (Puta & Gabriel, 2025; Carruthers et al., 2011; Komaroff & Lipkin, 2021).
Practical insight: Homeostasis governs the immediate inflammatory resolution following exercise, while hormesis explains the long-term adaptive gains. Recognising their complementary nature is essential for optimal exercise prescription — particularly in clinical populations where resolution capacity may be impaired and the hormetic dose-response curve may be critically altered.
3.8 Sleep Architecture and Physiology
Sleep is a vital physiological state characterized by reduced responsiveness to external stimuli and reversibility. It consists of two main types:
3.8.1 Non-REM (NREM) Sleep
- Stage 1 (Light sleep): Transition from wakefulness; muscle tone decreases; brain waves slow.
- Stage 2 (Intermediate sleep): Further slowing of brain waves; characterized by sleep spindles and K-complexes.
- Stage 3 (Deep sleep/Slow-wave sleep): Highest threshold for arousal; greatest brain wave slowing; major restorative processes occur.
3.8.2 REM Sleep (Rapid Eye Movement Sleep)
- Characterized by rapid eye movements, muscle atonia, and vivid dreams.
- Brain activity resembles wakefulness, but voluntary movement is inhibited.
- Occupies ~20–25 % of total sleep time in adults.
3.9 Sleep Cycles and Duration
A complete sleep cycle lasts approximately 90 minutes and progresses through stages 1–3 of NREM followed by REM sleep. Most restorative sleep occurs during stages 3 (deep sleep) and REM phases. Adults require 7–9 hours of sleep per night for optimal physiological function.
3.10 Physiological Functions of Sleep
Sleep serves multiple critical functions:
- Physical restoration — tissue repair, protein synthesis, growth hormone secretion.
- Metabolic regulation — glucose homeostasis, insulin sensitivity, lipid metabolism.
- Immune function — T-cell proliferation, cytokine production, immune memory consolidation.
- Cognitive consolidation — memory consolidation (both declarative and procedural).
- Cerebral clearance — removal of metabolic waste products via the glymphatic system.
- Thermoregulation — core body temperature decreases during sleep.
3.11 Relationship Between Exercise and Sleep
Physical activity promotes sleep quality through multiple mechanisms:
- Increased sleep pressure — physical activity depletes energy substrates and increases adenosine, promoting sleep.
- Enhanced thermoregulation — exercise-induced increase in core body temperature followed by a rapid drop facilitates sleep onset.
- Stress reduction — regular physical activity reduces cortisol levels and psychological stress.
- Improved circadian alignment — morning exercise synchronizes the circadian rhythm, facilitating sleep at appropriate times.
Sleep deprivation impairs exercise performance and recovery:
- Reduced strength and power output.
- Increased injury risk — impaired neuromuscular control.
- Blunted training adaptations — reduced mitochondrial biogenesis and angiogenesis.
- Immune suppression — increased susceptibility to infections.
- Metabolic dysregulation — increased carbohydrate cravings and reduced insulin sensitivity.
Practical insight: A bidirectional relationship exists between exercise and sleep. Regular physical activity improves sleep quality, and adequate sleep enhances exercise performance and training adaptations. Prioritizing both is essential for optimal health outcomes.
One-Minute-Paper Topics
A One-Minute-Paper (OMP) is a short, focused prompt that students answer in ~60 seconds at the end of a session to consolidate learning, surface misconceptions, and provide formative feedback. When answering, be concise, specific, and use terminology from today’s session.
- Describe the three dose zones of the hormetic dose–response (sub-threshold, hormetic, overload). Give one physiological example for each zone in the context of exercise.
- Interleukin-6 plays opposite roles depending on context. Explain the difference between IL-6 as a homeostatic error signal and IL-6 as an anti-inflammatory myokine produced by contracting muscle.
- How does exercise-generated ROS activate the Nrf2 pathway, and why would taking high-dose antioxidants immediately post-exercise blunt training adaptations?
- What cellular conditions activate PGC-1α during exercise, and what downstream adaptations does it orchestrate? Why is this molecule central to the hormetic framework?
- Sketch the J-curve of upper respiratory tract infection risk across exercise intensity zones. At which point is URTI risk lowest, and what happens in the overload zone?
- Why are homeostasis and hormesis described as “complementary descriptions of the same biology at different temporal scales”? Use a 72-hour post-exercise timeline to illustrate your answer.
- The lecture states that “complete suppression of inflammation may blunt the adaptive signal.” What is the evidence for this claim, and what practical implications does it have for athletes?
- Using the dual-framework model (homeostasis + hormesis), explain why graded exercise therapy (GET) may be harmful in ME/CFS. What two discrete abnormalities does the model identify in PEM?
- Distinguish between NREM Stage 3 (slow-wave sleep) and REM sleep in terms of brain activity, physiological function, and proportion of total sleep time in healthy adults.
- What is the glymphatic system, and why is deep (NREM Stage 3) sleep particularly important for cerebral metabolic waste clearance? How might exercise influence this process?
- List two mechanisms by which regular physical activity improves sleep quality, and two mechanisms by which sleep deprivation impairs exercise performance. What does “bidirectional” mean here?
- The lecture describes exercise-induced temperature regulation as a facilitator of sleep onset. Explain the thermodynamic mechanism: how does a post-exercise drop in core body temperature promote sleep?
- Distinguish between “restoration of baseline” (homeostatic outcome) and “set-point elevation / supercompensation” (hormetic outcome). What molecular memory processes make supercompensation possible?
- For a healthy recreational runner and a patient with Long COVID, how would you use the homeostasis–hormesis comparison table in Section 3.6 to justify different exercise prescriptions? Which framework is most relevant for each, and why?
Key References
- Bauer M, Ermolaeva M, Singer M, Wetzker R, Soares MP. Hormesis as an adaptive response to infection. Trends in Molecular Medicine. 2024;30(7):633–642. doi:10.1016/j.molmed.2024.04.012.
- Calabrese EJ, Baldwin LA. Defining hormesis. Human & Experimental Toxicology. 2002;21(2):91–97.
- Calabrese EJ, Mattson MP. How does hormesis impact biology, toxicology, and medicine? npj Aging and Mechanisms of Disease. 2017;3:13. doi:10.1038/s41514-017-0013-z.
- Carruthers BM, van de Sande MI, De Meirleir KL, et al. Myalgic encephalomyelitis: International consensus criteria. Journal of Internal Medicine. 2011;270(4):327–338.
- Komaroff AL, Lipkin WI. Insights from myalgic encephalomyelitis/chronic fatigue syndrome may help unravel the pathogenesis of post-acute COVID-19 syndrome. Trends in Molecular Medicine. 2021;27(9):895–906.
- Nieman DC. Exercise, infection, and immunity. International Journal of Sports Medicine. 1994;15(S3):S131–S141.
- Pedersen BK, Febbraio MA. Muscle as an endocrine organ: focus on muscle-derived interleukin-6. Physiological Reviews. 2008;88(4):1379–1406.
- Puta C, Gabriel H. Homeostasis and hormesis as complementary frameworks for exercise-induced inflammation: a conceptual simulation analysis. Friedrich-Schiller-Universität Jena, Institute for Sports Science; 2025.
- Ristow M, Zarse K, Oberbach A, et al. Antioxidants prevent health-promoting effects of physical exercise in humans. Proceedings of the National Academy of Sciences. 2009;106(21):8665–8670.
4 Intensity Determination & Diagnostics
Learning objectives:
- The T1/T2 threshold concepts across metabolic and ventilatory models
- Limits of %V̇O₂max, %HRmax and MET-based intensity prescription
- Intensity anchoring in practice: ACSM–ESSA levels, RIR, RPE, HRmax/HRR
4.1 Background
The anaerobic threshold is a conceptual approach developed to determine the exercise intensity at which arterial blood lactate concentration begins to increase sharply during an incremental exercise test. During such tests, blood lactate accumulation is attributed to inadequate oxygen delivery to contracting muscle resulting in increased rates of glycolysis and lactate production.
The anaerobic threshold represents the maximum lactate steady state — the metabolic point at which muscular lactate formation and elimination from skeletal muscles are just about balanced. From the perspective of gas exchange, this point also represents the maximum equilibrium of oxygen uptake in the organism.
4.2 Physiological Responses Above the Anaerobic Threshold
- Accelerated muscle glycogen utilisation and anaerobic regeneration of ATP
- Reduced exercise endurance
- Metabolic acidosis
- Delay in V̇O₂ steady state
- Increased V̇CO₂ over that predicted from aerobic metabolism
- Increased PaCO₂ and PETCO₂ with time
- Bohr effect — increasing O₂ extraction from blood rather than decreasing capillary PO₂
- Increased plasma electrolyte concentration
- Hemoconcentration
- Increased production of metabolic intermediaries (e.g. glycerol phosphate, alanine)
- Increased catecholamine levels
- Increased double product (systolic blood pressure × heart rate)
4.3 Threshold Concepts — Overview
Threshold concepts at T1 and T2 across metabolic, gas-exchange and ventilatory models.
| Threshold | Concept | Description |
|---|---|---|
| T1 | Lactate threshold | Blood lactate begins to rise above baseline; upper boundary for nearly exclusive aerobic metabolism |
| T1 | Gas exchange threshold | Transition from steady-state to excess CO₂ production |
| T1 | Ventilatory threshold | First breakpoint of systematic increase in V̇E/V̇O₂ |
| T2 | Critical power | Asymptote of the power–duration relationship |
| T2 | Maximum lactate steady-state | Highest constant workload with equilibrium between lactate production and elimination |
| T2 | Respiratory compensation point (RCP) | Second breakpoint of systematic increase in V̇E/V̇O₂ |
Threshold concepts at T1 and T2 across metabolic, gas-exchange and ventilatory models.
4.4 How to Determine and Monitor the Different Exercise Intensities
There is currently no consensus regarding which of the many commonly used methods to establish different exercise intensities for different populations is best (Bishop et al., 2025). Traditional methods for determining exercise intensity include: (a) threshold-based approaches, using the first and second metabolic thresholds (MT1 and MT2) to demarcate exercise domains; (b) percentages of different anchor measurements, such as %VO₂max, %HRmax, or %HRR, which — despite widespread use — do not achieve category-specific cardiovascular and metabolic responses in all individuals; (c) fixed values, such as metabolic equivalents (METs), which do not adequately consider individual differences in age, sex, body mass, and fitness; and (d) perceptual measures, most notably the Rating of Perceived Exertion (RPE), which integrates feelings of effort, strain, and fatigue from peripheral muscles, the cardiopulmonary system, and the central nervous system (Bishop et al., 2025). A joint American College of Sports Medicine (ACSM) Expert Statement and Exercise and Sports Science Australia (ESSA) Consensus Statement proposed a standardised five-level exercise intensity terminology — Very Low, Low, Moderate, High, and Very High — applicable to both cardiorespiratory and resistance exercise, together with five corresponding perception-of-effort descriptors: very easy, easy, somewhat hard, hard, and very hard (Bishop et al., 2025). The preferred method for prescribing cardiorespiratory exercise intensity is the direct measurement of metabolic thresholds and the work rate associated with the attainment of VO₂max during a graded exercise test (GXT), as this produces similar physiological stresses across individuals with different exercise capacities (Bishop et al., 2025). For resistance exercise, the statement recommends prescribing intensity via repetitions in reserve (RIR) rather than percentage of one-repetition maximum (%1-RM), since RIR better captures both load and proximity to neuromuscular failure (Bishop et al., 2025). RPE is recommended as a useful adjunct method to help monitor both cardiorespiratory and resistance exercise, particularly when laboratory-based assessments are not available (Bishop et al., 2025). The first two tables below summarise the current descriptors and criteria from leading organisations, while the third presents the proposed standardised classifications anchored to metabolic thresholds, RIR, and RPE scales (Bishop et al., 2025).
Current descriptors and criteria for cardiorespiratory exercise intensity.
Suggested values assume VO₂max = 10 METs or 35 mL O₂·kg⁻¹·min⁻¹. Sources: ESSA position statement (2010); ACSM Guidelines for Exercise Testing and Prescription (2020); Howley (2001). Adapted from Bishop et al. (2025).
| Intensity descriptor | % VO₂max (ESSA 2010) | % VO₂max (ACSM 2020) | % HRR (ESSA 2010) | % HRR (ACSM 2020) | % HRmax (ESSA 2010) | % HRmax (ACSM 2020) | RPE₂₀ (ESSA 2010) | RPE₂₀ (ACSM 2020) | METs (ESSA 2010) | METs (ACSM 2020) |
|---|---|---|---|---|---|---|---|---|---|---|
| Sedentary | < 20 | — | < 20 | — | < 40 | — | < 8 | — | < 1.6 | — |
| Very light | < 37 | < 28 | < 30 | < 20 | < 57 | < 50 | < 9 | < 10 | < 2.0 | < 2.8 |
| Light | 20–40 | 37–45 | 20–40 | 28–45 | 40–55 | 57–63 | 8–10 | 9–11 | 1.6–3 | 2.8–4.5 |
| Moderate | 40–60 | 46–63 | 40–60 | 45–63 | 55–70 | 64–76 | 11–13 | 12–13 | 3–6 | 4.6–6.3 |
| Hard | — | 64–86 | — | — | 60–84 | 77–93 | — | 14–16 | 6.4–8.6 | — |
| Vigorous | 60–85 | 64–90 | 60–85 | ≥ 87 | 70–90 | 77–95 | 14–16 | 14–17 | 6–9 | 6–8.7 |
| Near-max to maximal | ≥ 91 | — | ≥ 90 | — | ≥ 86 | — | ≥ 18 | — | ≥ 8.8 | — |
| Maximal | 100 | 100 | 100 | 100 | 100 | 100 | 20 | 20 | — | — |
Current descriptors and criteria for cardiorespiratory exercise intensity.
Suggested values assume VO₂max = 10 METs or 35 mL O₂·kg⁻¹·min⁻¹. Sources: ESSA position statement (2010); ACSM Guidelines for Exercise Testing and Prescription (2020); Howley (2001). Adapted from Bishop et al. (2025).
Current descriptors and criteria for resistance exercise intensity.
Sources: ESSA position statement (2010); ACSM Guidelines for Exercise Testing and Prescription (2020); Howley (2001). Adapted from Bishop et al. (2025).
| Intensity descriptor | % 1-RM (ESSA 2010) | % 1-RM (ACSM 2020) | % 1-RM (Howley 2001) |
|---|---|---|---|
| Very light | < 30 | < 30 | < 30 |
| Light | 30–49 | 30–49 | 30–49 |
| Moderate | 50–69 | 50–69 | 50–69 |
| Hard | 70–84 | — | 70–84 |
| Very hard / Vigorous | ≥ 85 | ≥ 85 | ≥ 85 |
| Maximal | 100 | 100 | 100 |
Current descriptors and criteria for resistance exercise intensity.
Sources: ESSA position statement (2010); ACSM Guidelines for Exercise Testing and Prescription (2020); Howley (2001). Adapted from Bishop et al. (2025).
Proposed standardised classifications for exercise intensity.
MT1, the first metabolic threshold; MT2, the second metabolic threshold; W_max, the work rate associated with VO₂max attainment during a graded exercise test. Source: Bishop et al. (2025).
| Category | Cardiorespiratory Exercise (Physiological Reference) | Resistance Exercise (Reps in Reserve, RIR) | RPE₁₀ | RPE₂₀ |
|---|---|---|---|---|
| Inactive | Inactive | Inactive | 0 | 6 |
| Very Low | No current measure | > 8 | < 2 | ≤ 9 |
| Low | < MT1 | 7–8 | 2–3 | 10–11 |
| Moderate | > MT1 but < MT2 | 4–6 | 4–5 | 12–14 |
| High | > MT2 but < W_max | 2–3 | 6–7 | 15–16 |
| Very High | > W_max | < 2 | 8–10 | ≥ 17 |
Proposed standardised classifications for exercise intensity.
MT1, the first metabolic threshold; MT2, the second metabolic threshold; W_max, the work rate associated with VO₂max attainment during a graded exercise test. Source: Bishop et al. (2025).
Practical insight: The direct measurement of metabolic thresholds via GXT remains the gold standard for individualised exercise prescription in cardiorespiratory exercise, because percentage-based anchors (%VO₂max, %HRmax, %HRR, METs) do not reliably elicit the same metabolic stress across individuals. For resistance exercise, RIR provides a more ecologically valid measure of intensity than %1-RM alone. When laboratory assessment is unavailable, RPE serves as a practical adjunct for monitoring both exercise modalities.
4.5 Literature Summary: Predicted Maximal Heart Rate & Heart Rate Recovery
4.5.1 Predicted Maximal Heart Rate (HRmax) Formulas
Tanaka et al. (2001) — Age-Predicted Maximal Heart Rate Revisited
Tanaka, Monahan and Seals re-examined the long-standing “220 − age” formula for predicting HRmax. They combined a meta-analysis of 351 studies (492 groups, 18,712 subjects) with a cross-validation laboratory study on 514 healthy subjects. HRmax was strongly related to age (r = −0.90). The meta-analytic regression yielded HRmax = 208 − 0.7 × age, almost identical to the lab-based regression (209 − 0.7 × age). The relationship was independent of sex and of habitual physical activity. The authors concluded that the traditional 220 − age formula underestimates HRmax in older adults and that their equation should be preferred. This is the most widely cited modern HRmax equation.
Citation: Tanaka H, Monahan KD, Seals DR. Age-predicted maximal heart rate revisited. Journal of the American College of Cardiology. 2001;37(1):153–156.
Gellish et al. (2007) — Longitudinal Modeling of Age and HRmax
Gellish and colleagues performed a retrospective longitudinal analysis of maximal graded exercise tests (GXT) carried out at a university fitness centre between 1978 and 2003. They analysed 908 tests from 132 individuals of both sexes covering a broad age and fitness range, using a linear mixed-models approach. The analysis produced the univariate prediction equation HRmax = 207 − 0.7 × age (p < 0.001). The authors emphasise that this result diverges meaningfully from the conventional 220 − age formula and supports more recent cross-sectional equations (e.g. Tanaka 2001). Because it is based on repeated observations of the same individuals as they aged, the study provides particularly strong evidence for a slope of roughly 0.7 bpm per year.
Citation: Gellish RL, Goslin BR, Olson RE, McDonald A, Russi GD, Moudgil VK. Longitudinal modeling of the relationship between age and maximal heart rate. Medicine & Science in Sports & Exercise. 2007;39(5):822–829.
Nes et al. (2013) — The HUNT Fitness Study
Nes and coworkers derived and validated an age-based HRmax equation in a large healthy sample of 3,320 men and women (part of the Norwegian HUNT Fitness Study, 2007–2008) who had all reached a verified maximal effort on a treadmill test. Using general linear modelling they obtained HRmax = 211 − 0.64 × age with a standard error of 10.8 bpm. No meaningful interaction was found with sex, BMI, VO2max, or physical-activity level — indicating that age alone is a robust primary predictor. Importantly, previously published formulas (including 220 − age and Tanaka’s 208 − 0.7 × age) underestimated measured HRmax in subjects older than 30 years. The paper therefore proposes the HUNT formula as a more accurate choice, especially for healthy older adults and women.
Citation: Nes BM, Janszky I, Wisløff U, Støylen A, Karlsen T. Age-predicted maximal heart rate in healthy subjects: The HUNT Fitness Study. Scandinavian Journal of Medicine & Science in Sports. 2013;23(6):697–704.
4.5.2 Heart Rate Recovery (HRR)
Cole et al. (1999) — HRR as Predictor of Mortality
This landmark study established HRR as an independent prognostic marker. Cole and colleagues followed 2,428 adults without heart failure, revascularisation or pacemakers who were undergoing symptom-limited exercise testing with thallium scintigraphy. HRR was defined as the fall in heart rate from peak exercise to one minute after cessation; a value ≤ 12 bpm (measured during an active cool-down) was classified as abnormal. After six years, a low HRR was a strong univariate predictor of all-cause death (RR 4.0; 95% CI 3.0–5.2). After adjustment for age, sex, medication, perfusion defects, risk factors, resting HR, HR reserve and workload, HRR remained an independent predictor (adjusted RR 2.0; 95% CI 1.5–2.7). The authors interpreted delayed HR decline as a marker of reduced vagal (parasympathetic) reactivation.
Citation: Cole CR, Blackstone EH, Pashkow FJ, Snader CE, Lauer MS. Heart-rate recovery immediately after exercise as a predictor of mortality. New England Journal of Medicine. 1999;341(18):1351–1357.
Watanabe et al. (2001) — HRR after Treadmill Exercise without Cool-down
Watanabe et al. extended Cole’s finding to the setting of stress echocardiography, where patients assume a supine (left-lateral decubitus) position immediately after exercise — i.e. without a cool-down. Among 5,438 consecutive patients followed for 3 years, HRR was defined as peak HR minus HR one minute later, with ≤ 18 bpm considered abnormal (a threshold higher than Cole’s because supine rest accelerates HR decline). Abnormal HRR was present in 15% of patients and strongly predicted mortality (9% vs 2%; HR 3.9). After adjustment for age, sex, exercise capacity, left-ventricular systolic function and ischaemia, HRR remained an independent predictor of death (adjusted HR 2.09; 95% CI 1.49–2.82). The study demonstrated that HRR is predictive regardless of recovery protocol and independent of LV function.
Citation: Watanabe J, Thamilarasan M, Blackstone EH, Thomas JD, Lauer MS. Heart rate recovery immediately after treadmill exercise and left ventricular systolic dysfunction as predictors of mortality: the case of stress echocardiography. Circulation. 2001;104(16):1911–1916.
Qiu et al. (2017) — Meta-Analysis (the “Eve” file)
Qiu and colleagues carried out a systematic review and meta-analysis of nine prospective cohort studies examining HRR and risk of cardiovascular events and all-cause mortality in the general population (34,267 participants for CV events; 41,600 for mortality). Using random-effects models, attenuated HRR (versus fast HRR) was associated with a pooled hazard ratio of 1.69 (95% CI 1.05–2.71) for cardiovascular events and 1.68 (95% CI 1.51–1.88) for all-cause mortality. Each 10-bpm decrement in HRR corresponded to HR 1.13 and 1.09 respectively. The associations remained significant after adjustment for traditional metabolic risk factors. The authors therefore recommend routine recording of HRR for clinical risk assessment.
Citation: Qiu S, Cai X, Sun Z, Li L, Zuegel M, Steinacker JM, Schumann U. Heart rate recovery and risk of cardiovascular events and all-cause mortality: a meta-analysis of prospective cohort studies. Journal of the American Heart Association. 2017;6(5):e005505.
Boettger et al. — HRR in Major Depressive Disorder
Boettger and colleagues investigated whether physical fitness and HRR are reduced in major depressive disorder (MDD). Twenty-two patients with MDD and 22 activity-matched healthy controls performed a stepwise exhaustion cycling protocol with spirometry and lactate diagnostics. HRR was measured in the first minute after cessation of exercise. VO2peak, maximum workload (Ppeak) and individual anaerobic threshold (IAT) were all significantly decreased in patients, and HRR was also significantly reduced — pointing to autonomic dysfunction and an elevated cardiovascular risk profile in MDD. A single bout of exhaustive exercise improved mood in patients (but not controls), and the improvement correlated with maximum lactate levels.
Citation: Boettger S, Wetzig F, Puta C, Donath L, Müller H-J, Gabriel HHW, Bär K-J. Physical fitness and heart rate recovery are decreased in major depressive disorder. Psychosomatic Medicine. 2009;71(5):519–523.
Buchheit — 30-15 Intermittent Fitness Test
Buchheit evaluated the 30-15 Intermittent Fitness Test (30-15IFT) as a tool for individualising interval training in young intermittent-sport players (n = 59, age 16.2 ± 2.3 y). The maximal running speed reached at the end of the 30-15IFT (MRS30-15IFT) correlated significantly with VO2max, lower-limb explosive power, repeated-sprint ability and cardiorespiratory recovery kinetics during exercise. When interval-training intensities were prescribed from MRS30-15IFT, the heart-rate response across players was far more homogeneous than when intensities were set from continuous field tests (Université de Montréal Track Test or 20-m shuttle run). In the context of HRR, the study illustrates how post-effort HR kinetics differ between athletes and how a test that implicitly integrates recovery capacity can better standardise training load.
Citation: Buchheit M. The 30-15 Intermittent Fitness Test: accuracy for individualizing interval training of young intermittent sport players. Journal of Strength and Conditioning Research. 2008;22(2):365–374.
4.5.3 Summary Tables
Predicted HRmax formulas.
| Paper | Year | Population (n) | Design | Prediction Equation | SEE / notes |
|---|---|---|---|---|---|
| Fox / “220 − age” (historical reference) | 1971 | Small heterogeneous sample | Heuristic linear fit | HRmax = 220 − age | SD ≈ 10–12 bpm; underestimates HRmax in older adults |
| Tanaka et al. | 2001 | 18,712 (meta) + 514 (lab) | Meta-analysis + cross-validation | HRmax = 208 − 0.7 × age | Independent of sex and activity level |
| Gellish et al. | 2007 | 132 subjects, 908 tests | Longitudinal, linear mixed models | HRmax = 207 − 0.7 × age | Repeated GXT over 25 years |
| Nes et al. (HUNT) | 2013 | 3,320 healthy adults | Large cross-sectional field study | HRmax = 211 − 0.64 × age | SEE 10.8 bpm; no effect of sex, BMI, VO2max, PA |
Predicted HRmax formulas.
Heart-rate recovery studies.
| Paper | Year | Population (n) | Setting / Protocol | HRR Definition & Cut-off | Key Finding |
|---|---|---|---|---|---|
| Cole et al. | 1999 | 2,428 adults, 6-y follow-up | Symptom-limited ex. + thallium; active cool-down | Peak HR − HR at 1 min; abnormal ≤ 12 bpm | Adjusted RR 2.0 for all-cause mortality |
| Watanabe et al. | 2001 | 5,438 patients, 3-y follow-up | Stress echo; supine recovery (no cool-down) | Peak HR − HR at 1 min; abnormal ≤ 18 bpm | Adjusted HR 2.09 for death, independent of LV function |
| Qiu et al. (meta-analysis) | 2017 | 9 cohorts, 34,267 / 41,600 | Prospective cohorts, general population | Various time points (1- and 2-min) | Pooled HR 1.69 (CV events), 1.68 (all-cause mortality); HR 1.13 / 1.09 per 10-bpm decrement |
| Boettger et al. | 2009 | 22 MDD + 22 controls | Cycle ergometer, stepwise exhaustion | Peak HR − HR at 1 min | HRR, VO2peak, Ppeak, IAT significantly reduced in MDD → autonomic dysfunction |
| Buchheit (30-15IFT) | 2008 | 59 intermittent-sport players | Field test (30-15IFT) vs. UMTT / 20-m shuttle | Cardiorespiratory recovery kinetics during intermittent runs | MRS30-15IFT standardises HR response during interval training better than continuous tests |
Heart-rate recovery studies.
Typical HRR thresholds by protocol.
| Recovery Protocol | Commonly Used Abnormal Cut-off (1 min) | Source |
|---|---|---|
| Active cool-down (slow walking/cycling) | ≤ 12 bpm | Cole et al. 1999 |
| Supine / no cool-down (stress echo) | ≤ 18 bpm | Watanabe et al. 2001 |
| Per-10-bpm gradient (population risk) | each 10-bpm ↓ → ~13% ↑ CV risk, ~9% ↑ mortality | Qiu et al. 2017 |
Typical HRR thresholds by protocol.
One-Minute-Paper Topics
A One-Minute-Paper (OMP) is a short, focused prompt that students answer in ~60 seconds at the end of a session to consolidate learning, surface misconceptions, and provide formative feedback. When answering, be concise, specific, and use terminology from today’s session.
- Why do percentage-based anchors (%V̇O₂max, %HRmax, %HRR, METs) fail to elicit the same metabolic stress across individuals, and why are direct metabolic thresholds (MT1, MT2) preferred?
- Define heart-rate recovery (HRR) and explain why a low 1-minute HRR predicts mortality. What autonomic mechanism does delayed HR decline reflect?
Key References
- Bishop DJ, Beck B, Biddle SJH, Denay KL, Ferri A, Jones AM, Jung M, Lee MJ-C, Moholdt T, Newton RU, Nimphius S, Pescatello LS, Saner NJ, Tzarimas C. Physical activity and exercise intensity terminology: a joint American College of Sports Medicine (ACSM) Expert Statement and Exercise and Sport Science Australia (ESSA) Consensus Statement. Med Sci Sports Exerc. 2025;57(11):2599–2613. doi:10.1016/j.jsams.2024.11.004.
References
- Bauer M, Ermolaeva M, Singer M, Wetzker R, Soares MP. Hormesis as an adaptive response to infection. Trends in Molecular Medicine. 2024;30(7):633–642. doi:10.1016/j.molmed.2024.04.012.
- Bishop DJ, Beck B, Biddle SJH, Denay KL, Ferri A, Jones AM, Jung M, Lee MJ-C, Moholdt T, Newton RU, Nimphius S, Pescatello LS, Saner NJ, Tzarimas C. Physical activity and exercise intensity terminology: a joint American College of Sports Medicine (ACSM) Expert Statement and Exercise and Sport Science Australia (ESSA) Consensus Statement. Med Sci Sports Exerc. 2025;57(11):2599–2613. doi:10.1016/j.jsams.2024.11.004.
- Boettger S, Wetzig F, Puta C, Donath L, Müller H-J, Gabriel HHW, Bär K-J. Physical fitness and heart rate recovery are decreased in major depressive disorder. Psychosomatic Medicine. 2009;71(5):519–523.
- Buchheit M. The 30-15 Intermittent Fitness Test: accuracy for individualizing interval training of young intermittent sport players. Journal of Strength and Conditioning Research. 2008;22(2):365–374.
- Calabrese EJ, Baldwin LA. Defining hormesis. Human & Experimental Toxicology. 2002;21(2):91–97.
- Calabrese EJ, Mattson MP. How does hormesis impact biology, toxicology, and medicine? npj Aging and Mechanisms of Disease. 2017;3:13. doi:10.1038/s41514-017-0013-z.
- Cannon WB. The Wisdom of the Body. W. W. Norton & Company; 1932.
- Carruthers BM, van de Sande MI, De Meirleir KL, et al. Myalgic encephalomyelitis: International consensus criteria. Journal of Internal Medicine. 2011;270(4):327–338.
- Caspersen CJ, Powell KE, Christenson GM. Physical activity, exercise, and physical fitness: definitions and distinctions for health-related research. Public Health Reports. 1985;100(2):126–131. ISSN 0033-3549.
- Cole CR, Blackstone EH, Pashkow FJ, Snader CE, Lauer MS. Heart-rate recovery immediately after exercise as a predictor of mortality. New England Journal of Medicine. 1999;341(18):1351–1357.
- Cunningham JJ. A reanalysis of the factors influencing basal metabolic rate in normal adults. The American Journal of Clinical Nutrition. 1980;33(11):2372–2374. doi:10.1093/ajcn/33.11.2372.
- Fox SM, Naughton JP, Haskell WL. Physical activity and the prevention of coronary heart disease. Annals of Clinical Research. 1971;3(6):404–432.
- Gellish RL, Goslin BR, Olson RE, McDonald A, Russi GD, Moudgil VK. Longitudinal modeling of the relationship between age and maximal heart rate. Medicine & Science in Sports & Exercise. 2007;39(5):822–829.
- Gleeson M, Bishop NC, Stensel DJ, Lindley MR, Mastana SS, Nimmo MA. The anti-inflammatory effects of exercise: mechanisms and implications for the prevention and treatment of disease. Nature Reviews Immunology. 2011;11(9):607–615.
- Harris JA, Benedict FG. A biometric study of human basal metabolism. Proceedings of the National Academy of Sciences. 1918;4(12):370–373. doi:10.1073/pnas.4.12.370.
- Komaroff AL, Lipkin WI. Insights from myalgic encephalomyelitis/chronic fatigue syndrome may help unravel the pathogenesis of post-acute COVID-19 syndrome. Trends in Molecular Medicine. 2021;27(9):895–906.
- Nes BM, Janszky I, Wisløff U, Støylen A, Karlsen T. Age-predicted maximal heart rate in healthy subjects: The HUNT Fitness Study. Scandinavian Journal of Medicine & Science in Sports. 2013;23(6):697–704.
- Nieman DC. Exercise, infection, and immunity. International Journal of Sports Medicine. 1994;15(S3):S131–S141.
- Nieman DC, Wentz LM. The compelling link between physical activity and the body’s defense system. Journal of Sport and Health Science. 2019;8(3):201–217.
- Paulsen G, Cumming KT, Holden G, et al. Vitamin C and E supplementation hampers cellular adaptation to endurance training in humans. Journal of Physiology. 2014;592(8):1887–1901.
- Pedersen BK, Febbraio MA. Muscle as an endocrine organ: focus on muscle-derived interleukin-6. Physiological Reviews. 2008;88(4):1379–1406.
- Pontzer H, Yamada Y, Sagayama H, et al. Daily energy expenditure through the human life course. Science. 2021;373(6556):808–812. doi:10.1126/science.abe5017.
- Puta C, Gabriel H. Homeostasis and hormesis as complementary frameworks for exercise-induced inflammation: a conceptual simulation analysis. Friedrich-Schiller-Universität Jena, Institute for Sports Science; 2025.
- Qiu S, Cai X, Sun Z, Li L, Zuegel M, Steinacker JM, Schumann U. Heart rate recovery and risk of cardiovascular events and all-cause mortality: a meta-analysis of prospective cohort studies. Journal of the American Heart Association. 2017;6(5):e005505.
- Rhoads TW, Anderson RM. Taking the long view on metabolism. Science. 2021 Aug 13;373(6556):738–739. doi:10.1126/science.abl4537. PMID: 34385381.
- Ristow M, Zarse K, Oberbach A, et al. Antioxidants prevent health-promoting effects of physical exercise in humans. Proceedings of the National Academy of Sciences. 2009;106(21):8665–8670.
- Roza AM, Shizgal HM. The Harris Benedict equation reevaluated: resting energy requirements and the body cell mass. The American Journal of Clinical Nutrition. 1984;40(1):168–182. doi:10.1093/ajcn/40.1.168.
- Selye H. The general adaptation syndrome and the diseases of adaptation. Journal of Clinical Endocrinology and Metabolism. 1946;6(2):117–230.
- Tanaka H, Monahan KD, Seals DR. Age-predicted maximal heart rate revisited. Journal of the American College of Cardiology. 2001;37(1):153–156.
- Ten Haaf T, Weijs PJM. Resting energy expenditure prediction in recreational athletes of 18–35 years: confirmation of Cunningham equation and an improved weight-based alternative. PLOS ONE. 2014;9(9):e108460. doi:10.1371/journal.pone.0108460.
- Watanabe J, Thamilarasan M, Blackstone EH, Thomas JD, Lauer MS. Heart rate recovery immediately after treadmill exercise and left ventricular systolic dysfunction as predictors of mortality: the case of stress echocardiography. Circulation. 2001;104(16):1911–1916.