The Acute Immune Response to Exercise
Table of Contents
- Kinetics of the Acute Exercise Leukocytosis
- The Machinery: Hormones, β2-Receptors and Diapedesis
- Counts vs Function — Exercise is not Infection
- From Single Bout to Overtraining: the Acute Phase Response
1 Kinetics of the Acute Exercise Leukocytosis
Learning objectives:
- Exercise intensity on the IAT scale and the two stimulus classes
- The biphasic leukocytosis and why the phases fuse beyond ≈ 2 h
- The marginal pool as the source, and the subpopulation ranking by amplitude
1.1 Re-circulation of immune cells during and after exercise at different intensities and durations
The fundamental anchor for grading exercise intensity in exercise immunology is the individual anaerobic threshold (IAT) as defined by Stegmann et al. 1981 (Gabriel & Kindermann 1997). On this scale Gabriel & Kindermann (1997) separate two stimulus classes:
- Moderate exercise — duration < 2 h at ≈ 85 % IAT (lactate steady state ≈ 2 mmol·L⁻¹), or < 30 min at 100 % IAT (lactate steady state ≈ 4 mmol·L⁻¹).
- Strenuous exercise — exhaustive at 100 % IAT or above, or (exhaustive) long-term endurance > 2–3 h.
The classical exercise leukocytosis is biphasic for bouts < ≈ 2 h (Fig. 1 of Gabriel & Kindermann 1997):
- First, immediate leukocytosis during exercise. Lymphocytes (incl. NK cells) and monocytes reach near-maximal values within the first 30 min of exercise; neutrophils rise during exercise too but more slowly.
- Second, delayed leukocytosis after exercise. After cessation, lymphocytes and mature monocytes drop below pre-exercise values within ≈ 30 min – 2 h, while neutrophils rise a second time and stay elevated for hours.
For exercise longer than ≈ 2 h the two phases fuse and only neutrophilia is seen at the end (Gabriel & Kindermann 1997). In short anaerobic bouts the same fluctuations occur but on a much faster time scale: Gabriel et al. (2003) sampled at 0, 2, 4, 8, 16, 32, 48 min after a 60-s all-out test (489 ± 34 W; lactate_max 14.1 ± 2.8 mmol·L⁻¹) and resolved the immediate leukocytosis itself into two consecutive waves:
- Early wave (peak 1–2 min post-exercise): NK cells +521 %, CD3⁺CD4⁻ cytotoxic/suppressor T cells +95 %, CD14⁺CD16⁻ regular monocytes +33 %.
- Late wave (peak 8–16 min post-exercise): neutrophils +26 %, CD14⁺CD16⁺ premacrophages +372 %, CD3⁺CD4⁺ helper/inducer T cells +43 %, CD19⁺ B cells +70 %.
All subpopulations return to baseline within ≈ 30 min, which identifies the source as the marginal pool (cells transiently held against the endothelium) rather than newly produced cells.
Take-home pattern (Gabriel & Kindermann 1997, §“In summary”):
- Neutrocytosis is more dependent on duration than on intensity. Sessions that drive a strong rise of ACTH, β-endorphin and cortisol drive the largest neutrocytosis.
- Regular monocytes (CD14⁺CD16⁻): strongly recruited by long-term aerobic exercise.
- Mature monocytes (CD14⁺CD16⁺, premacrophages): highest increases with anaerobic and short-term high-intensity exercise above the IAT.
- NK cells: up to +500 % at the end of intensive exercise, then fall to below pre-exercise within ~30 min and remain depressed for several hours.
- B cells and CD4⁺ T cells: comparatively small fluctuations.
1.2 Different response kinetics of leukocytes, NK cells, lymphocytes, monocytes and subpopulations
This section synthesises Figs. 3–8 of Gabriel & Kindermann (1997), Figs. 2–4 of Gabriel et al. (2003) and Figs. 3–4 of Meyer et al. (2001).
Neutrophils. Biphasic. During exercise: moderate rise driven by demargination and cardiac output. Post-exercise: a second, larger and delayed rise peaking 1–2 h after cessation, driven by cortisol-mediated release from the bone marrow. Magnitude scales with duration more than with intensity; longer aerobic exercise (≥ 2 h) → highest absolute counts. In anaerobic interval training (AN-TS, Meyer et al. 2001) the 2-h post-neutrocytosis is significantly larger than after a single 60-s bout.
Total lymphocytes (including NK cells). Rapid rise during exercise (lymphocytosis), but drop below baseline within minutes after cessation. Lymphopenia persists for several hours (Simon et al. 2026 measured a fall from 2.1 → 3.6 × 10⁹·L⁻¹ at peak → 1.7 × 10⁹·L⁻¹ at 30 min and 1.8 × 10⁹·L⁻¹ at 60 min after the sit-to-stand test). Drivers: catecholamines during exercise, cortisol + lymphocyte apoptosis afterwards.
NK cells (CD3⁻CD16⁺/CD56⁺). Quantitatively the most exercise-responsive subset. Up to +500 % at the end of short, high-intensity exercise (Gabriel & Kindermann 1997); +521 % at 1–2 min post in Gabriel et al. (2003). NK cells then fall most steeply during recovery and stay below baseline for several hours. Hypothesised mechanism: high baseline LFA-1 expression → strong β2-adrenergic-mediated detachment during exercise and rapid re-adhesion afterwards.
Cytotoxic, non-MHC-restricted T cells (CD3⁺CD16/CD56⁺). Behave like NK cells but with smaller amplitudes.
B cells (CD19⁺). Small fluctuations during exercise (~+20 %), late peak in anaerobic conditions (+70 % at 8 min post, Gabriel et al. 2003). Low LFA-1 expression → smaller demargination effect.
T-helper/inducer (CD4⁺) and T-cytotoxic/suppressor (CD8⁺) cells. CD8⁺ rises more strongly than CD4⁺ during exercise; CD8⁺ also drops further below pre-exercise concentrations afterwards. Helper cells follow the “late” mobilisation wave in anaerobic exercise (+43 % at 8 min post, Gabriel et al. 2003).
Naïve (CD45RA⁺) vs memory (CD45RO⁺) T cells. Long-duration endurance exercise increases CD45RO⁺ (“memory phenotype”) cells modestly; the rise is small compared with infectious mononucleosis, in which CD8⁺CD45RO⁺ and CD8⁺HLA-DR⁺ T cells rise sharply (Fig. 13 of Gabriel & Kindermann 1997). This is one of the strongest illustrations that exercise mostly changes counts, infection changes functional activation states.
Monocyte subpopulations (CD14/CD16).
- CD14⁺CD16⁻ regular monocytes = early differentiation stage; dominant in long-duration aerobic exercise (post-exercise increases for hours-to-days after marathon or ultratriathlon).
- CD14⁺CD16⁺ mature monocytes / premacrophages = late differentiation stage. In healthy resting subjects 10–15 % of circulating monocytes. After a 60-s all-out test premacrophages rose ~3.7× (+372 %) at 8 min post-exercise and made up ~50 % of circulating monocytes (Gabriel et al. 2003) — indicating that premacrophages reside preferentially in the marginal pool and are mobilised in the late wave. In anaerobic interval training, CD16⁺ monocytes peak earlier after the single 60-s bout (15 min) and later after the repeated AN-TS (2 h), consistent with bone-marrow contribution + monocyte activation by the prolonged lactic acidosis (Meyer et al. 2001).
- Eosinophils show the largest increases with short anaerobic and short high-intensity aerobic exercise; long aerobic exercise leads to decreases.
1.3 Figures
Absolute blood concentrations of four leukocyte populations before, during and after a single endurance bout. (A) neutrophils, (B) total lymphocytes including NK cells, (C) CD14⁺⁺CD16⁻ regular monocytes, (D) CD14⁺CD16⁺⁺ mature monocytes (premacrophages). Eight regional-class triathletes (26 ± 2 yr; V̇O₂max 60 ± 3 mL·min⁻¹·kg⁻¹) cycled for 70 ± 12 min at 100 % of the individual anaerobic threshold. Sampling: at rest, after 30 min of exercise, during the last 2 min of exercise (End), then 30 min, 2 h, 6 h and 24 h post-exercise; the shaded band marks the exercise period and the axis break precedes the 24-h sample. Medians and quartiles; (+)/+/++/+++ p < 0.1 / 0.05 / 0.01 / 0.001 vs. before exercise. Note the opposite post-exercise trajectories of neutrophils (delayed second rise peaking at 2 h) and lymphocytes (fall below baseline within 30 min), and the divergence of the two monocyte subsets. Redrawn after Gabriel & Kindermann 1997, Fig. 1.
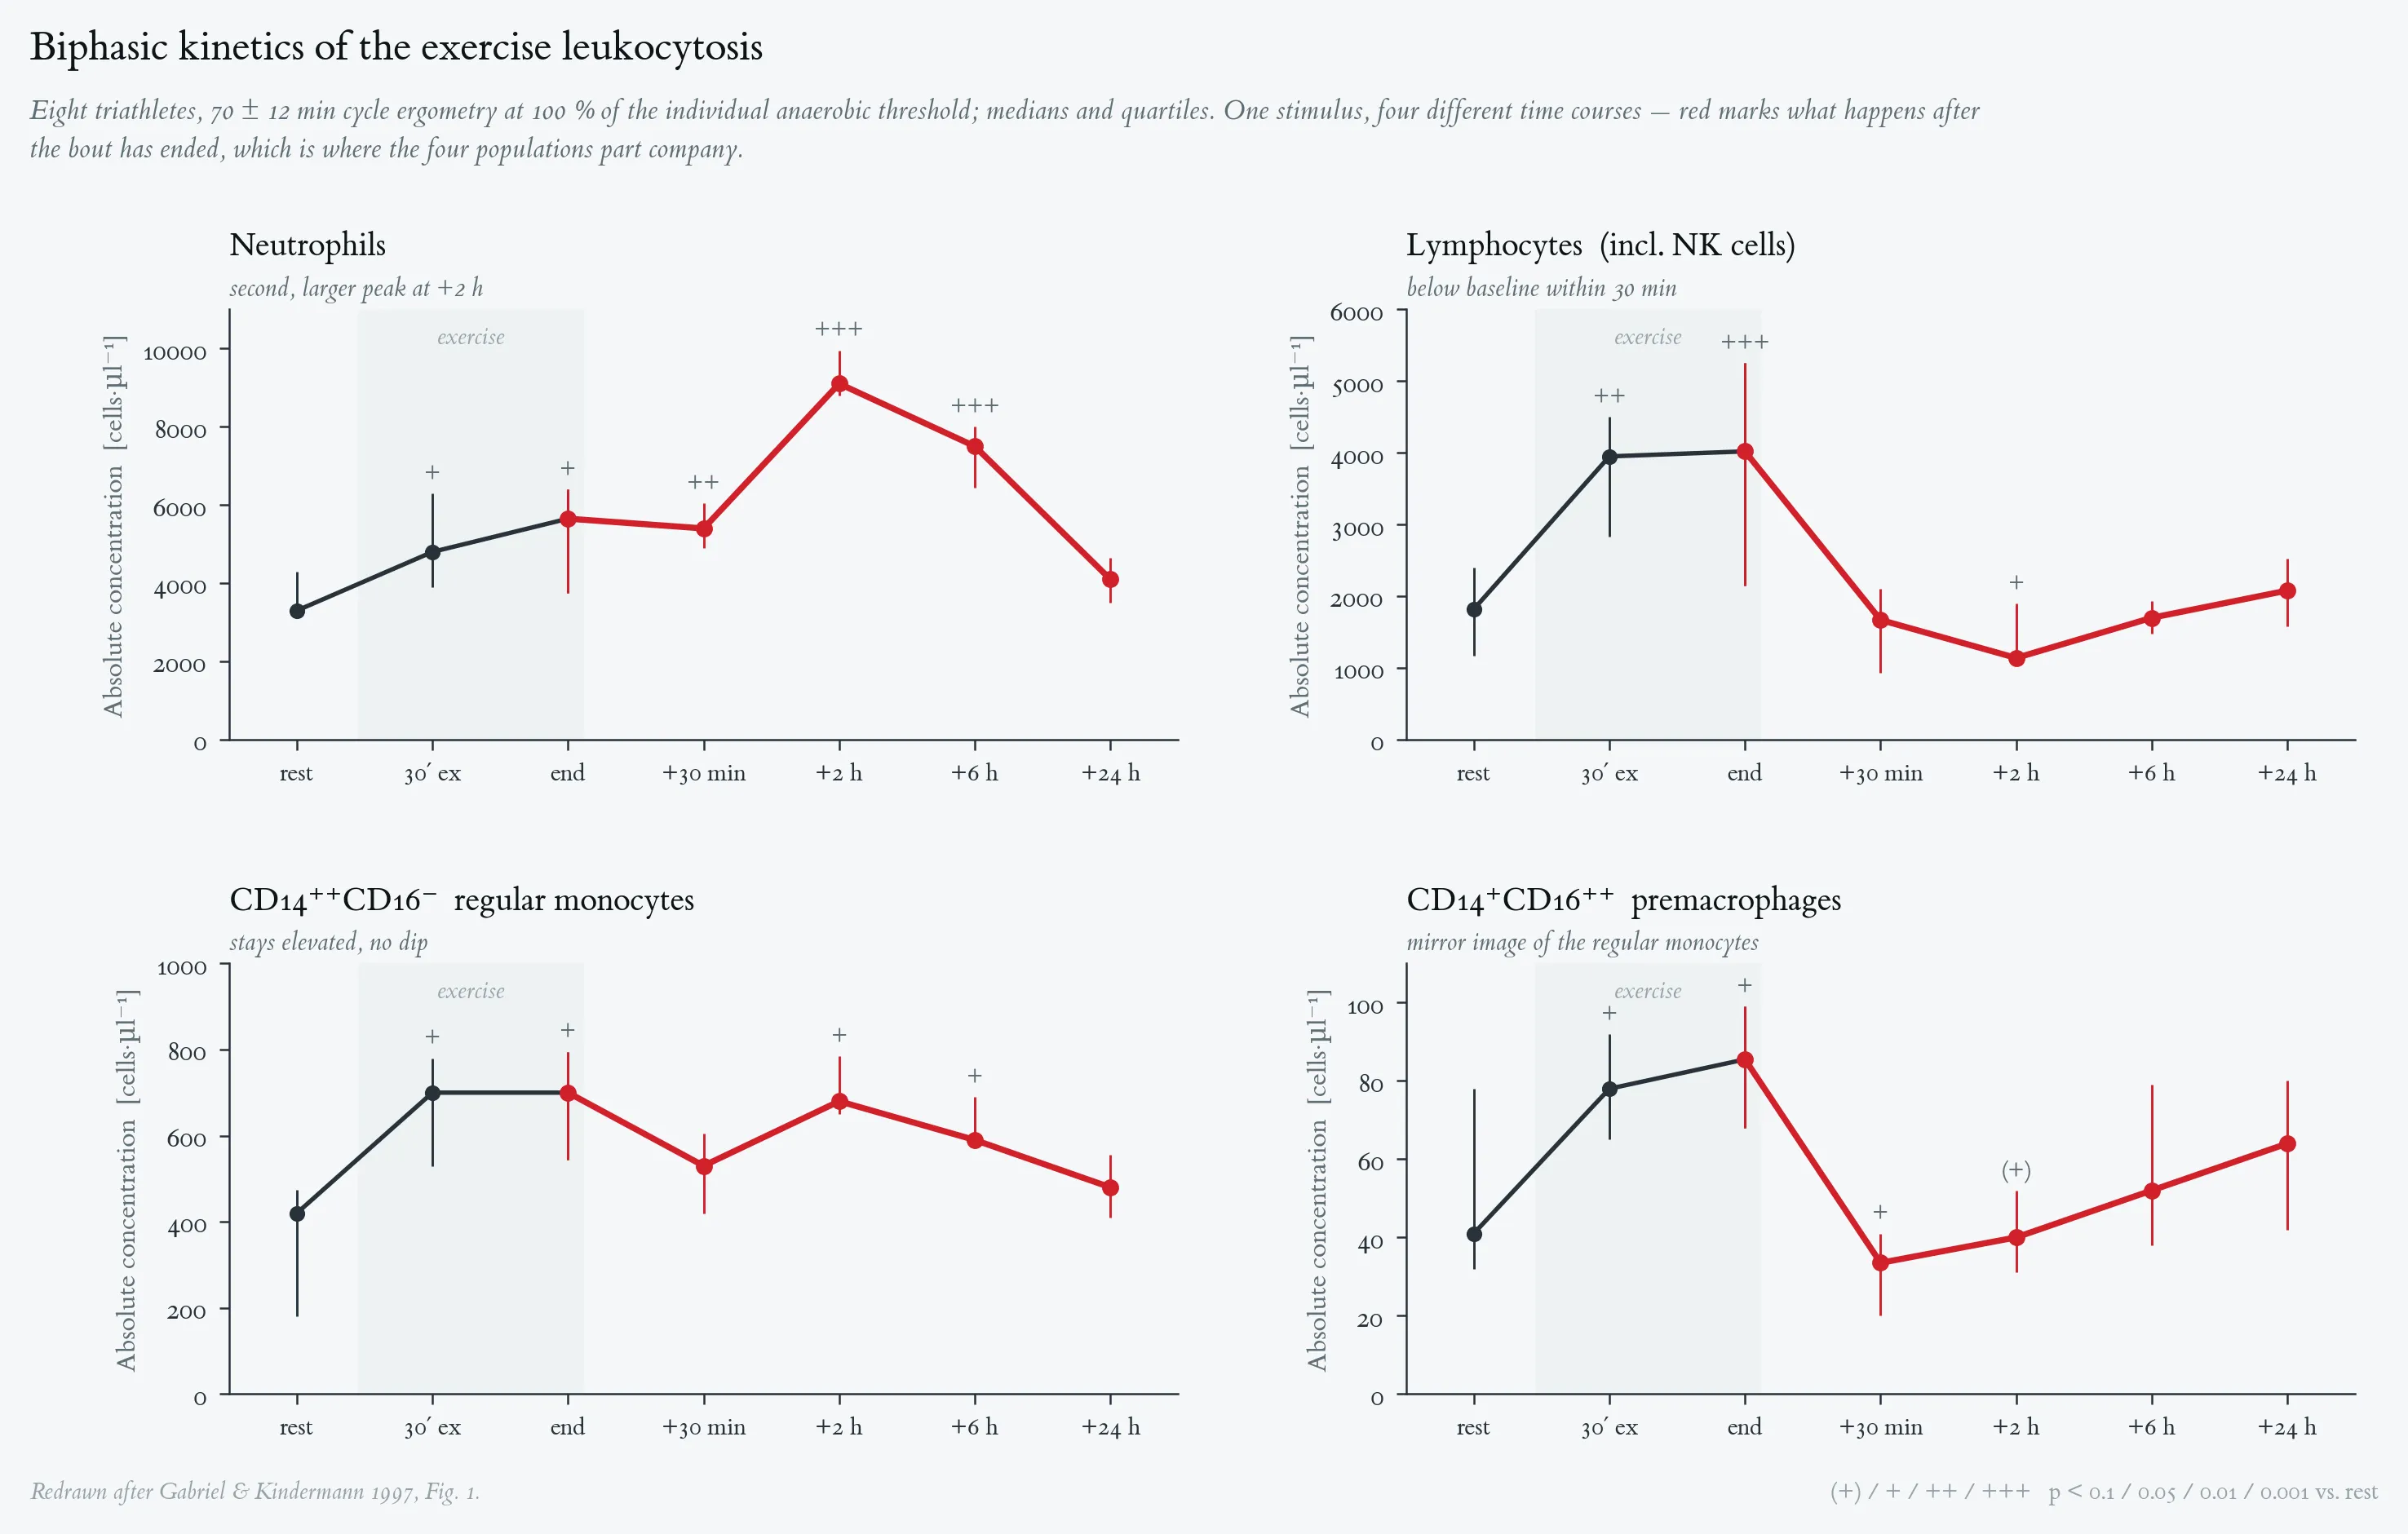
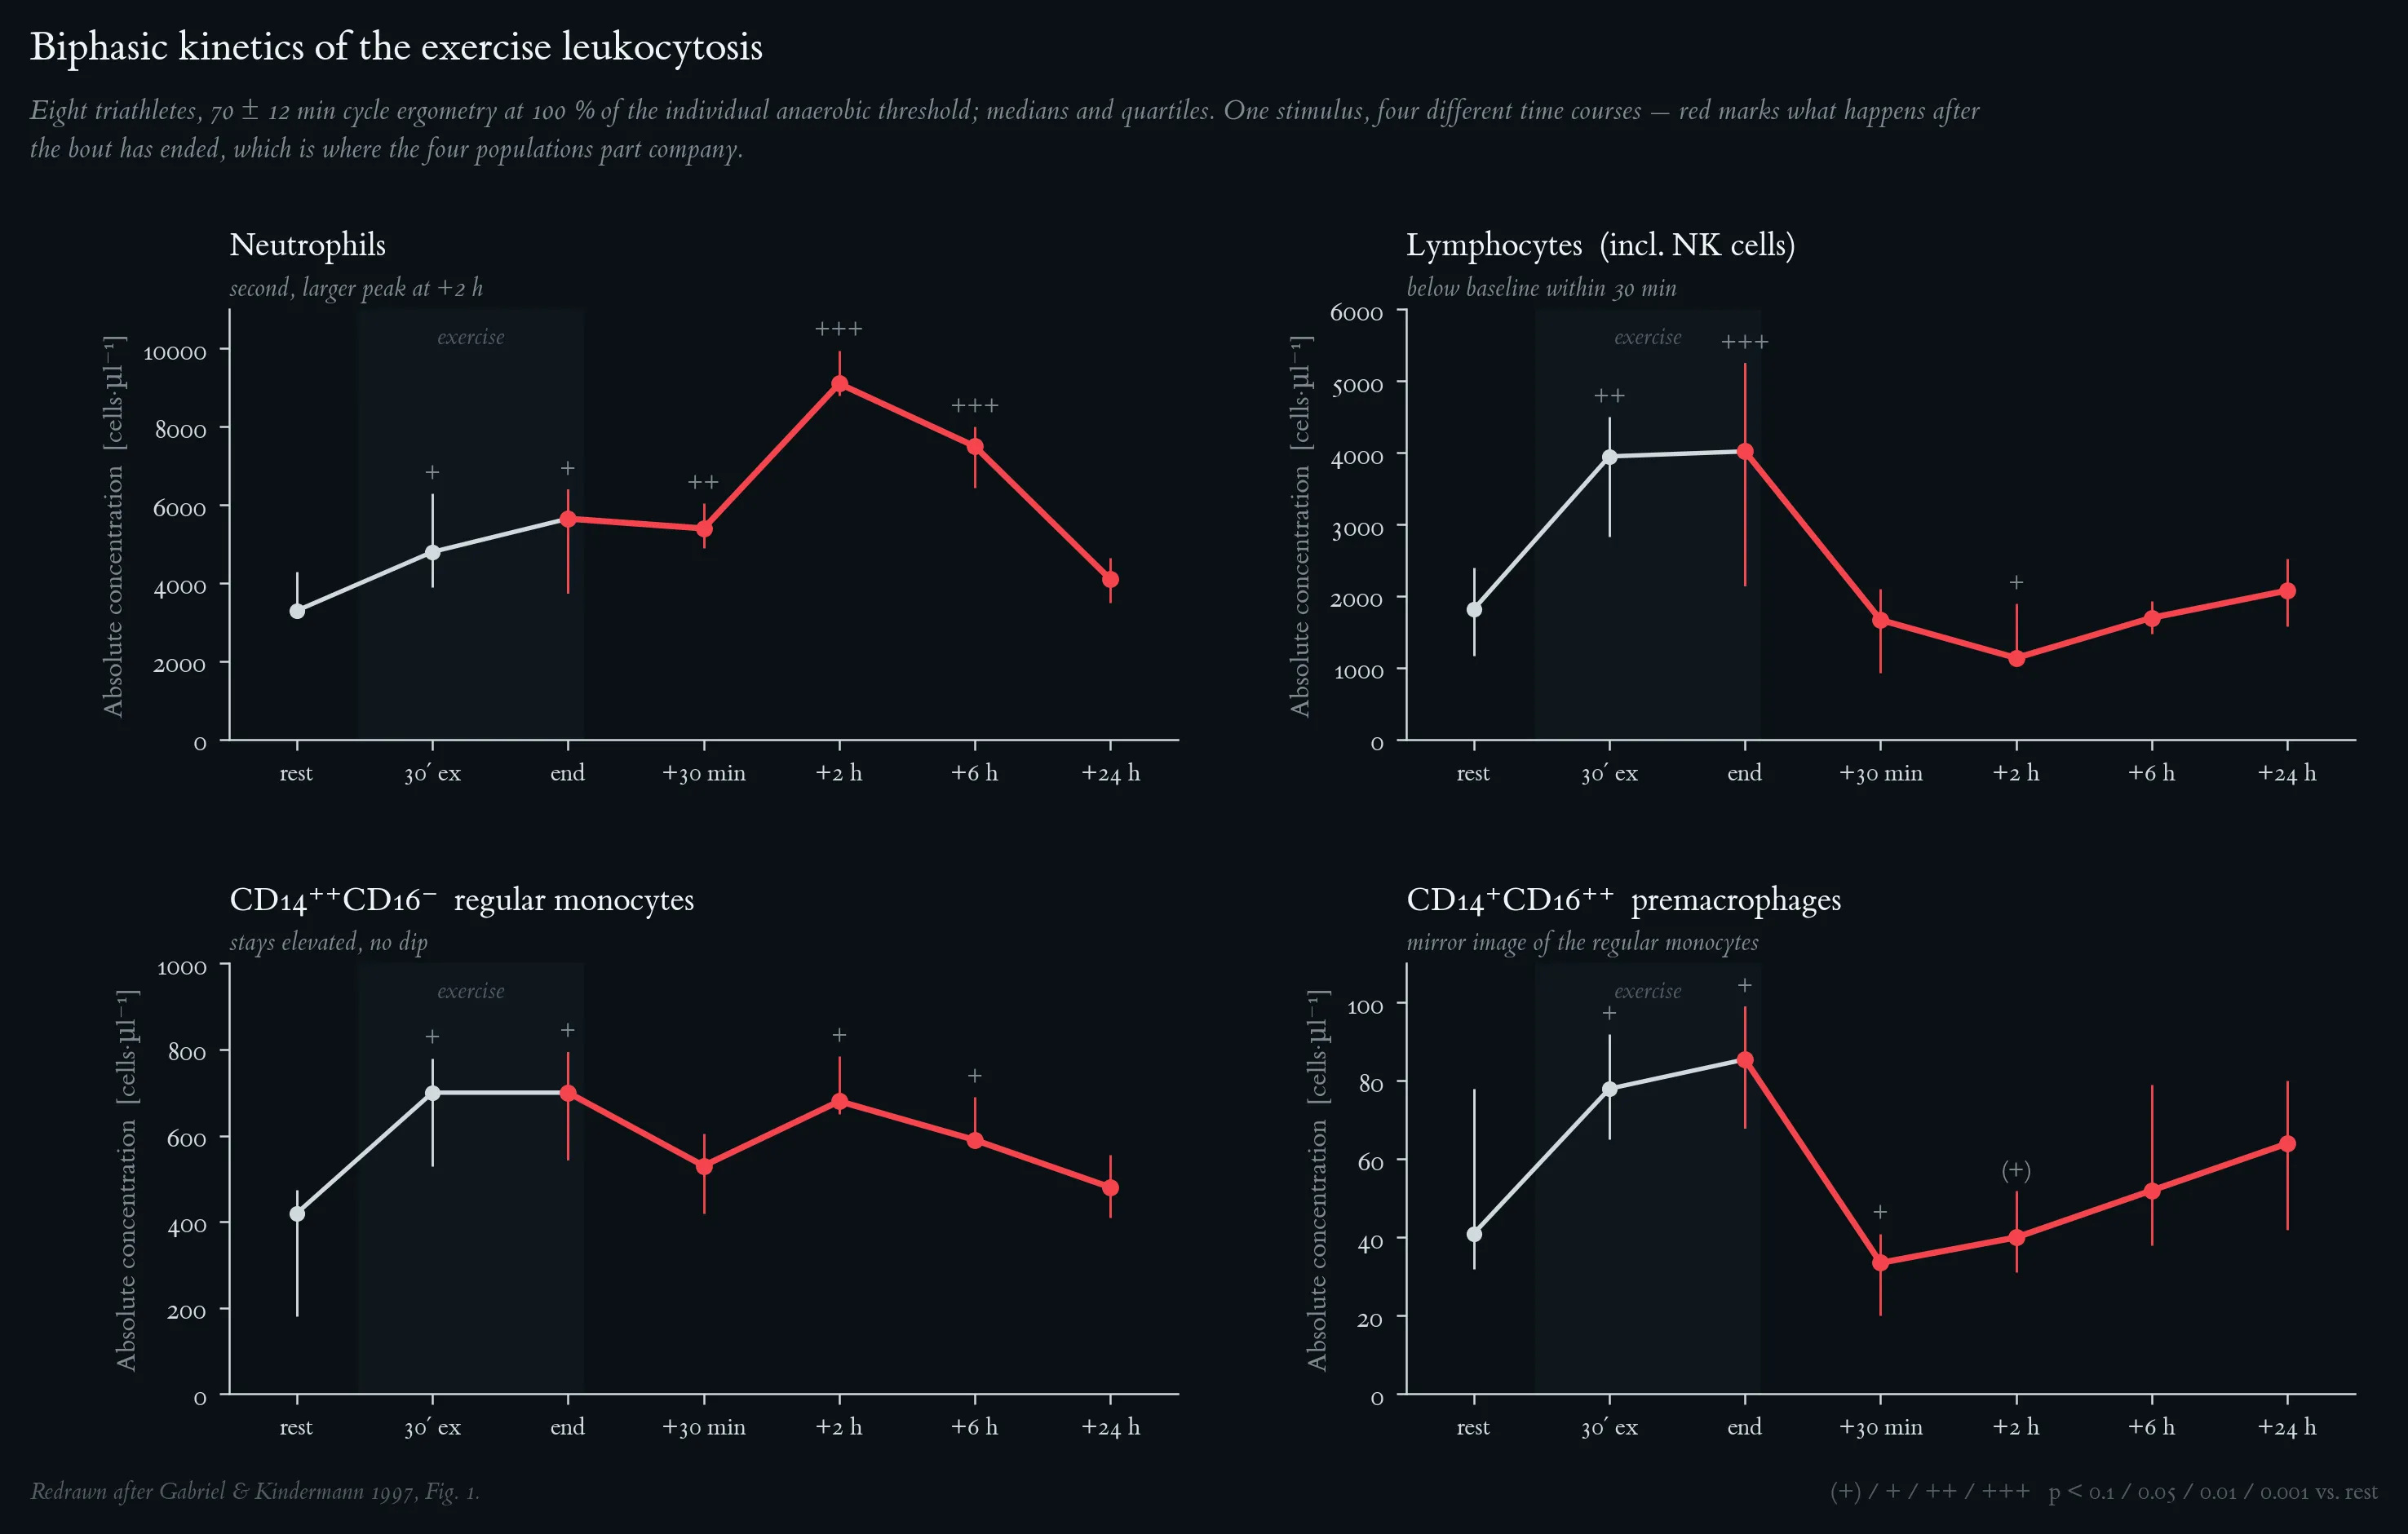
Absolute blood concentrations of four leukocyte populations before, during and after a single endurance bout. (A) neutrophils, (B) total lymphocytes including NK cells, (C) CD14⁺⁺CD16⁻ regular monocytes, (D) CD14⁺CD16⁺⁺ mature monocytes (premacrophages). Eight regional-class triathletes (26 ± 2 yr; V̇O₂max 60 ± 3 mL·min⁻¹·kg⁻¹) cycled for 70 ± 12 min at 100 % of the individual anaerobic threshold. Sampling: at rest, after 30 min of exercise, during the last 2 min of exercise (End), then 30 min, 2 h, 6 h and 24 h post-exercise; the shaded band marks the exercise period and the axis break precedes the 24-h sample. Medians and quartiles; (+)/+/++/+++ p < 0.1 / 0.05 / 0.01 / 0.001 vs. before exercise. Note the opposite post-exercise trajectories of neutrophils (delayed second rise peaking at 2 h) and lymphocytes (fall below baseline within 30 min), and the divergence of the two monocyte subsets. Redrawn after Gabriel & Kindermann 1997, Fig. 1.
Absolute leukocyte concentration before and after a 60-s all-out cycle-ergometer test. Eight healthy male athletes (29 ± 4 yr, 74 ± 5 kg, 178 ± 7 cm) performed a single 60-s maximal test (489 ± 34 W; peak lactate 14.1 mmol·l⁻¹, reached in the 6th minute post-exercise). Blood was sampled before (pre), within the first minute after (0), and 2, 4, 8, 16, 32 and 48 min after the end of the test; the shaded band marks the test. Values are corrected for plasma-volume shifts. Means and SD (upper bar only); *** p < 0.001 vs. pre (analysis of variance, Newman-Keuls post-hoc test). Leukocytes peak at 8 min post (≈ +57 %) and have returned to baseline by 32 min — a time course far too fast for de novo production, and therefore indicative of reversible mobilisation from the marginal pool. Redrawn after Gabriel et al. 2003, Fig. 2.
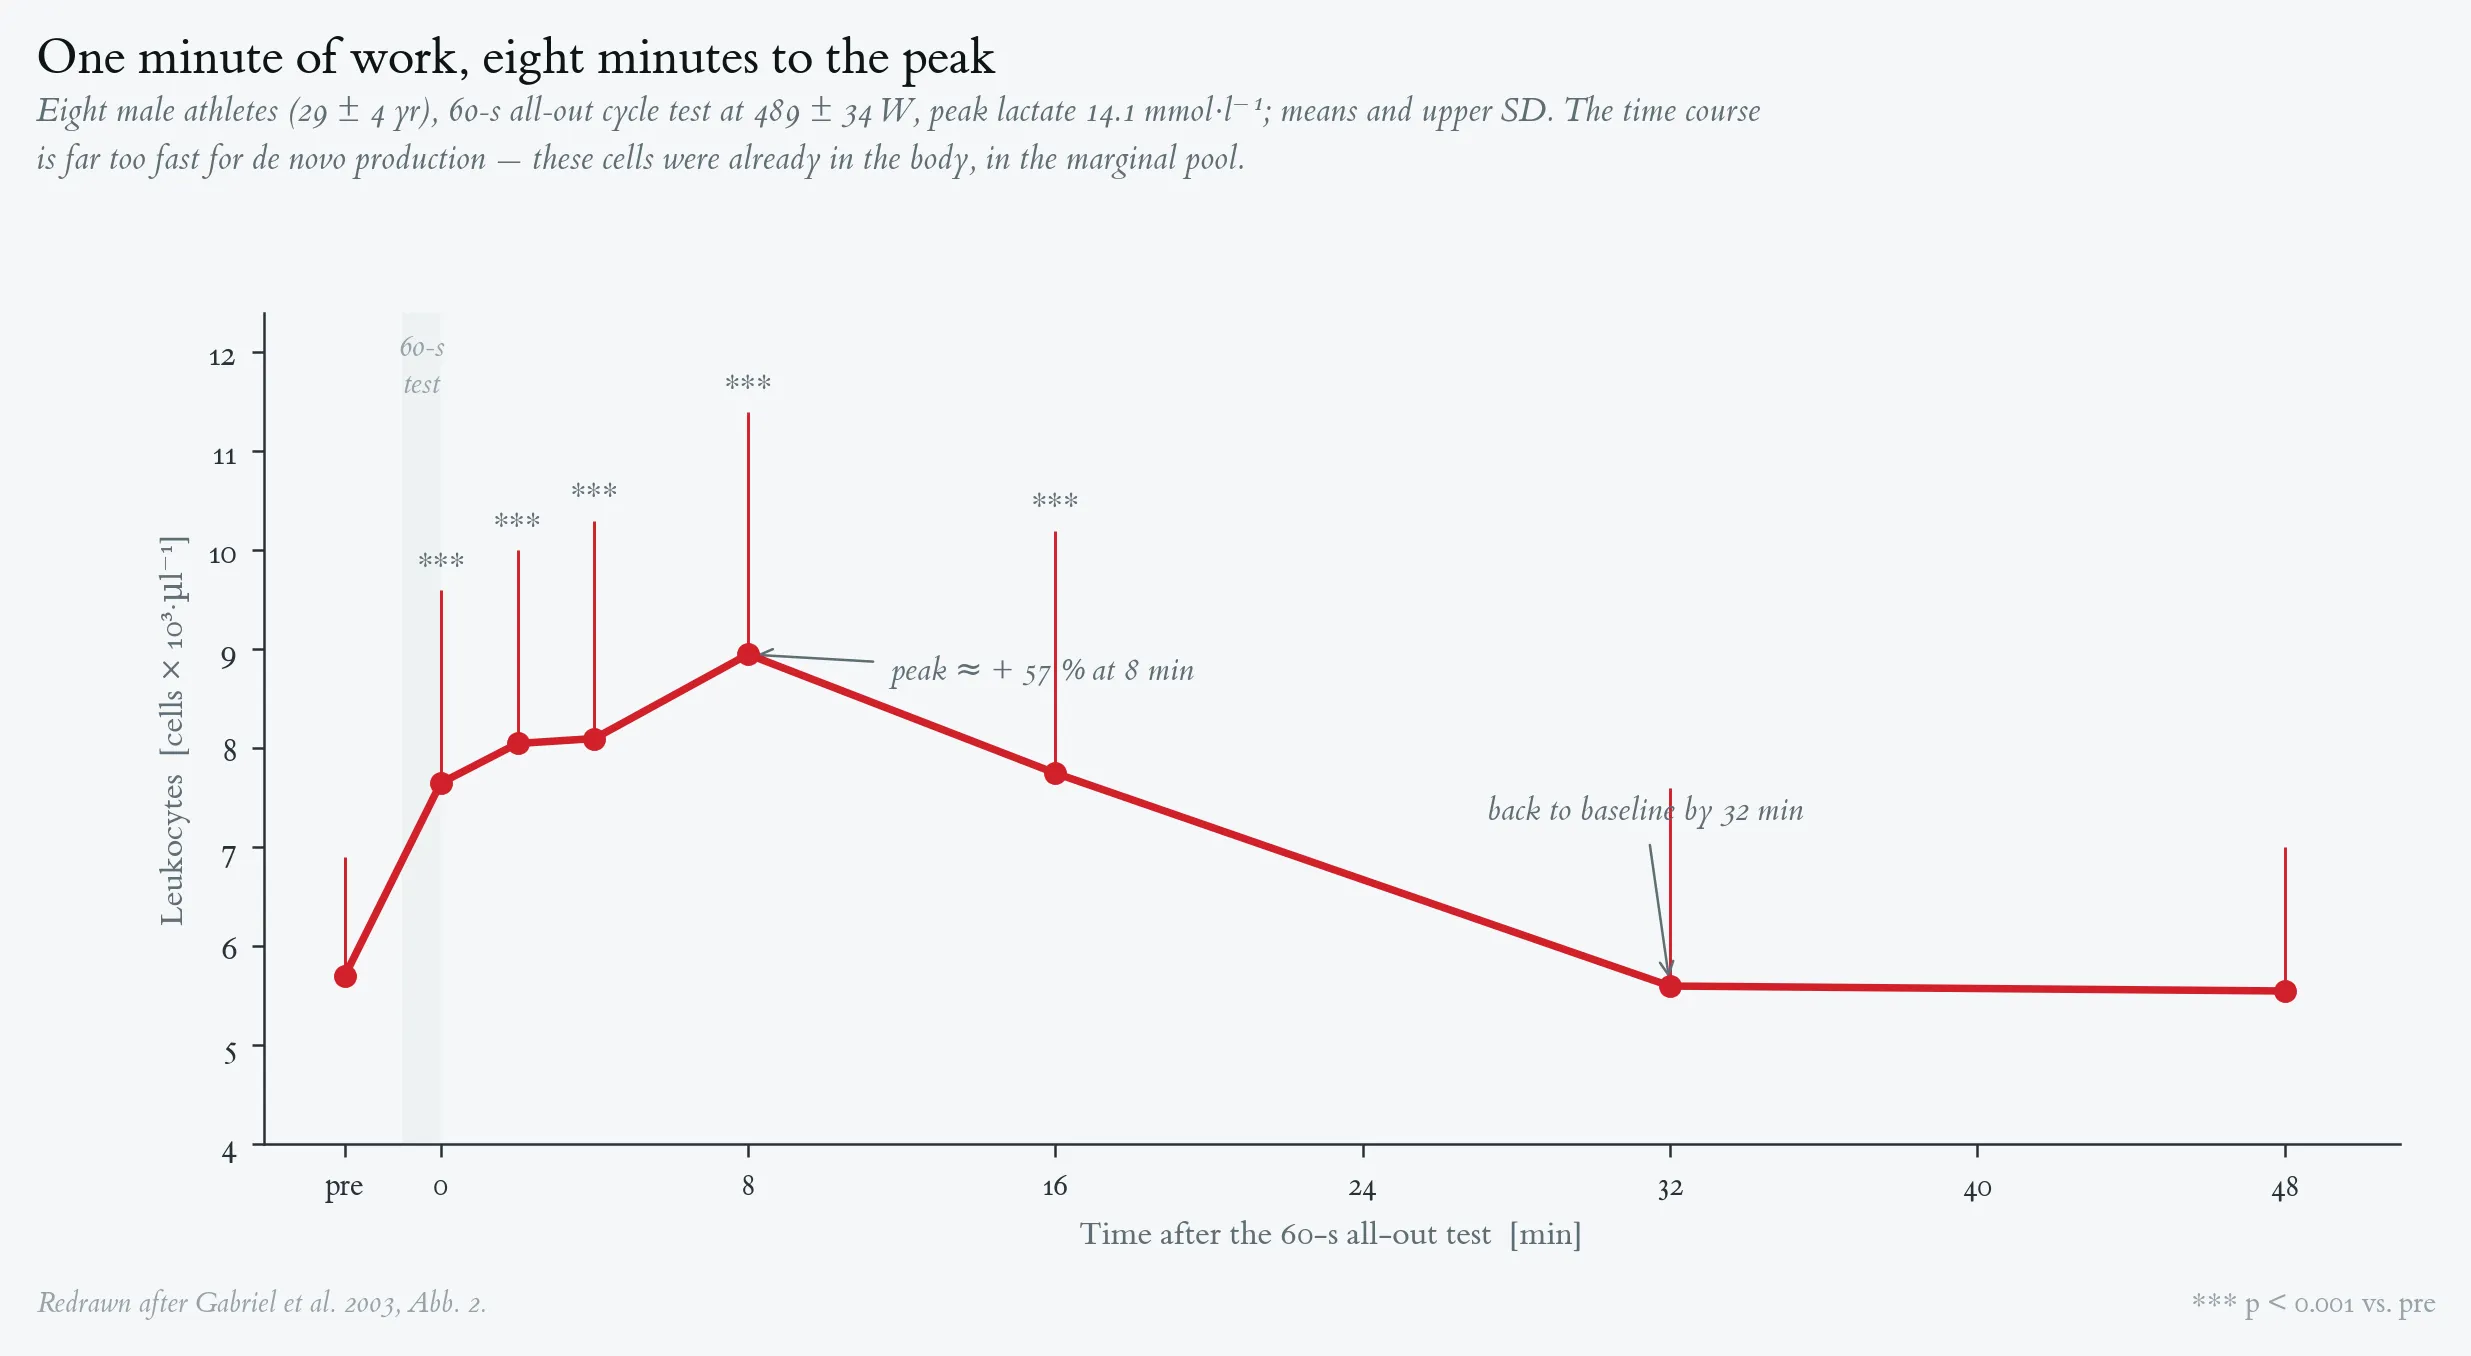
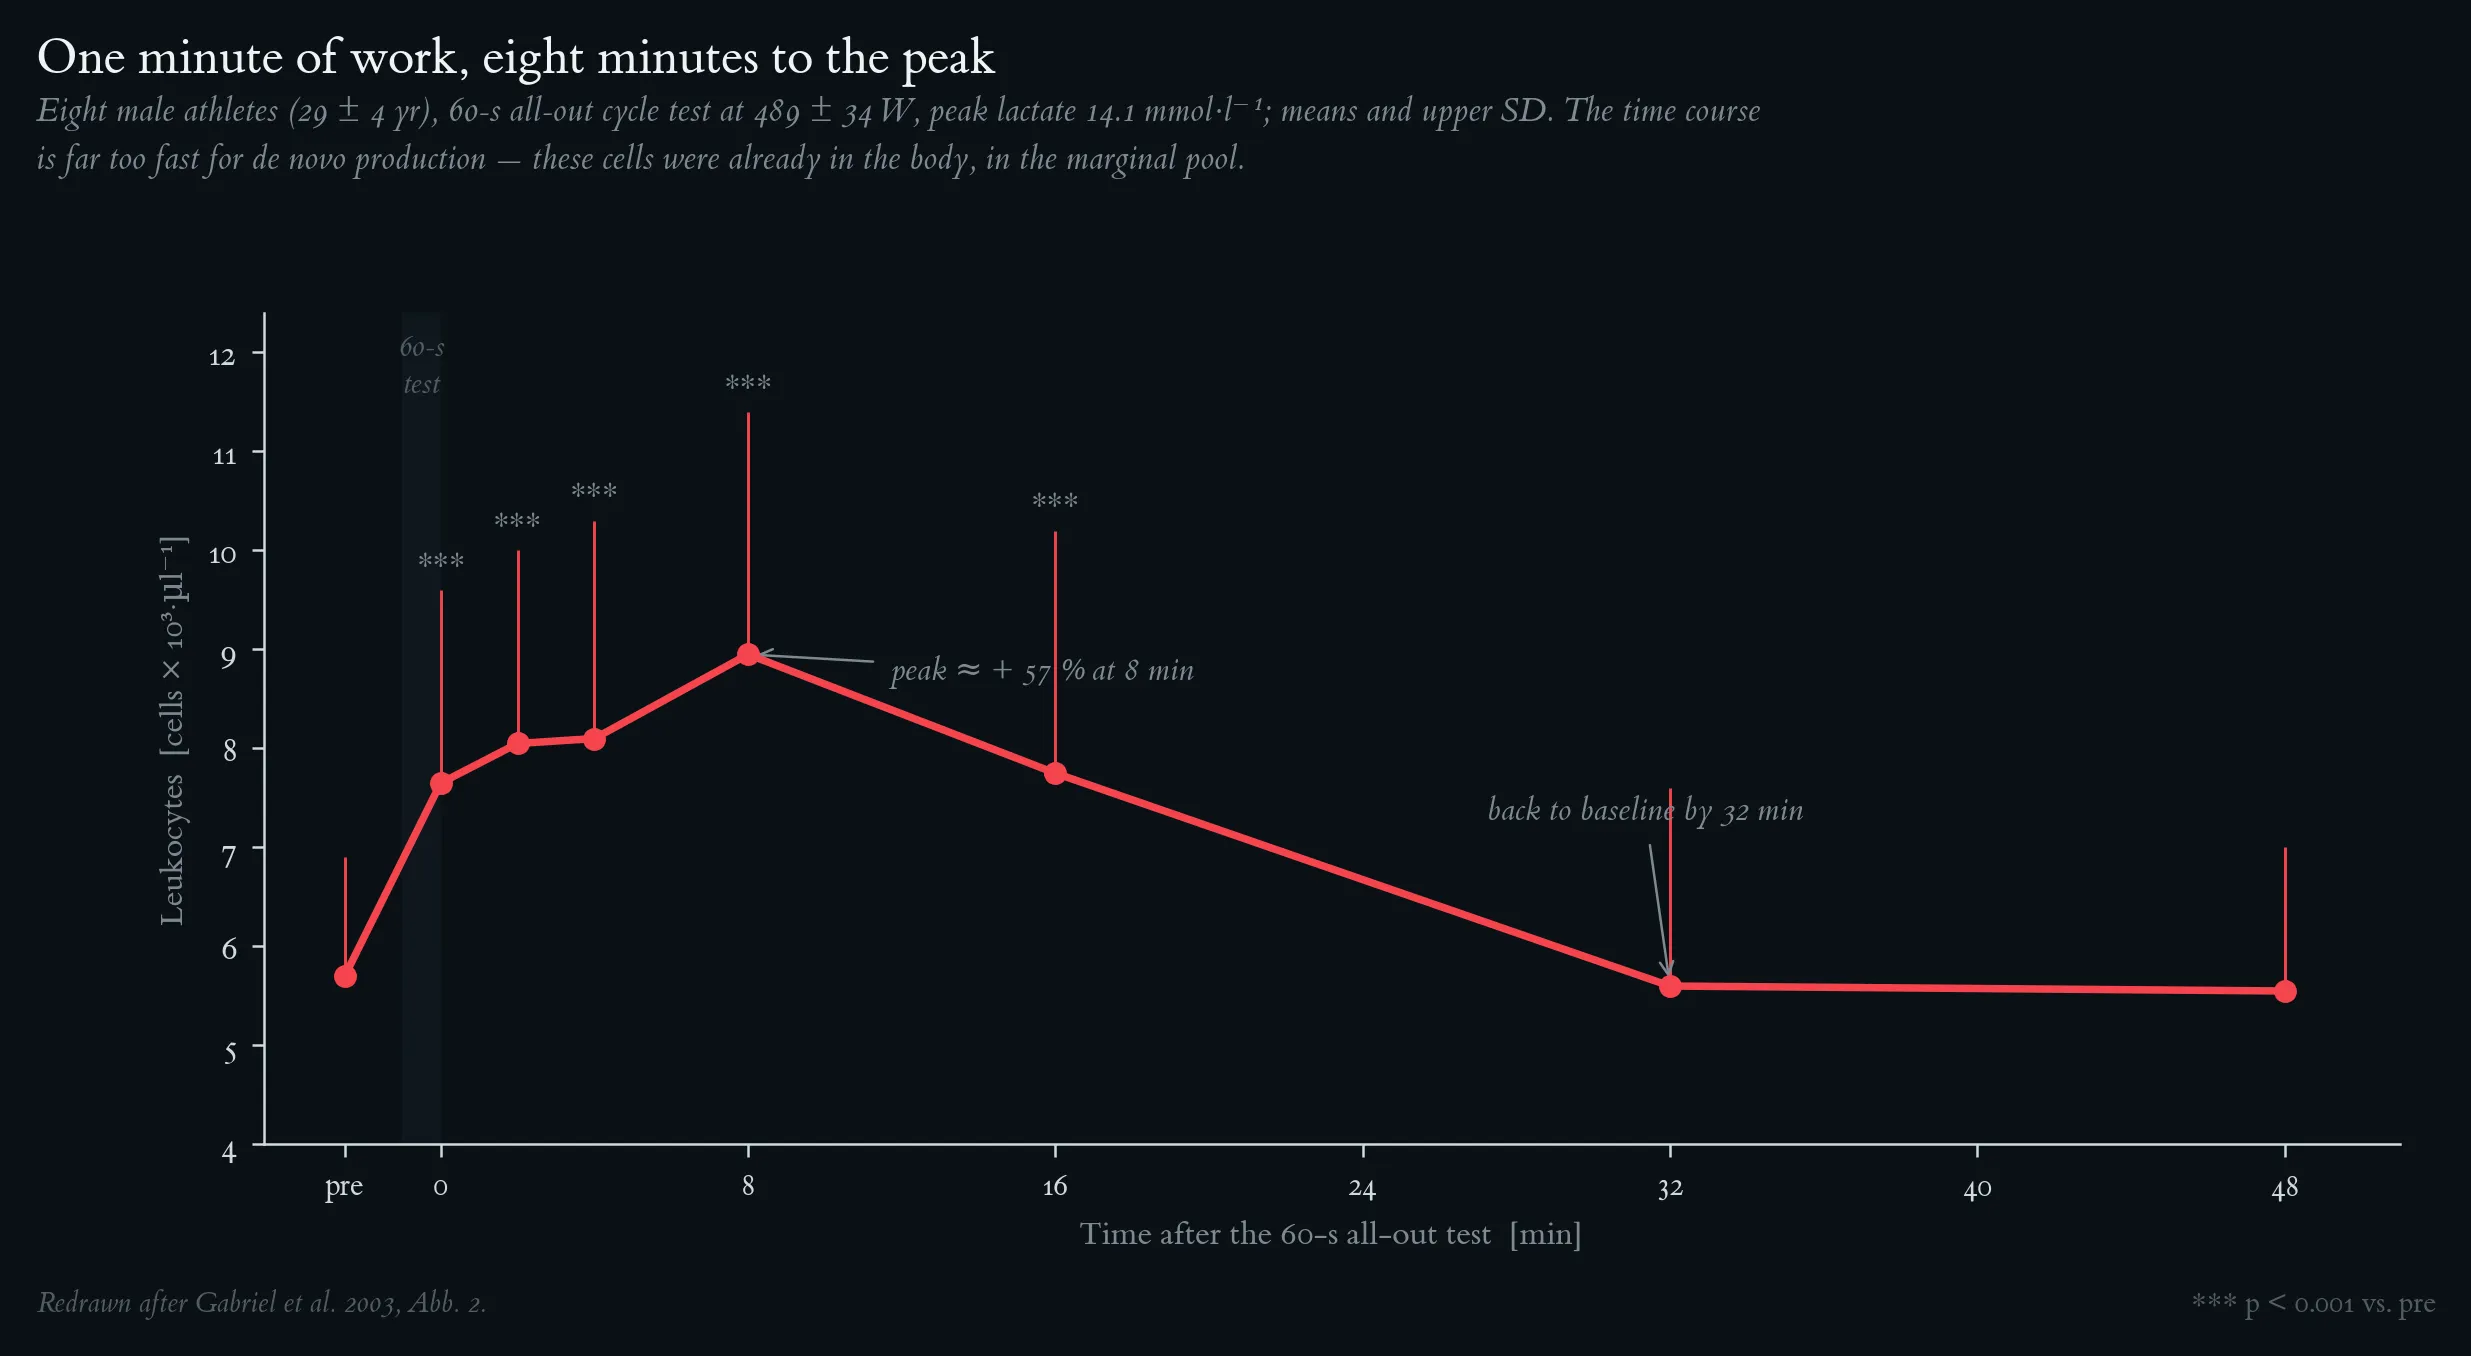
Absolute leukocyte concentration before and after a 60-s all-out cycle-ergometer test. Eight healthy male athletes (29 ± 4 yr, 74 ± 5 kg, 178 ± 7 cm) performed a single 60-s maximal test (489 ± 34 W; peak lactate 14.1 mmol·l⁻¹, reached in the 6th minute post-exercise). Blood was sampled before (pre), within the first minute after (0), and 2, 4, 8, 16, 32 and 48 min after the end of the test; the shaded band marks the test. Values are corrected for plasma-volume shifts. Means and SD (upper bar only); *** p < 0.001 vs. pre (analysis of variance, Newman-Keuls post-hoc test). Leukocytes peak at 8 min post (≈ +57 %) and have returned to baseline by 32 min — a time course far too fast for de novo production, and therefore indicative of reversible mobilisation from the marginal pool. Redrawn after Gabriel et al. 2003, Fig. 2.
The immediate leukocytosis resolved by subpopulation. (A) CD3⁻CD16⁺ NK cells, (B) CD3⁺CD4⁻ T cytotoxic/suppressor cells, (C) neutrophils, (D) CD3⁺CD4⁺ T helper/inducer cells and CD19⁺ B cells. Subjects, protocol, sampling scheme, plasma-volume correction and statistics as in Figure 2; dashed vertical lines mark the peak of each wave. Early wave (red): NK cells rise +411 % immediately after the test and peak at 2 min post (+521 %) — the largest increase of any subpopulation; T cytotoxic/suppressor cells belong to this wave but rise more slowly (+70 % already at 1 min, maximum +95 % at 8 min). Late wave (blue, green): neutrophils (+26 %), T helper/inducer cells (+43 %) and B cells (+70 %) peak at 8–16 min post. All populations have returned to pre-exercise values within 32 min. Redrawn after Gabriel et al. 2003, Fig. 3.
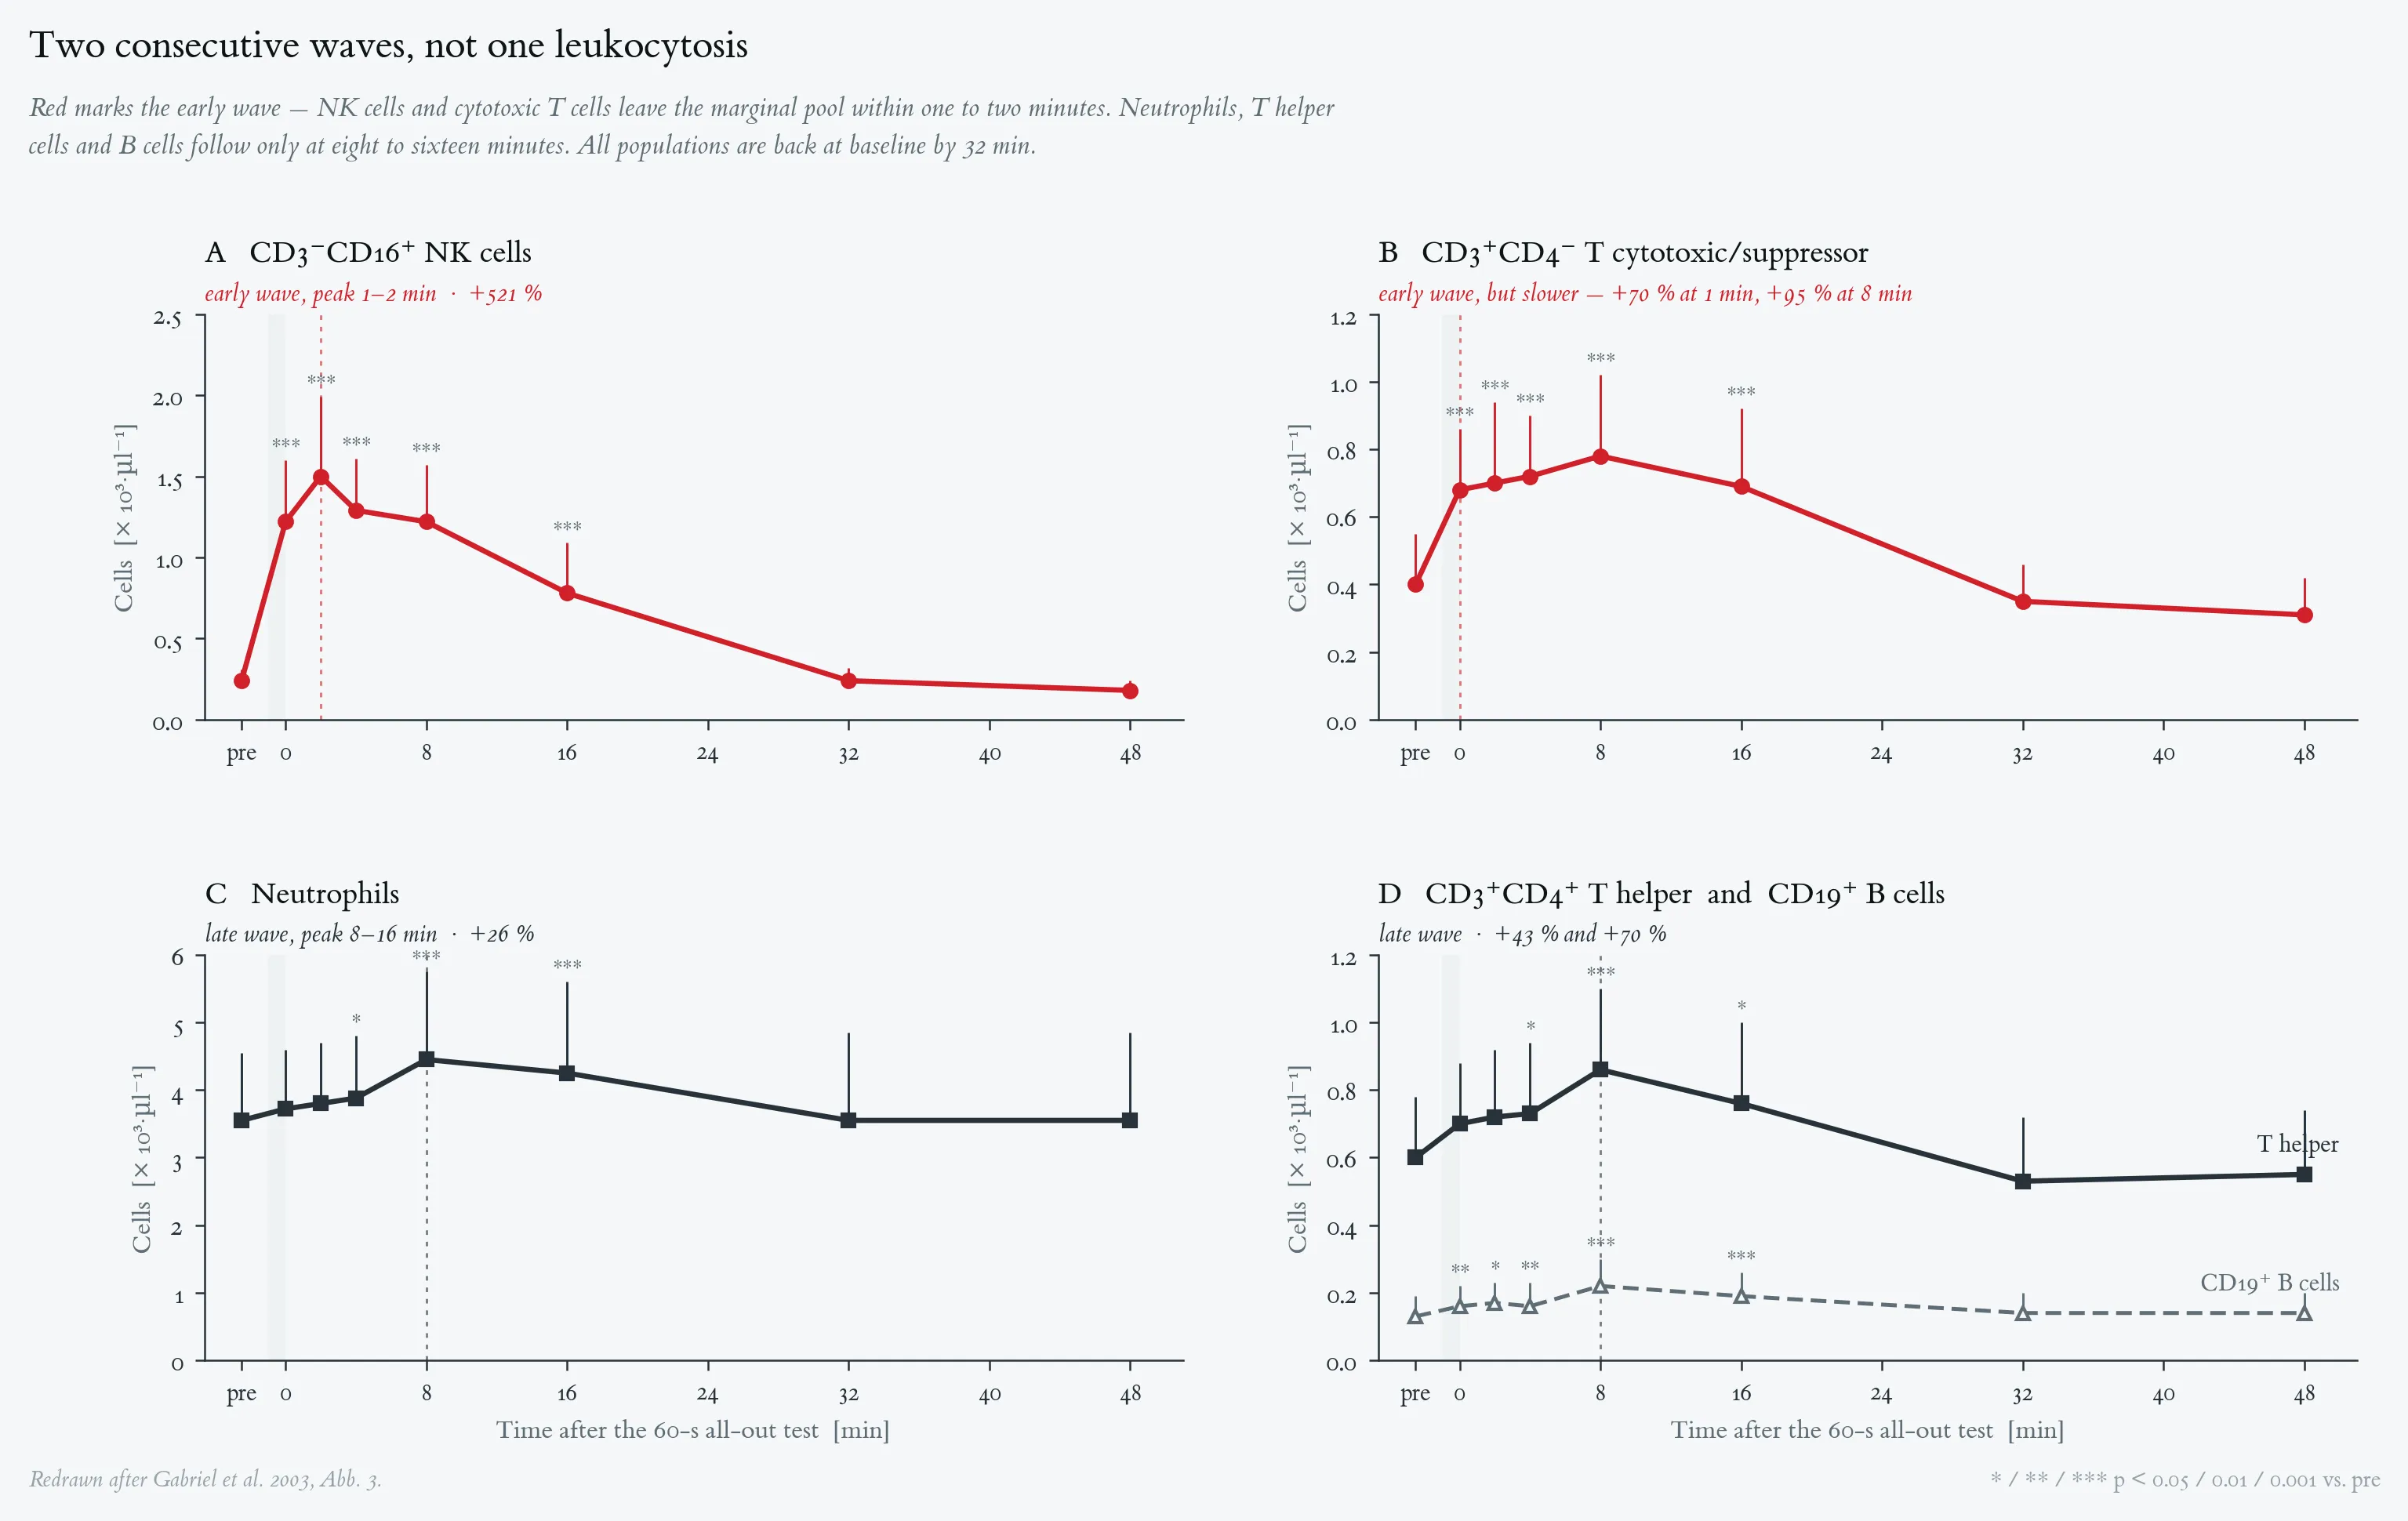
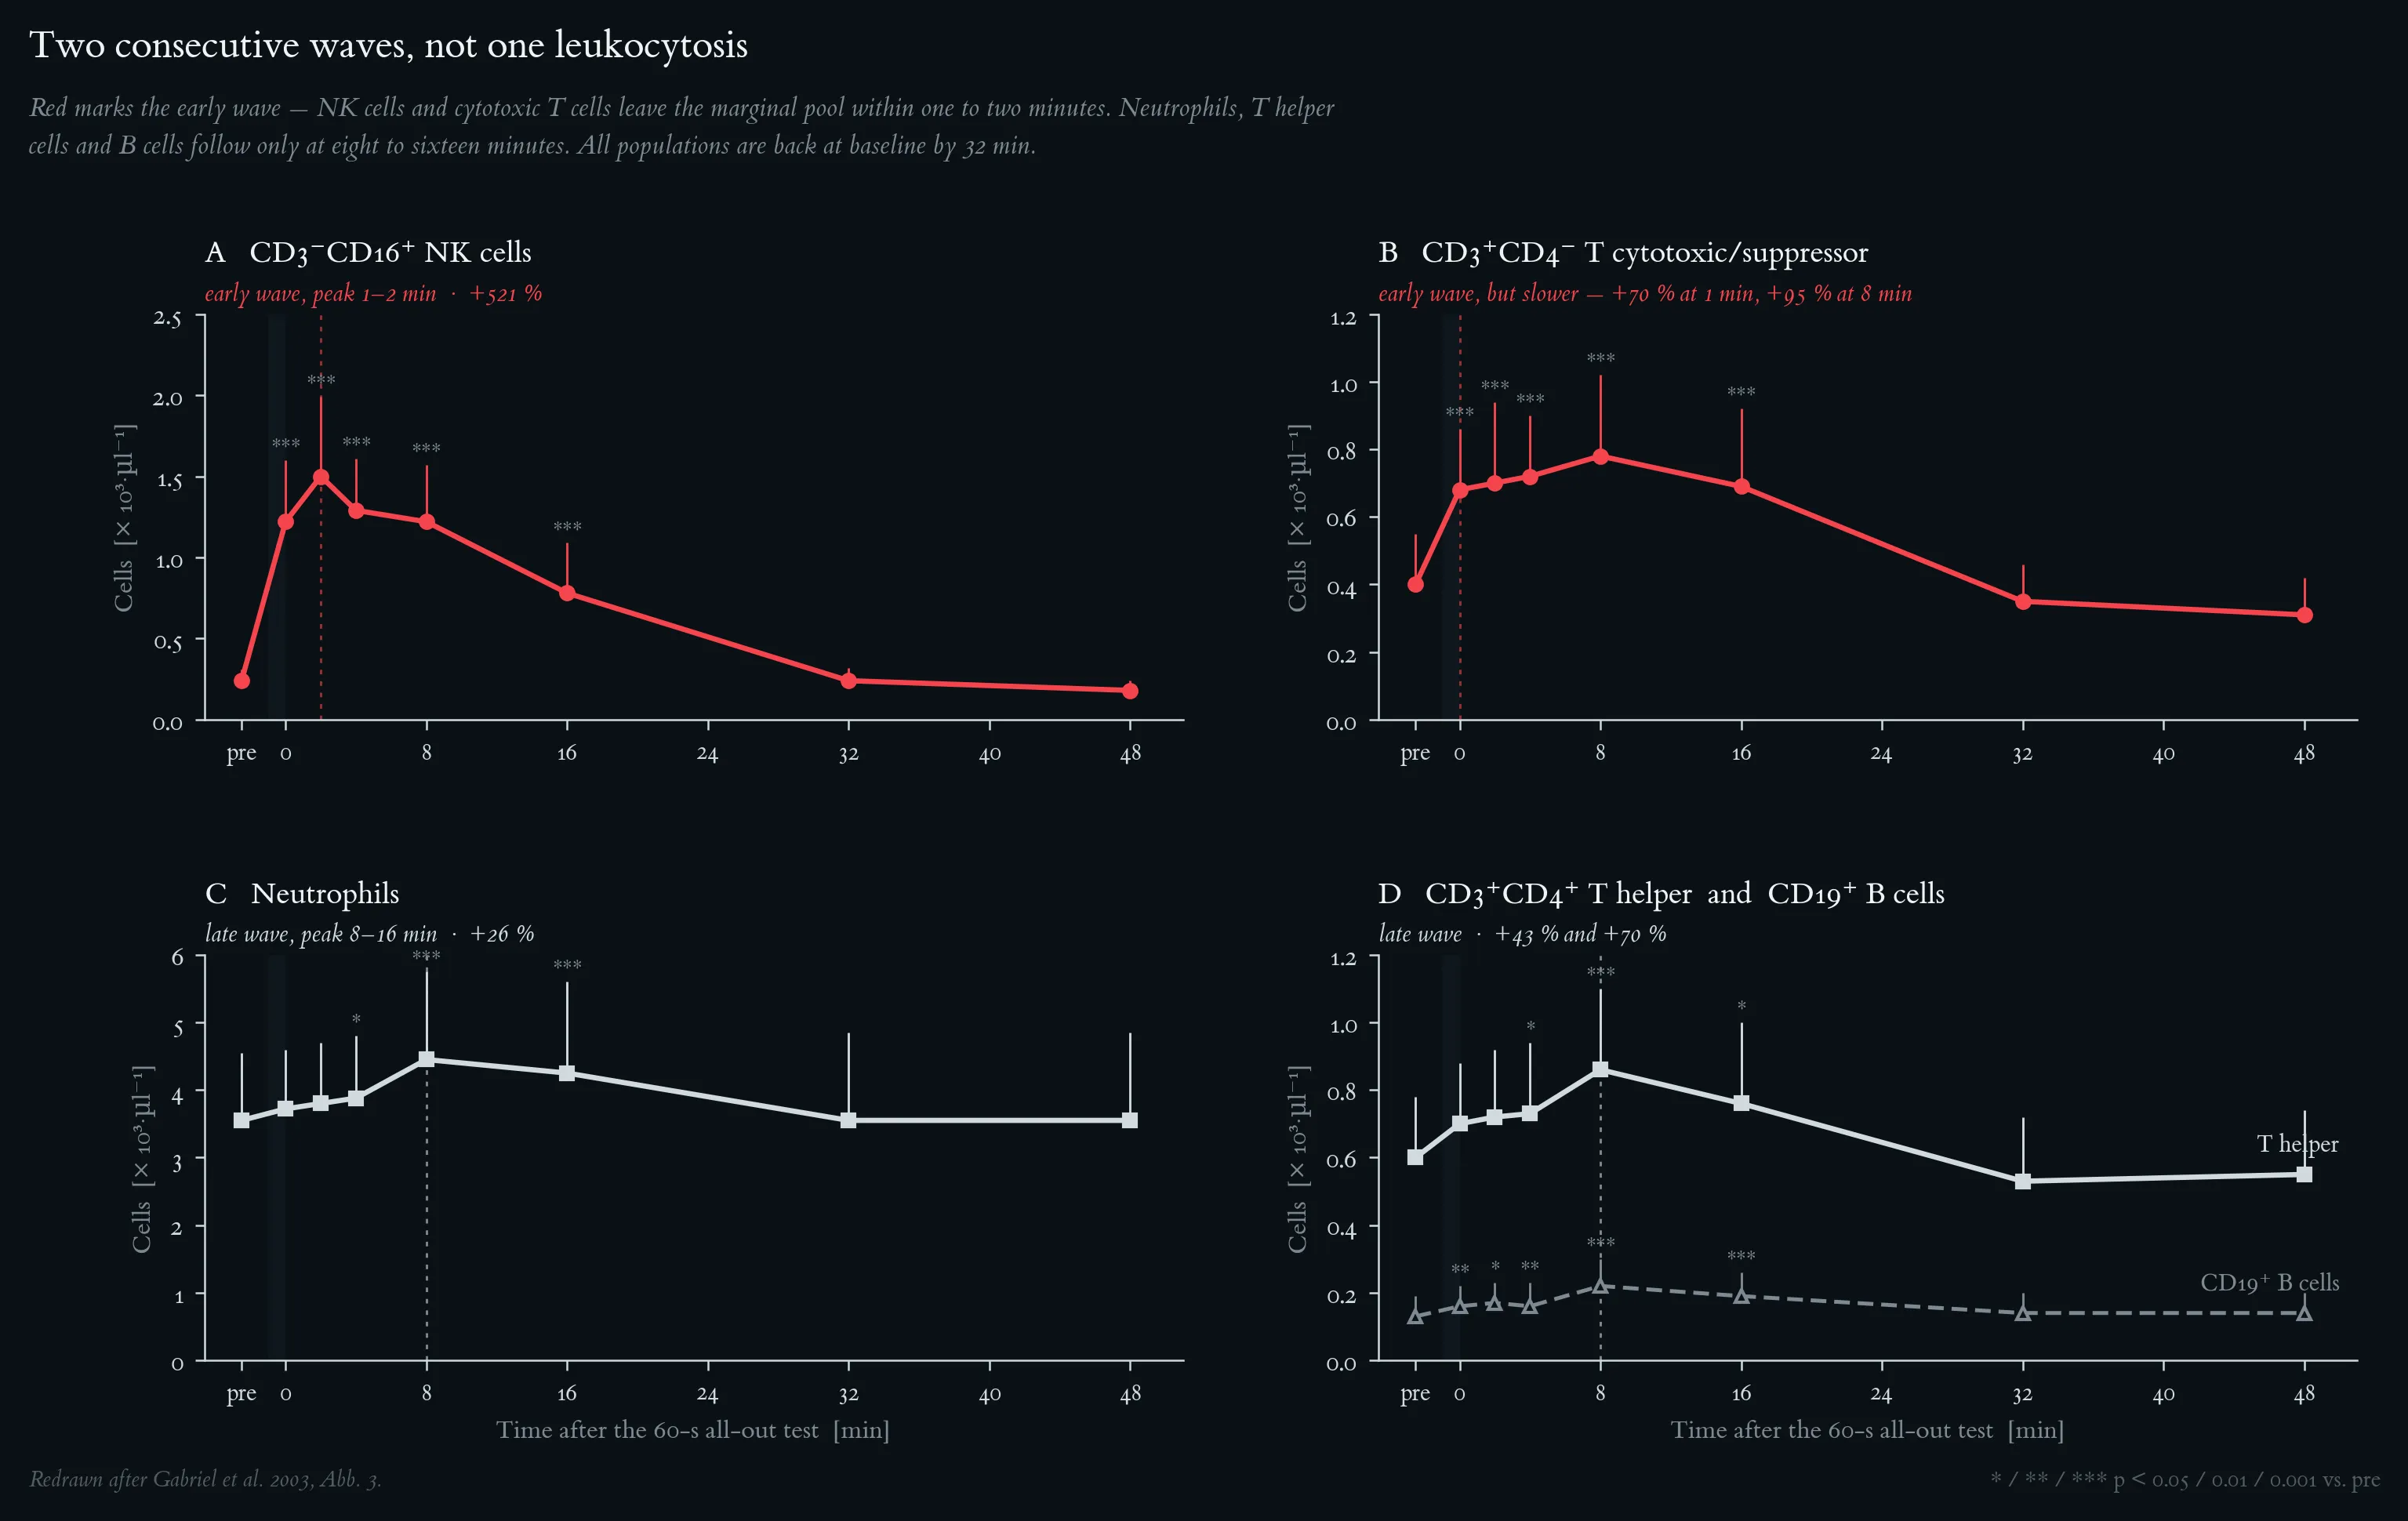
The immediate leukocytosis resolved by subpopulation. (A) CD3⁻CD16⁺ NK cells, (B) CD3⁺CD4⁻ T cytotoxic/suppressor cells, (C) neutrophils, (D) CD3⁺CD4⁺ T helper/inducer cells and CD19⁺ B cells. Subjects, protocol, sampling scheme, plasma-volume correction and statistics as in Figure 2; dashed vertical lines mark the peak of each wave. Early wave (red): NK cells rise +411 % immediately after the test and peak at 2 min post (+521 %) — the largest increase of any subpopulation; T cytotoxic/suppressor cells belong to this wave but rise more slowly (+70 % already at 1 min, maximum +95 % at 8 min). Late wave (blue, green): neutrophils (+26 %), T helper/inducer cells (+43 %) and B cells (+70 %) peak at 8–16 min post. All populations have returned to pre-exercise values within 32 min. Redrawn after Gabriel et al. 2003, Fig. 3.
Divergent mobilisation of the two monocyte subpopulations after a 60-s all-out test. Filled symbols: CD14⁺CD16⁻ regular monocytes; open symbols: CD14⁺CD16⁺ mature monocytes (premacrophages). Subjects, protocol, sampling and statistics as in Figure 2; error bars are drawn in one direction per series for legibility. Regular monocytes rise modestly (+33 %) immediately after the test and are back at baseline by 4 min. Premacrophages rise later and disproportionately, peaking at 8 min post at roughly 4.7 times the resting value (+372 %); at that point they make up ≈ 50 % of all circulating monocytes, against 10–15 % at rest. The premacrophage therefore resides preferentially in the marginal pool, which can be read as a standing reserve of activated cells poised to migrate into tissue. Redrawn after Gabriel et al. 2003, Fig. 4.
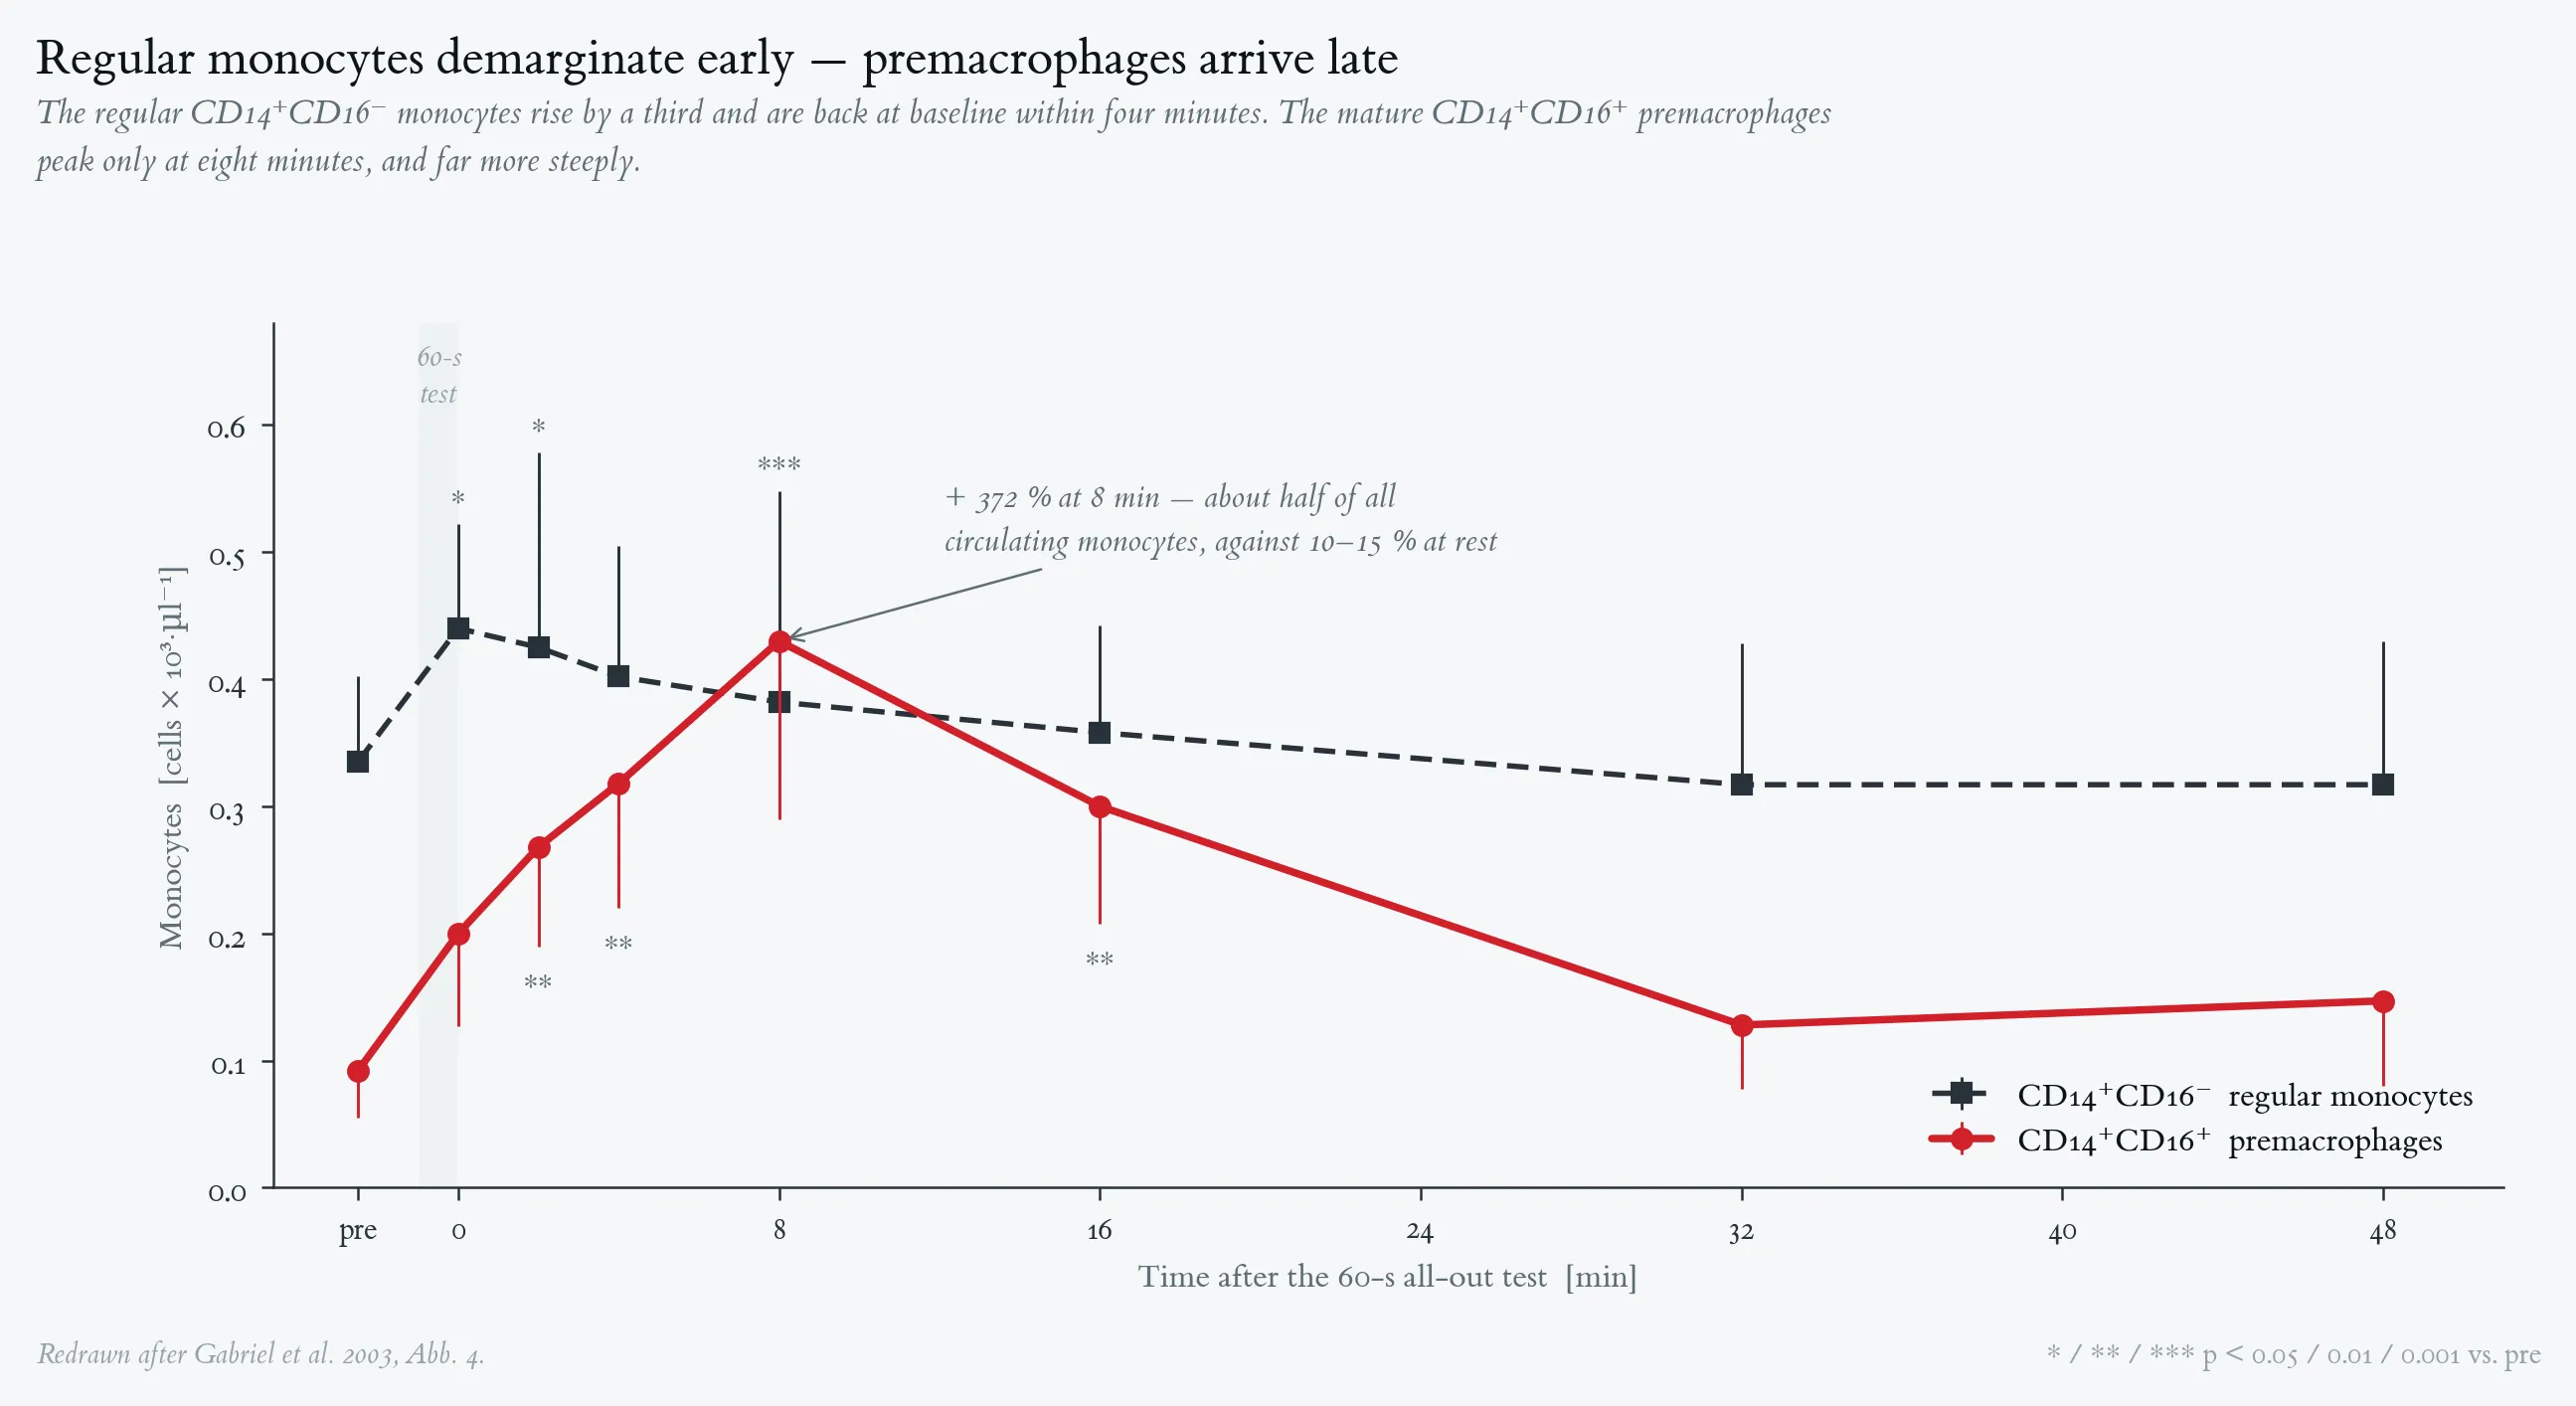
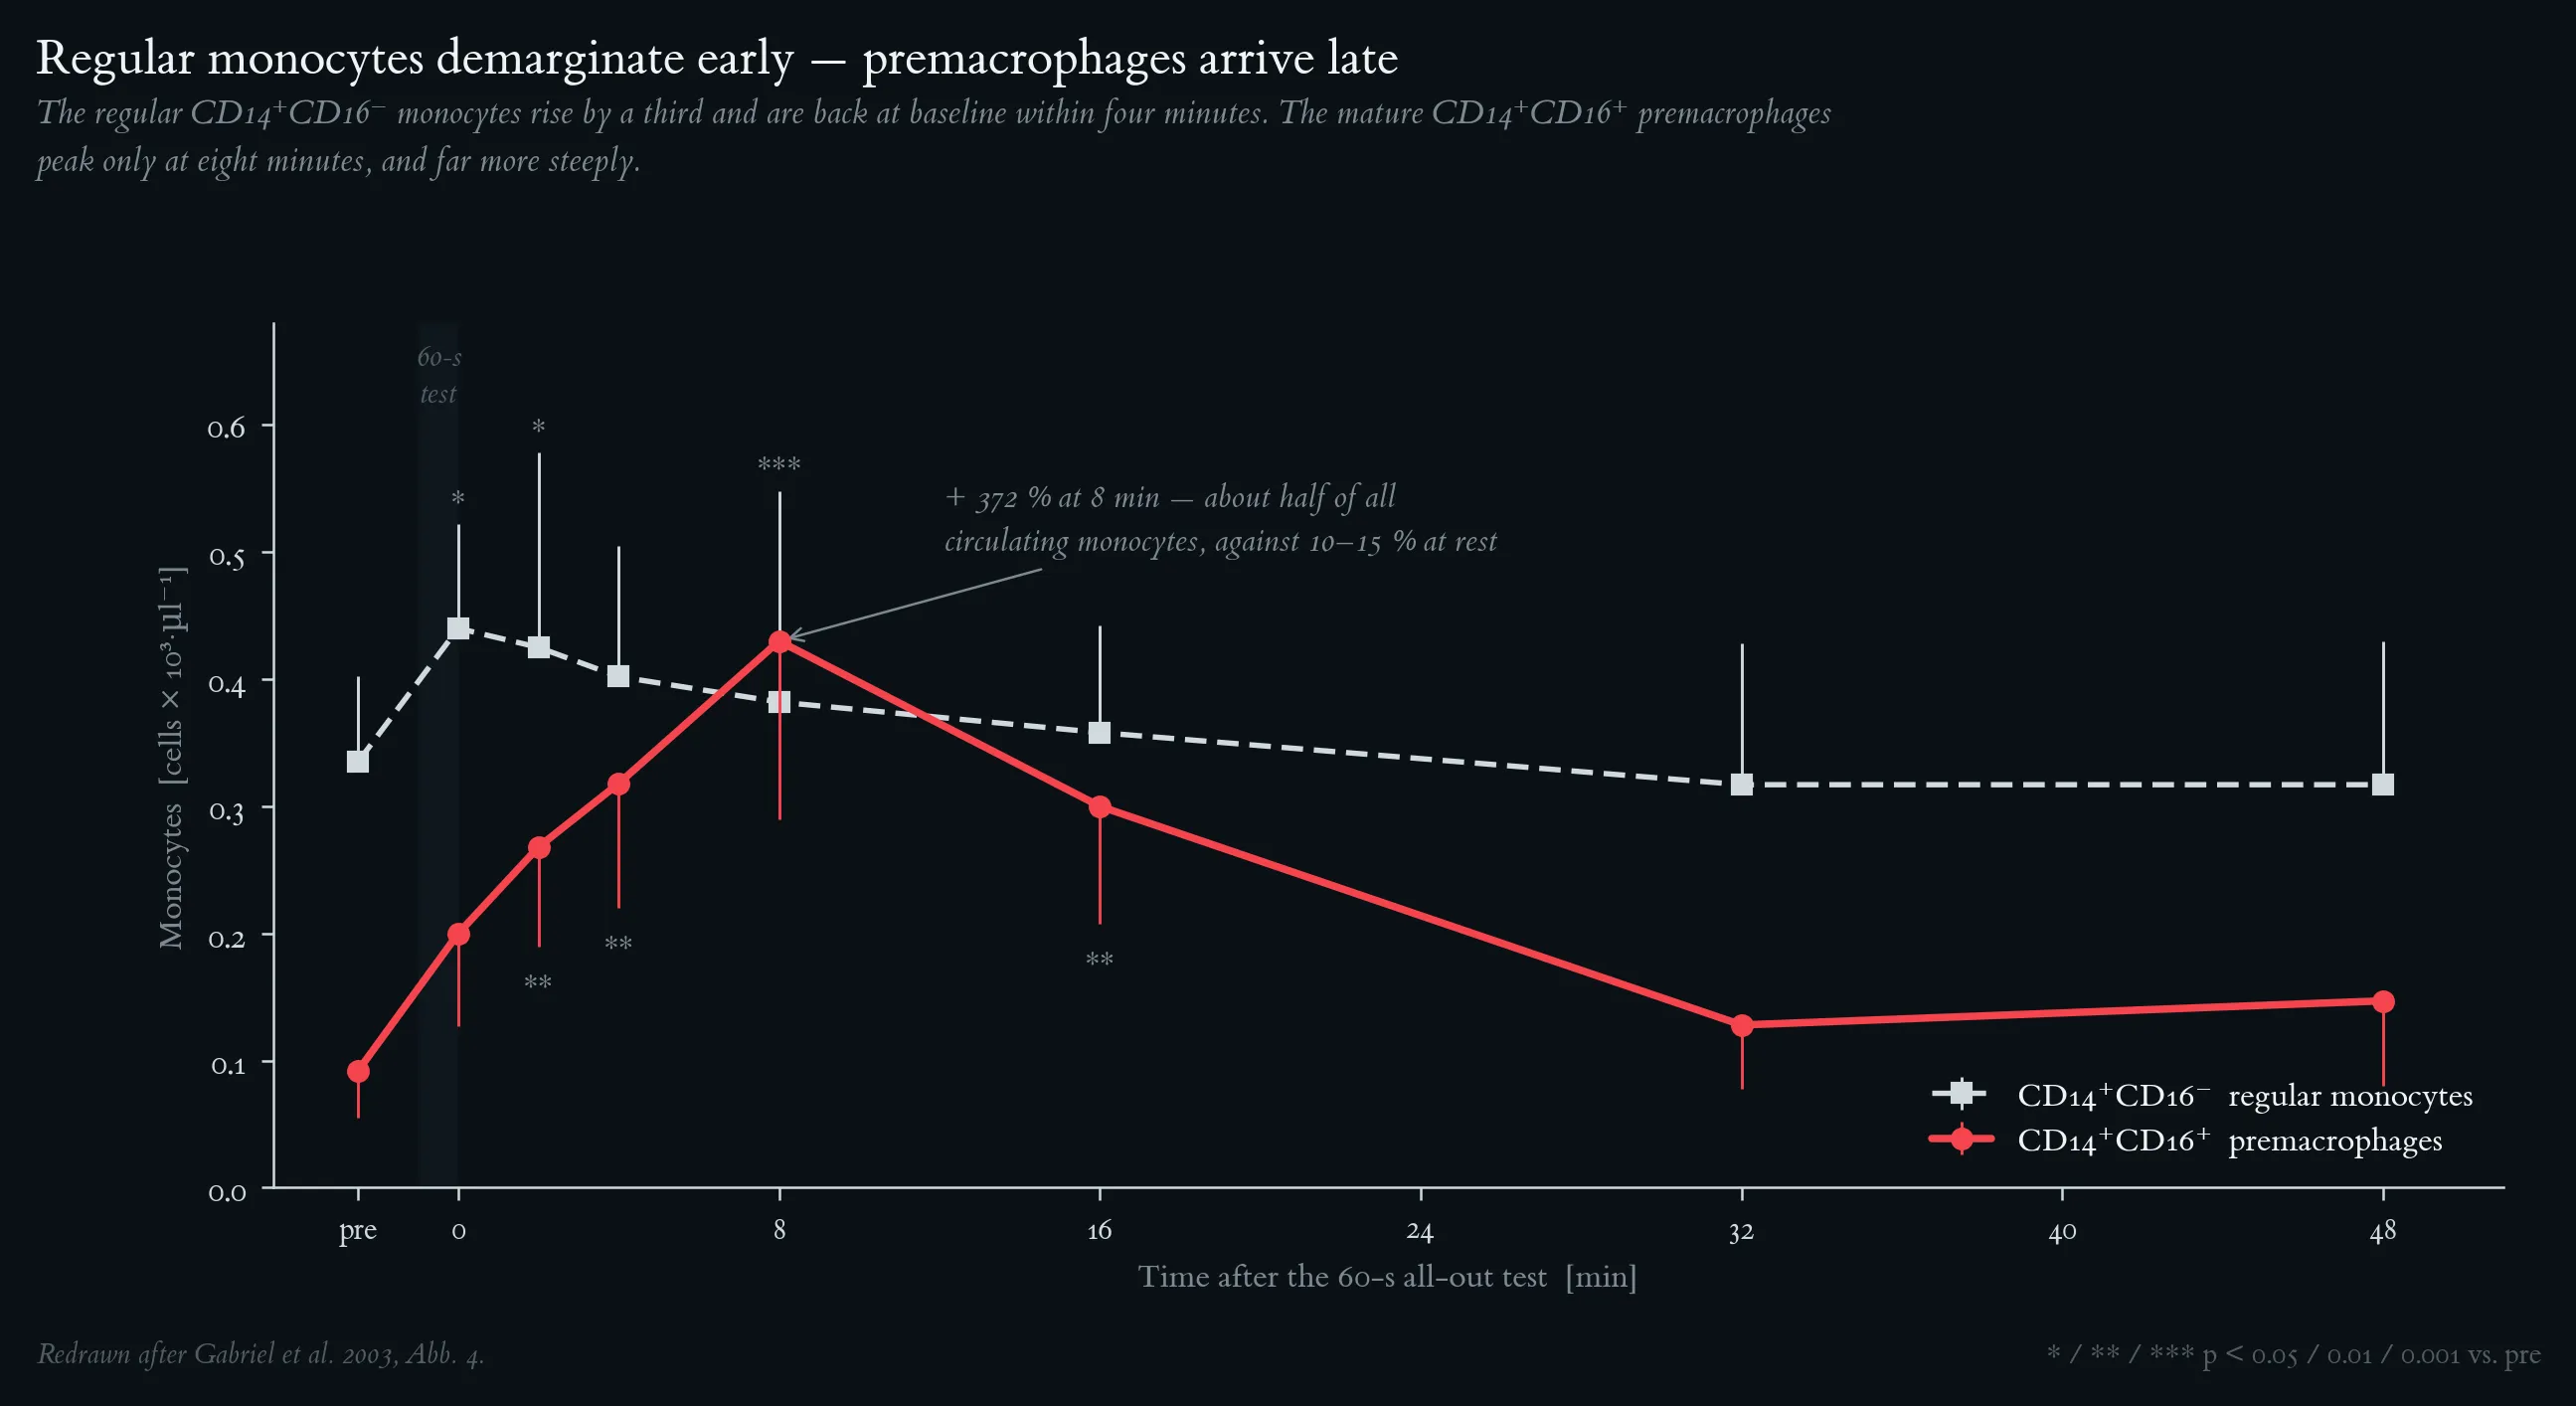
Divergent mobilisation of the two monocyte subpopulations after a 60-s all-out test. Filled symbols: CD14⁺CD16⁻ regular monocytes; open symbols: CD14⁺CD16⁺ mature monocytes (premacrophages). Subjects, protocol, sampling and statistics as in Figure 2; error bars are drawn in one direction per series for legibility. Regular monocytes rise modestly (+33 %) immediately after the test and are back at baseline by 4 min. Premacrophages rise later and disproportionately, peaking at 8 min post at roughly 4.7 times the resting value (+372 %); at that point they make up ≈ 50 % of all circulating monocytes, against 10–15 % at rest. The premacrophage therefore resides preferentially in the marginal pool, which can be read as a standing reserve of activated cells poised to migrate into tissue. Redrawn after Gabriel et al. 2003, Fig. 4.
One-Minute-Paper Topics
A One-Minute-Paper (OMP) is a short, focused prompt that students answer in ~60 seconds at the end of a session to consolidate learning, surface misconceptions, and provide formative feedback. When answering, be concise, specific, and use terminology from today’s session.
- What are the two stimulus classes Gabriel & Kindermann (1997) distinguish on the IAT scale, and what lactate concentrations and durations characterise each?
- Describe the biphasic pattern of exercise leukocytosis for bouts < 2 h. Which cell types peak during exercise, and which rise again after cessation?
- In the 60-s all-out test of Gabriel et al. (2003), two consecutive waves of immediate leukocytosis were resolved. Which cell types peaked in the early wave (1–2 min post) and which in the late wave (8–16 min post)?
- What is the “marginal pool”, and how does its mobilisation explain why all cell subpopulations return to baseline within ≈ 30 min after an anaerobic bout?
Key References
- Gabriel H., Kindermann W. The acute immune response to exercise: what does it mean? Int. J. Sports Med. 18 (Suppl 1): S28–S45, 1997.
- Gabriel H.H.W., Scharhag J., Rätz M., Kindermann W. Charakterisierung der sofortigen Leukozytose nach anaerober Belastung. Dtsch. Z. Sportmed. 54(10): 274–280, 2003.
- Stegmann H., Kindermann W., Schnabel A. Lactate kinetics and individual anaerobic threshold. Int. J. Sports Med. 2: 160–165, 1981.
- Ziegler-Heitbrock H.W.L. Heterogeneity of human blood monocytes: the CD14⁺CD16⁺ subpopulation. Immunol. Today 17: 424–428, 1996.
2 The Machinery: Hormones, β2-Receptors and Diapedesis
Learning objectives:
- The five hormonal mediators and the exercise categories that stimulate them
- The pathway catecholamine → β2-receptor → cAMP → LFA-1 avidity → detachment
- The ACTH–cortisol route to delayed neutrophilia, and the four steps of diapedesis
2.1 Hormones
Exercise interacts with several endocrine axes; Gabriel & Kindermann (1997) measured five mediators in parallel (their Fig. 9) and Gabriel et al. (2003) added catecholamine plasma kinetics for the 60-s test.
- Catecholamines (adrenaline, noradrenaline). Greatest rises with anaerobic and short, high-intensity aerobic exercise. In Gabriel et al. (2003) noradrenaline rose ~260 % and adrenaline ~230 % at the end of the 60-s test; both peaked within the first minute post-exercise and declined nearly linearly over the next 4 min. Their kinetics match the early wave of mobilisation (NK cells, Tc/s, regular monocytes).
- ACTH and cortisol. Most strongly stimulated by exhaustive endurance exercise at or above the IAT and by long-term endurance exercise (e.g. 100-km run). Meyer et al. (2001) demonstrated that the anaerobic interval session (AN-TS) also generated a robust cortisol rise (≈ 3.5 × Co-day at 15 min post-exercise), more than 2 × the rise after a single 60-s test. Cortisol drives the delayed neutrophilia and lymphopenia of the post-exercise phase.
- β-endorphin. Centrally co-released with ACTH from the pituitary. Only minimal change after single anaerobic bouts. Highest after intensive endurance ≥ 1 h or long-term endurance at lower intensity (Gabriel & Kindermann 1997).
- Growth hormone & prolactin (mentioned only briefly in Gabriel & Kindermann 1997 — both contribute to mobilising lymphocytes during exercise).
Functional links (Gabriel & Kindermann 1997, §“Phagocytes”; Simon et al. 2026, Discussion):
- Catecholamines → β2-adrenergic mobilisation from the marginal pool (see §2.2) → early lymphocytosis, neutrocytosis during the bout.
- ACTH → systemic cortisol → demargination from bone marrow + reduced lymphocyte recirculation → delayed neutrophilia at 2 h and lymphopenia below baseline for several hours.
- Cytokines (IL-1, IL-6, TNF) released from active muscle and monocytes → hepatic ACTH-cortisol axis → acute phase proteins (CRP). This sequence is the immunological backbone of the noninfectious exercise-induced APR.
2.2 β2-adrenergic receptors
The shifting of cells between the circulating and marginal pool is the dominant mechanism of the immediate exercise leukocytosis. Catecholamines act on β2-adrenergic receptors expressed on both leukocytes and endothelial cells (Gabriel et al. 2003, Discussion; Gabriel & Kindermann 1997, §“Discussion”):
- β2-receptor density is highest on NK cells and on cytotoxic, non-MHC-restricted T cells, which is one reason these subpopulations show the largest amplitude of exercise-induced fluctuation.
- In vitro, infusion of adrenaline or the β2-agonist isoproterenol detaches adherent NK cells from cultured endothelium independent of blood flow. β2-antagonists attenuate this effect.
- Mechanistically, β2 stimulation triggers a rise of intracellular cAMP in the leukocyte/endothelium → conformational change of the integrin LFA-1 (CD11a/CD18) from a high-avidity to a low-avidity state → release of the cell into the circulation.
- α-adrenoceptors contribute mainly to the mobilisation of neutrophils.
Hence the early wave (NK, Tc/s, regular monocytes) of the immediate leukocytosis is the synergistic effect of (a) hemodynamic shear forces during exercise and (b) β2-adrenergic detachment from the endothelium. The late wave (neutrophils, helper T cells, B cells, premacrophages) is dominated by catecholamines, which remain elevated longer than heart rate or cardiac output (Fig. 5 of Gabriel et al. 2003). β2-down-regulation under chronic high catecholamine load is also one of the proposed contributors to overtraining-related immune changes (Gabriel & Kindermann 1997).
2.3 Diapedesis (transendothelial migration)
Gabriel & Kindermann (1997), § “NK cells and lymphocyte subpopulations”, formalise diapedesis as a four-step cascade:
- Rolling — locally produced cytokines induce endothelial selectins (E-, P-, L-selectin), which engage carbohydrate ligands on leukocytes and cause loose, rolling adhesion along the endothelium.
- Triggering / activation — chemokines (IL-8, MCP-1), CD31 or the T-cell receptor activate leukocyte integrins via conformational change (inactive → high-avidity state) within minutes.
- Firm adhesion — primarily mediated by LFA-1 (CD11a/CD18) binding to endothelial ICAM-1 / ICAM-2; both expression density and avidity contribute (a low-density active LFA-1 binds more firmly than a high-density inactive LFA-1).
- Transendothelial migration — leukocytes traverse the endothelium along chemotactic and haptotactic gradients into the target tissue.
The relevance for exercise:
- LFA-1 expression density is high on NK cells, cytotoxic non-MHC-restricted T cells and premacrophages, intermediate on CD45RO⁺ T cells and mature monocytes, low on CD45RA⁺ T cells and B cells.
- The subsets with the highest LFA-1 expression are exactly those that fall most below baseline during recovery (NK cells, premacrophages, Tc/s). Conversely, subsets with low LFA-1 (B cells, CD4⁺ T cells) show only small post-exercise dips.
- During exercise, β2-adrenergic signalling and APR mediators (cytokines, temperature) switch LFA-1 between avidity states within minutes. This is the molecular link between hormones (§2.1, §2.2) and diapedesis.
- After exercise, mature monocytes appear to re-attach to the endothelium (β2 stimulus removed; LFA-1 returns to high avidity), which explains why circulating mature monocyte counts decline below baseline while regular monocytes — newly arriving from the bone marrow — rise.
In long-term endurance exercise, the same machinery delivers neutrophils and monocytes into muscle tissue, where local cytokine release sustains the APR. The leukocytes that leave the circulation by diapedesis are not the same cells that enter it by demargination, which is why functional measurements before and after exercise sample different cell populations and must be interpreted accordingly.
2.4 Figures
Schematic of cell-surface receptor expression along the monocyte–macrophage maturation axis. Cells mature from the promonocyte (bone marrow) through the regular monocyte (CD14⁺CD16⁻) and the premacrophage (CD14⁺CD16⁺) in blood to the tissue macrophage. LPS-R (CD14), FcγR1 (CD64) and CR3 (CD11b) are progressively downregulated; LFA-1 (CD11a/CD18), LCA (CD45), HLA-DR and FcγR3 (CD16) are progressively upregulated; wedge width indicates relative expression. Dashed circles mark the compartments not accessible to peripheral-blood sampling. The high LFA-1 density of the premacrophage accounts both for its residence in the marginal pool and for its rapid re-adhesion during recovery, and CD16 (FcγR3) is the marker that defines it. Redrawn after Gabriel & Kindermann 1997, Fig. 11.
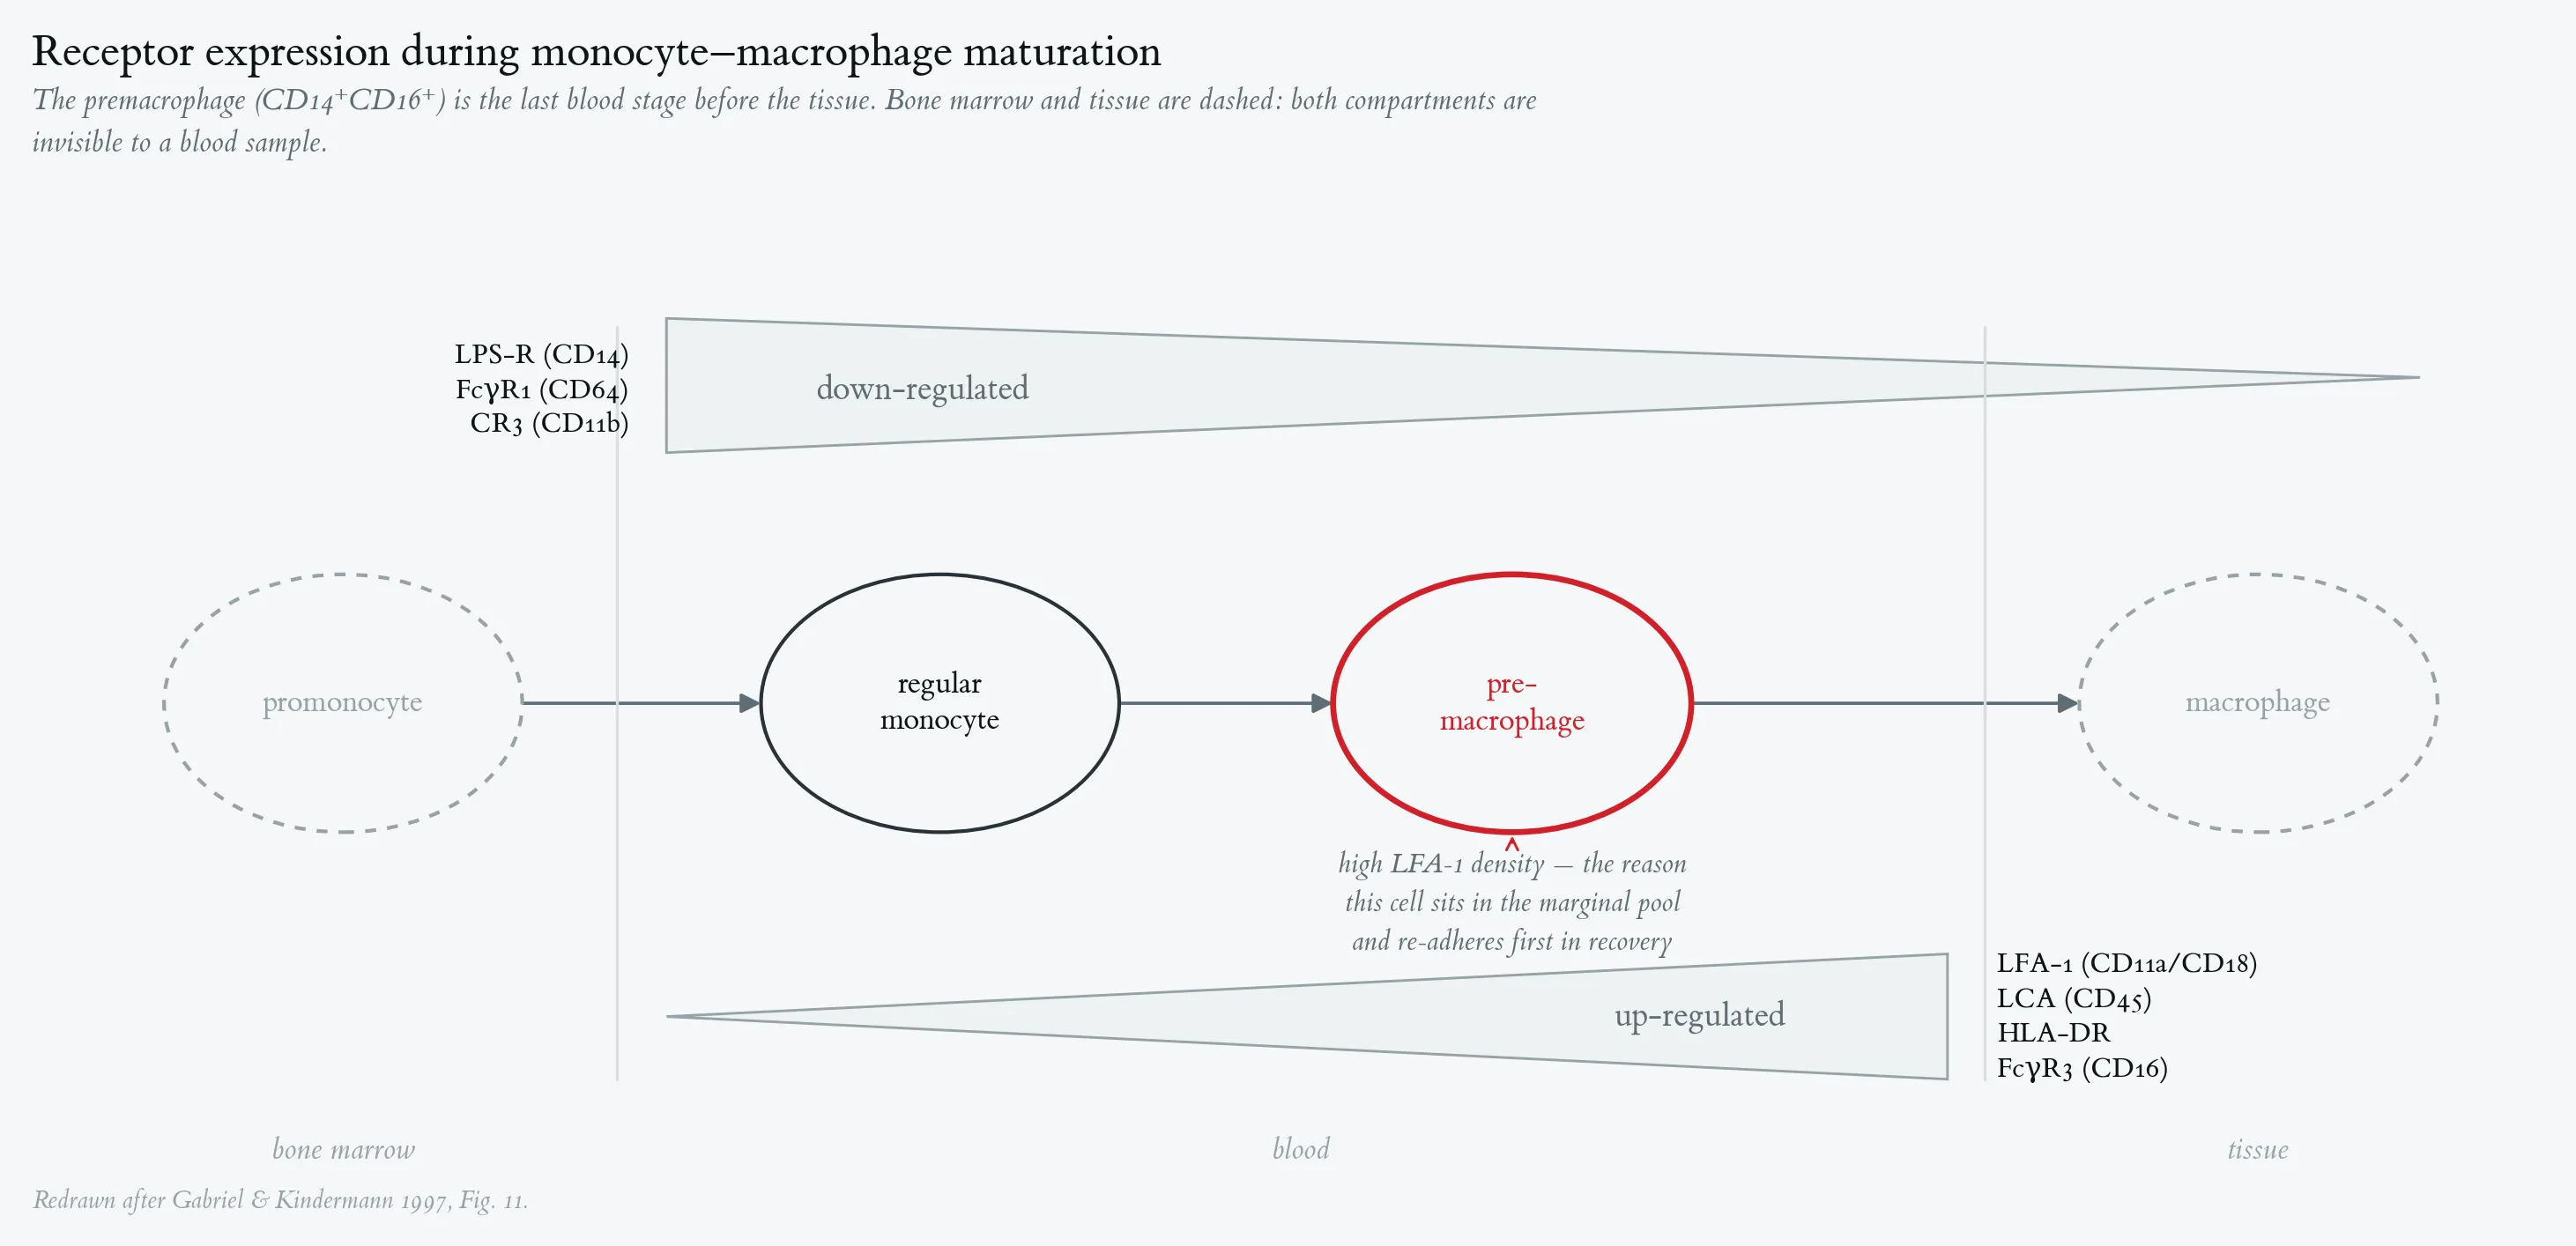
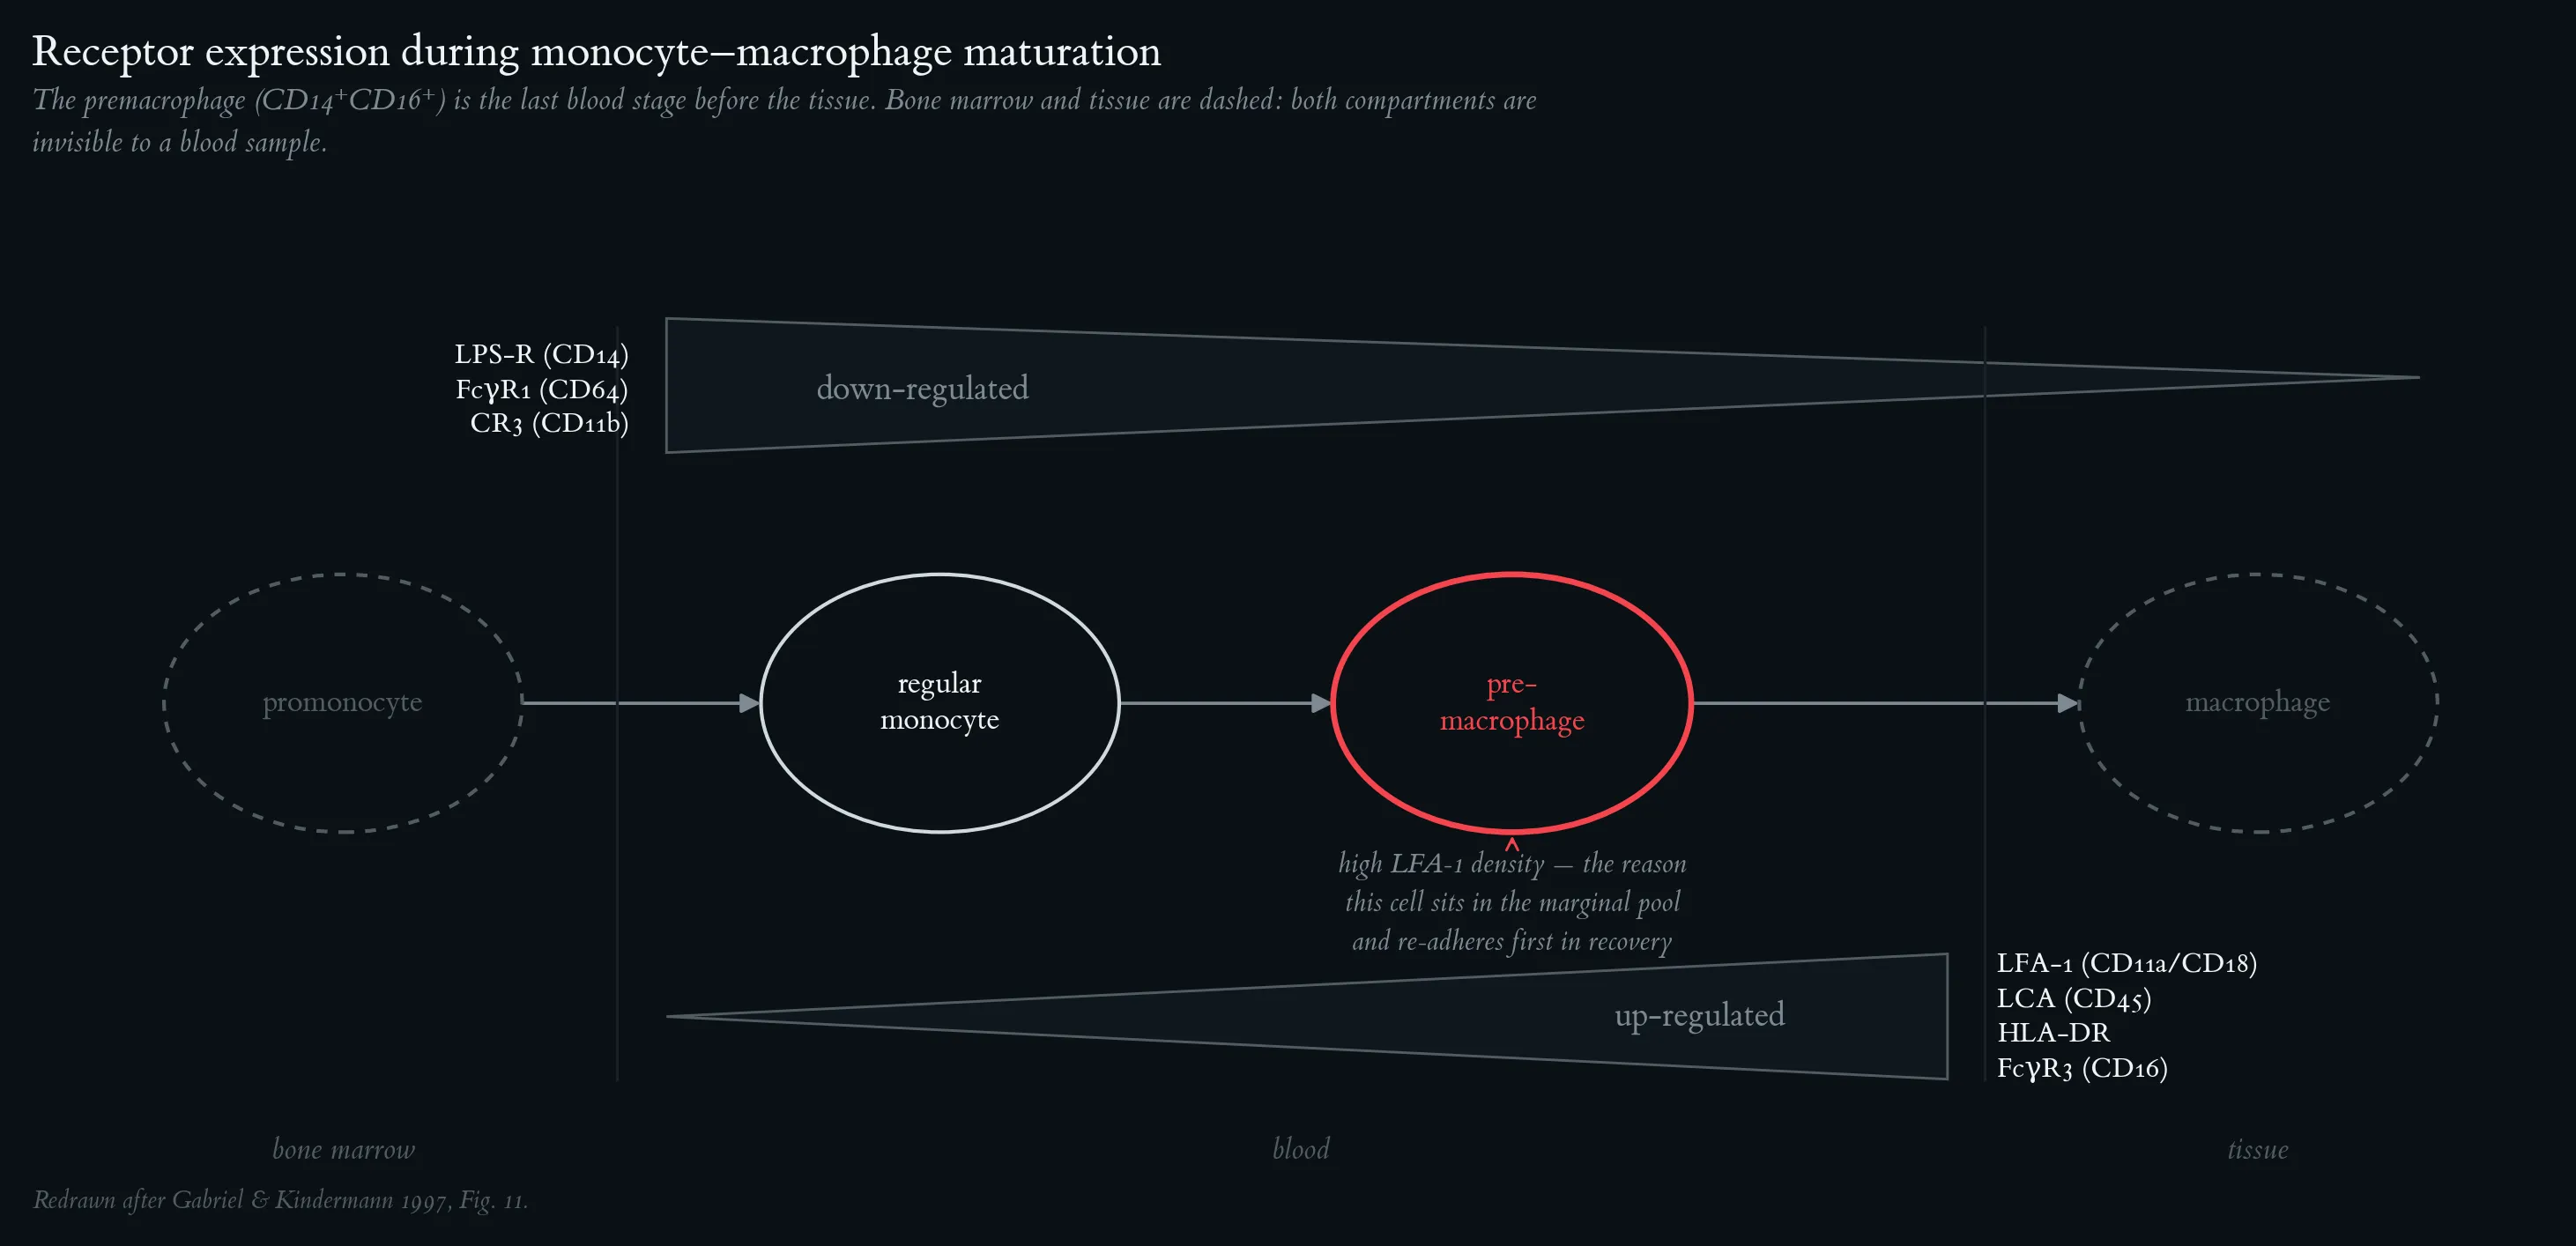
Schematic of cell-surface receptor expression along the monocyte–macrophage maturation axis. Cells mature from the promonocyte (bone marrow) through the regular monocyte (CD14⁺CD16⁻) and the premacrophage (CD14⁺CD16⁺) in blood to the tissue macrophage. LPS-R (CD14), FcγR1 (CD64) and CR3 (CD11b) are progressively downregulated; LFA-1 (CD11a/CD18), LCA (CD45), HLA-DR and FcγR3 (CD16) are progressively upregulated; wedge width indicates relative expression. Dashed circles mark the compartments not accessible to peripheral-blood sampling. The high LFA-1 density of the premacrophage accounts both for its residence in the marginal pool and for its rapid re-adhesion during recovery, and CD16 (FcγR3) is the marker that defines it. Redrawn after Gabriel & Kindermann 1997, Fig. 11.
One-Minute-Paper Topics
A One-Minute-Paper (OMP) is a short, focused prompt that students answer in ~60 seconds at the end of a session to consolidate learning, surface misconceptions, and provide formative feedback. When answering, be concise, specific, and use terminology from today’s session.
- Name the five hormonal mediators measured by Gabriel & Kindermann (1997) and match each to the exercise type (intensity/duration category) that most strongly stimulates it.
- Trace the catecholamine → β2-adrenergic receptor → LFA-1 → cell mobilisation pathway in your own words. Why do NK cells show the largest amplitude of exercise-induced fluctuation?
- Explain the ACTH–cortisol mechanism responsible for the delayed neutrophilia observed 1–2 h after exercise cessation, and why lymphopenia accompanies it.
- Why do CD45RA⁺ naïve T cells show smaller exercise-induced fluctuations than NK cells? What molecular property underlies this difference?
- In the diapedesis cascade, what role does LFA-1 avidity (vs. density) play in firm adhesion? How does β2-adrenergic stimulation acutely alter this avidity?
- After exercise, circulating CD14⁺CD16⁺ premacrophage counts drop below baseline. Using the LFA-1/ICAM cascade, explain this post-exercise dip despite persistently elevated catecholamines.
Key References
- Gabriel H., Kindermann W. The acute immune response to exercise: what does it mean? Int. J. Sports Med. 18 (Suppl 1): S28–S45, 1997.
- Gabriel H.H.W., Scharhag J., Rätz M., Kindermann W. Charakterisierung der sofortigen Leukozytose nach anaerober Belastung. Dtsch. Z. Sportmed. 54(10): 274–280, 2003.
- Urhausen A., Gabriel H., Kindermann W. Blood hormones as markers of training stress and overtraining. Sports Med. 20: 251–276, 1995.
3 Counts vs Function — Exercise is not Infection
Learning objectives:
- Exercise- vs infection-induced leukocytosis: identical counts, opposite meanings
- Monocyte maturation in infection against mobilisation of mature cells in exercise
- CRP and trace elements in the athlete: plasma-volume correction and interpretation
3.1 Similarities and differences between exercise- and infection-induced responses
A core message of Gabriel & Kindermann (1997) is that identical cell counts can carry opposite functional meanings. The comparison (Figs. 10, 12 and 13 of Gabriel & Kindermann 1997, §“Exercise- versus infection-induced leukocytosis”) is summarized below.
Neutrophil and monocyte responses: strenuous exercise versus bacterial URTI.
| Feature | Strenuous endurance exercise | Bacterial URTI (sinusitis, tonsillitis) |
|---|---|---|
| Neutrophil count | Markedly elevated | Comparable elevation |
| Spontaneous + fMLP-stimulated oxidative burst | Unchanged or reduced | Primed, significantly increased |
| Phagocytosis of opsonized FITC-E. coli | Unchanged or reduced | Grossly increased |
| Monocyte composition | Mainly regular CD14⁺CD16⁻ | Strong shift to mature CD14⁺CD16⁺ premacrophages (maturation response) |
| T-cell shift CD45RA → CD45RO | Small after long endurance exercise | Pronounced in infectious mononucleosis (CD8⁺CD45RO⁺CD8⁺HLA-DR⁺) |
| C-reactive protein (CRP) | Few mg·L⁻¹ range (typically) | 12–96 mg·L⁻¹ |
Neutrophil and monocyte responses: strenuous exercise versus bacterial URTI.
Interpretation. The neutrocytosis of infection reflects primed cells with enhanced defense capacity; the same numeric neutrocytosis after exercise reflects demargination with impaired or unchanged effector function. The infection induces a true maturation of monocytes toward premacrophages; exercise mostly mobilises already-existing mature cells from the marginal pool (Gabriel et al. 2003). Hence the often-quoted phrase: “The same cell count means something different.”
A clinically important corollary (Meyer et al. 2001): three of twelve subjects had CRP values 24 h after anaerobic interval training that approached or exceeded the 5 mg·L⁻¹ cut-off for acute infection. → When interpreting borderline CRP values in athletes, always take the training history of the last 24 h into account.
3.2 Oxidative burst
The oxidative burst — the NADPH-oxidase–driven generation of superoxide anions inside phagocytes — was measured by Gabriel & Kindermann (1997) through intracellular oxidation of the non-fluorescent dye dihydrorhodamine_123 to fluorescent rhodamine_123, quantified by flow cytometry (Rothe & Valet 1994).
Key observations (Fig. 10 of Gabriel & Kindermann 1997):
- After 60 min cycle ergometry at 100 % IAT in 8 trained athletes the oxidative burst (fMLP-stimulated) was significantly decreased compared with baseline.
- Phagocytotic activity of neutrophils was unchanged after the same bout.
- In bacterial URTI the same cell count of circulating neutrophils was associated with a higher spontaneous and stimulated oxidative burst and a grossly increased phagocytotic activity (Fig. 10B, C of Gabriel & Kindermann 1997).
- The exercise effect is most pronounced after long-duration / high-intensity exercise; with truly long endurance bouts (e.g. 100-km run, ultratriathlon) the burst impairment persists for hours to ~1 day.
A laboratory-bench observation underlying the APR interpretation: in vitro lactic acidosis induces an APR-like activation of the fMLP-induced oxidative burst in neutrophils (Meyer et al. 2001, personal communication of the authors). This connects sustained lactic acidosis (e.g. anaerobic interval training, see §4.1) to the cellular APR.
3.3 Acute effect of exercise on biomarkers and trace elements
Simon et al. (2026) — sit-to-stand test, n = 20, lactate 0.68 → 5.6 mmol·L⁻¹, HR 67 → 138 bpm — measured both immune-cell biomarkers and the trace elements selenium, zinc, copper, and iron at rest, 0 min post, 30 min and 60 min post.
Cellular biomarkers (Table 3 of Simon et al. 2026; ×10⁹·L⁻¹; pre / 0 min / 30 min / 60 min):
- WBC: 5.7 → 8.2 → 5.3 → 5.5
- Granulocytes: 3.3 → 4.0 → 3.0 → 3.3
- Lymphocytes: 2.1 → 3.6 → 1.7 → 1.8 (note the fall below baseline in recovery)
- NLR (neutrophil/lymphocyte ratio): 1.7 → 1.2 → 1.9 → 1.9
- SII (systemic immune-inflammation index): falls during peak lymphocytosis, then rises above baseline
- SIRI (systemic inflammation response index): rises continuously, peak at 60 min post
The kinetics confirm the pattern of Gabriel & Kindermann (1997) and Gabriel et al. (2003): catecholamine-driven early lymphocytosis with low NLR, followed by cortisol- and apoptosis-driven lymphopenia + late neutrophilia → high NLR.
Trace elements. Plasma volume fell ~10 % immediately post and normalised within 30 min, so values must be plasma-volume corrected to read true biology (Simon et al. 2026):
Serum trace-element kinetics after exercise.
| Parameter | Pre | 0 min post | 30 min | 60 min | Direction (adjusted) |
|---|---|---|---|---|---|
| Selenium (µg·L⁻¹) | 48.8 | 45.8 | 49.4 | 49.1 | ↓ post, normalises |
| SELENOP (mg·L⁻¹) | 4.0 | 3.5 | 4.0 | 4.2 | ↓ post, ↑ at 60 min |
| Zinc total (µg·L⁻¹) | 670 | 661 | 698 | 680 | No net change |
| Free Zn (µg·L⁻¹) | 0.047 | 0.052 | 0.049 | 0.046 | Transient ↑ at 0 min |
| Copper (µg·L⁻¹) | 728 | 687 | 758 | 736 | ↓ post, ↑ at 30 min |
| Iron (µg·L⁻¹) | 1287 | 1650 | 1504 | 1733 | ↑ post, sustained ↑ |
Serum trace-element kinetics after exercise.
Mechanistic interpretation (Simon et al. 2026, Discussion):
- Zinc. Total serum zinc is buffered. Free zinc rises transiently, plausibly because acidosis and free fatty acids reduce zinc binding to albumin. Inflammatory zinc redistribution to the liver (IL-6 → ZIP14 up-regulation) and incorporation into metallothionein during the APR opposes the muscle-derived release (lactate dehydrogenase, hemolysis) → net little change after this short, low-volume bout.
- Selenium / SELENOP. Falls immediately after exercise → shift toward tissues with high oxidative-stress load (muscle); the small but significant rise of SELENOP at 60 min plausibly reflects hepatic up-regulation triggered by oxidative stress signalling. GPX3 activity has been shown to rise ~33 % after aerobic exercise.
- Copper. Transient redistribution to skeletal muscle and immune cells for incorporation into antioxidant enzymes (Cu/Zn-SOD). SOD activity in human skeletal muscle stays elevated for up to three days after a single bout.
- Iron. Rises post-exercise (exercise-induced hemolysis from mechanical stress, repeated contractions and vasoconstriction; ROS-mediated release from ferritin). Hepcidin peaks ~ 3 h post-exercise → iron then drops back to baseline.
Why measure these? Trace-element status influences immune cell function: zinc supports chemotaxis, phagocytosis, monocyte/macrophage development and T- and B-cell function; selenium supports T-, B- and NK-cell proliferation; copper modulates T cells and granulocyte function; iron is required for proliferation/differentiation/activation of immune cells and for ROS generation via the Fenton reaction (Simon et al. 2026, Introduction). Acute exercise therefore not only redistributes immune cells but also redistributes the micronutrients that maintain their effector capacity — a missing piece in the classical exercise-immunology picture.
3.4 Figures
Neutrophil count, oxidative burst and phagocytotic activity after exercise and during bacterial infection. (A) neutrophil cell counts; (B) fMLP-stimulated (0.1 µM) oxidative burst, measured as the percentage of rhodamine-123-positive neutrophils; (C) phagocytotic activity, measured as intracellular FITC-conjugated E. coli fluorescence. Open bars: 8 athletes cycling 60 min at 100 % of the individual anaerobic threshold, sampled before, 2 h and 1 day post-exercise. Filled bars: 8 patients (18–32 yr) with bacterial upper-respiratory-tract infection — sinusitis, angina tonsillaris, tonsillitis — sampled before and 2 and 10 days after symptom onset. Means and SD; † p < 0.01 vs. the corresponding value before exercise or before infection (two-tailed t-test for dependent variables). Exercise and infection produce comparable neutrocytosis (A) but opposite functional profiles: burst is unchanged or reduced after exercise and strongly primed in infection (B), and phagocytosis is unchanged after exercise but grossly increased in infection (C). Redrawn after Gabriel & Kindermann 1997, Fig. 10.
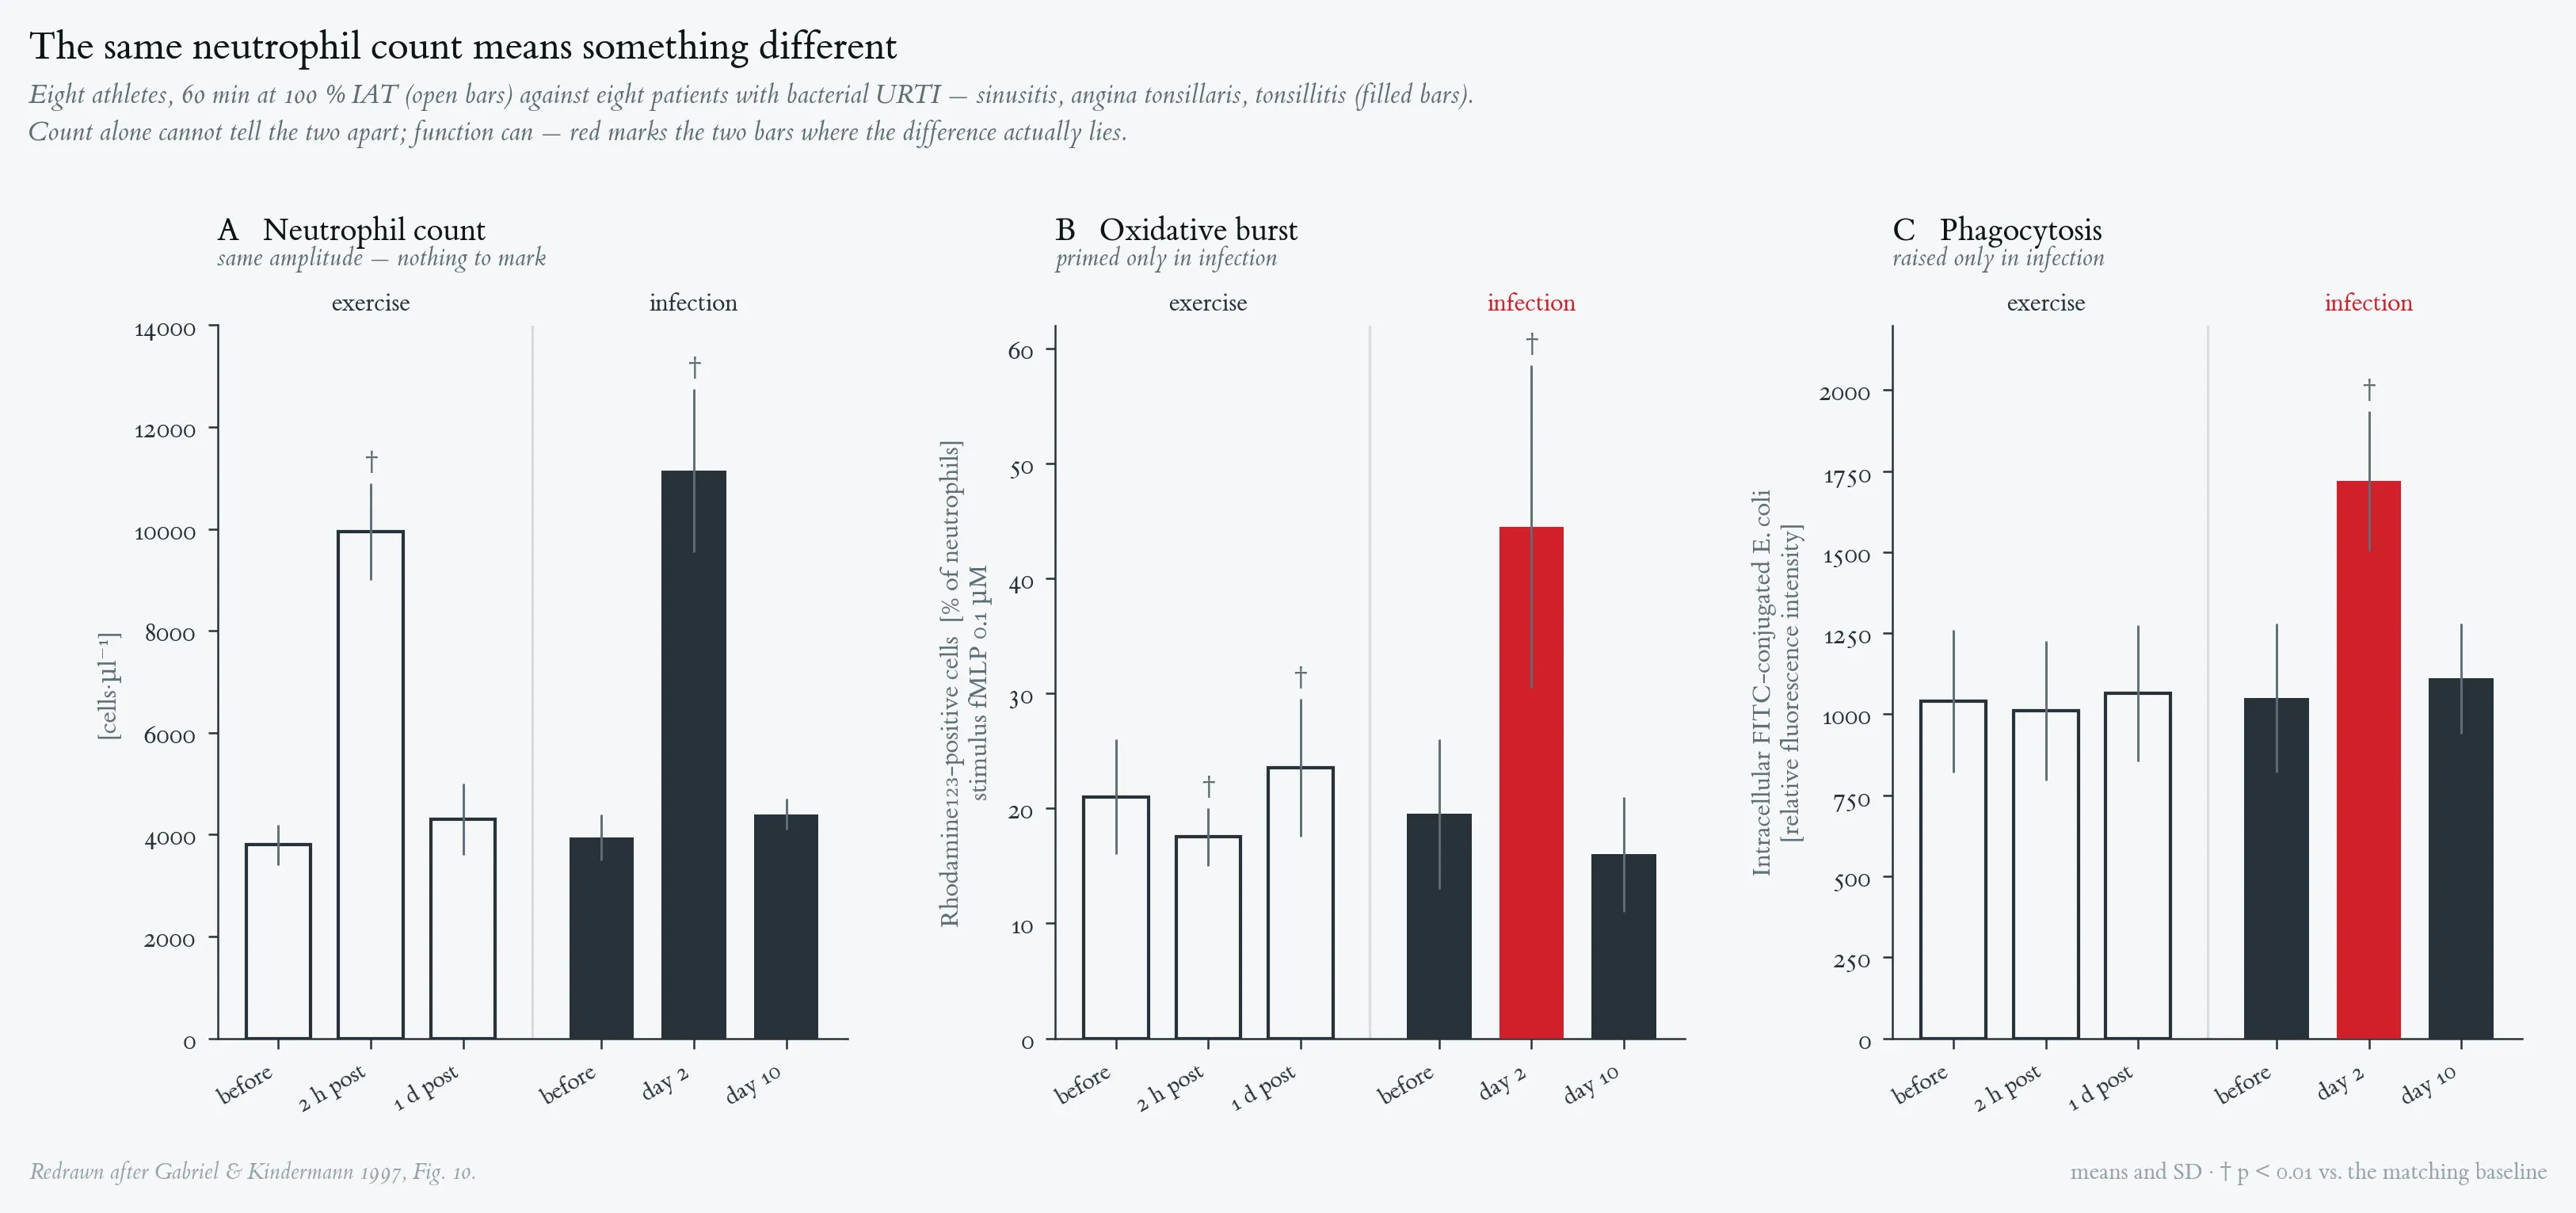
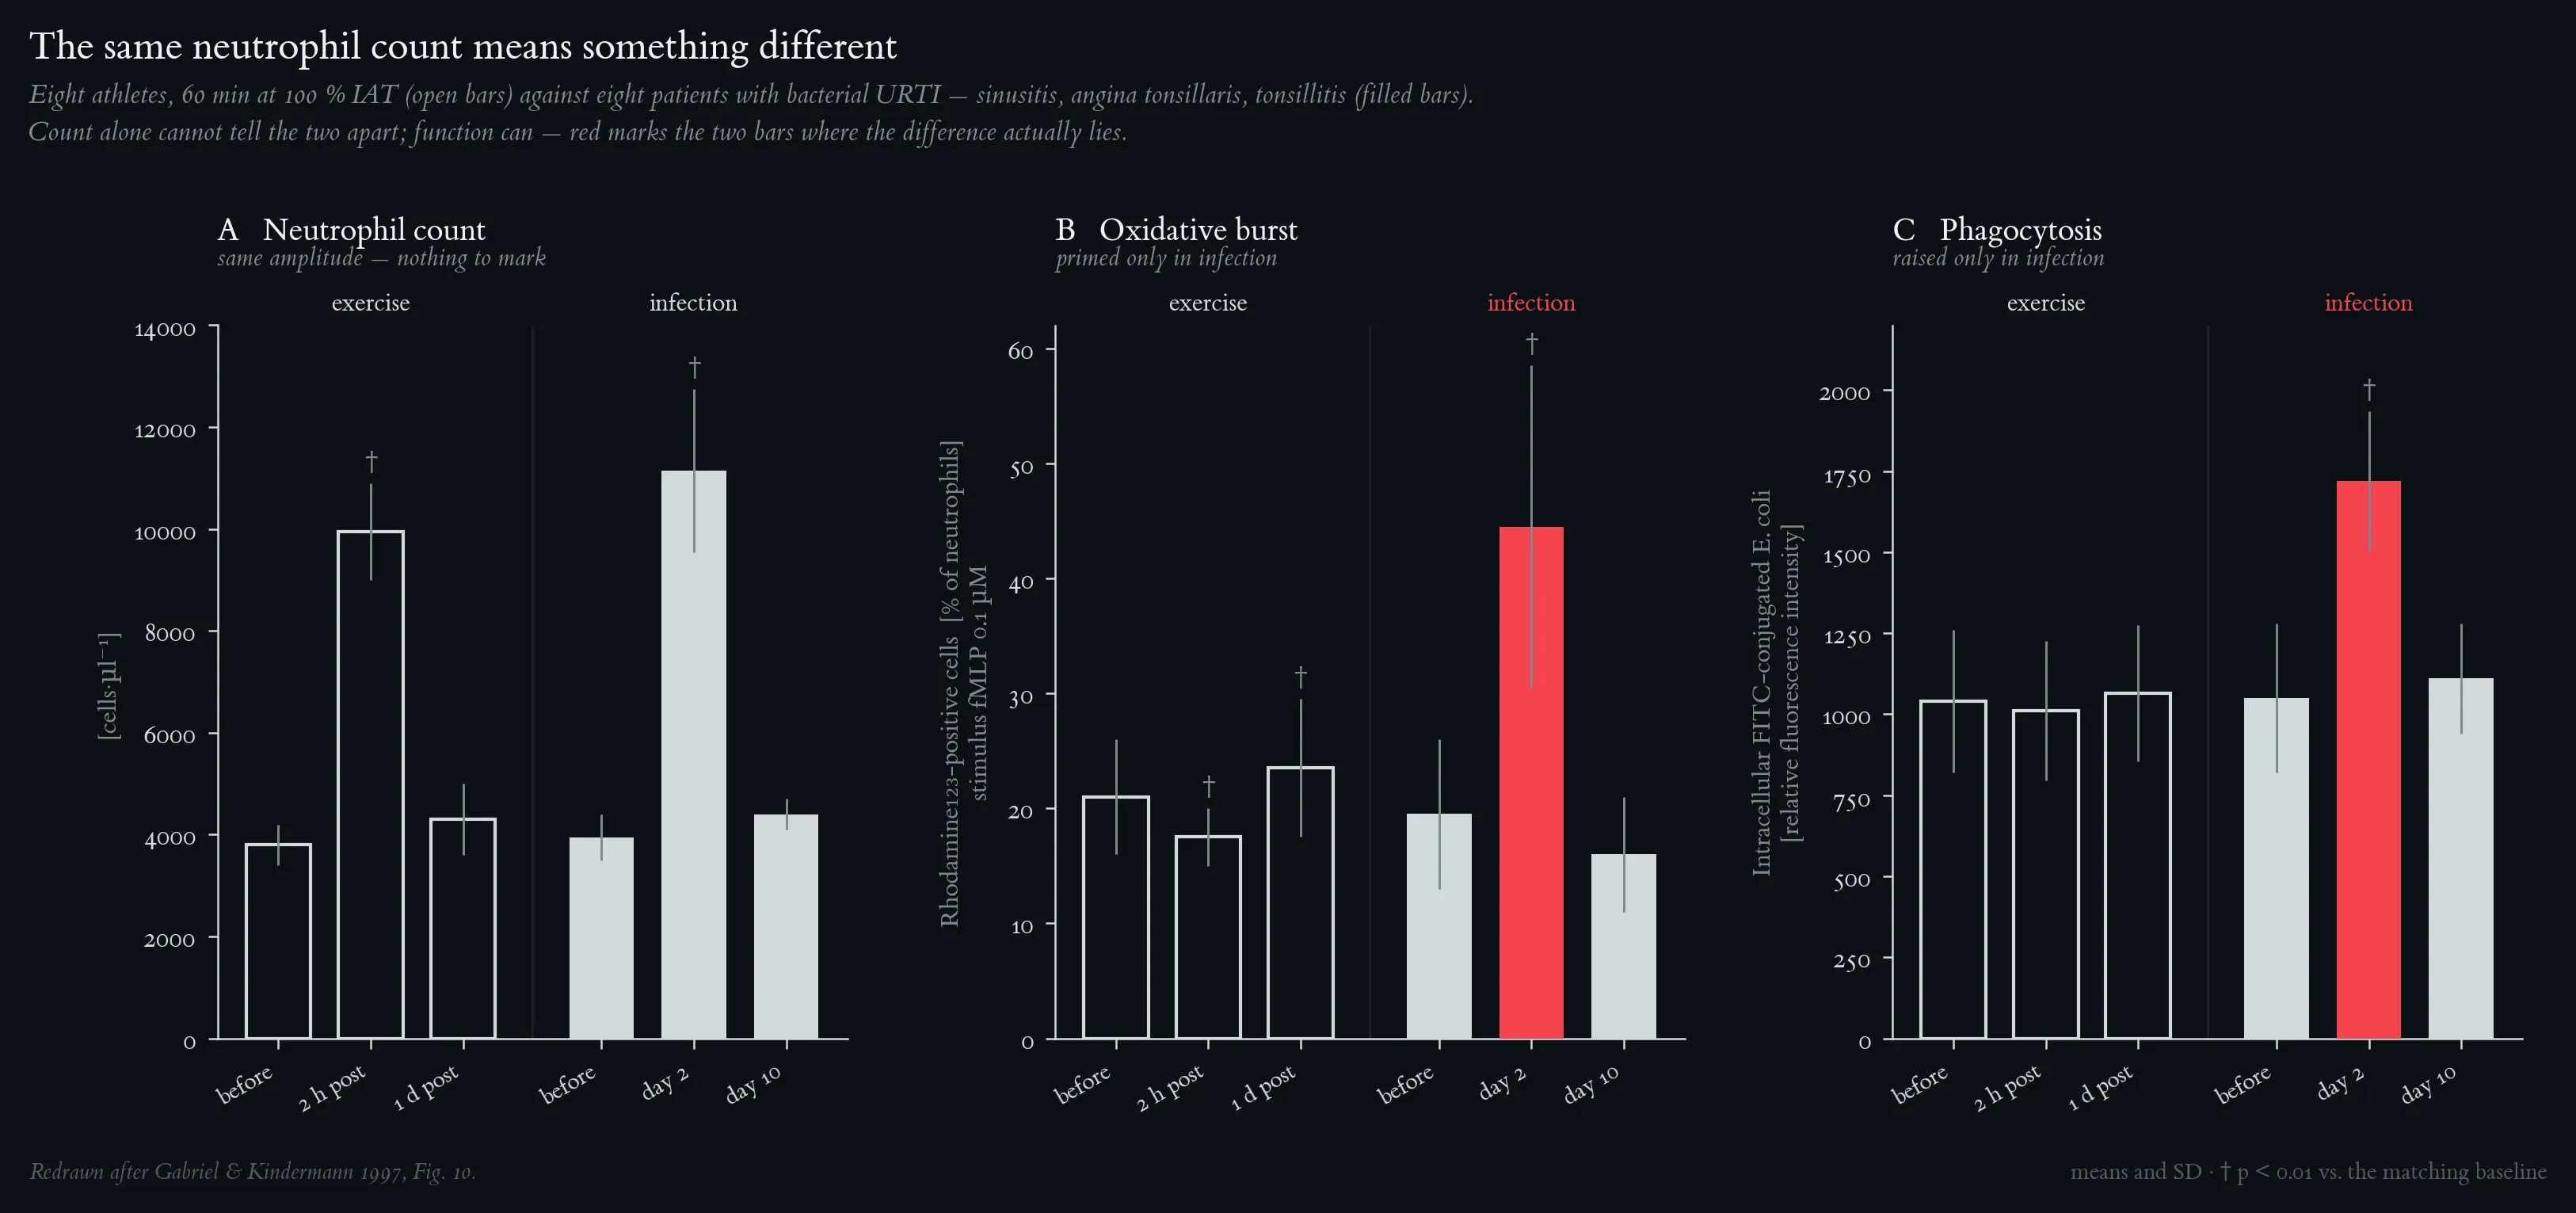
Neutrophil count, oxidative burst and phagocytotic activity after exercise and during bacterial infection. (A) neutrophil cell counts; (B) fMLP-stimulated (0.1 µM) oxidative burst, measured as the percentage of rhodamine-123-positive neutrophils; (C) phagocytotic activity, measured as intracellular FITC-conjugated E. coli fluorescence. Open bars: 8 athletes cycling 60 min at 100 % of the individual anaerobic threshold, sampled before, 2 h and 1 day post-exercise. Filled bars: 8 patients (18–32 yr) with bacterial upper-respiratory-tract infection — sinusitis, angina tonsillaris, tonsillitis — sampled before and 2 and 10 days after symptom onset. Means and SD; † p < 0.01 vs. the corresponding value before exercise or before infection (two-tailed t-test for dependent variables). Exercise and infection produce comparable neutrocytosis (A) but opposite functional profiles: burst is unchanged or reduced after exercise and strongly primed in infection (B), and phagocytosis is unchanged after exercise but grossly increased in infection (C). Redrawn after Gabriel & Kindermann 1997, Fig. 10.
One-Minute-Paper Topics
A One-Minute-Paper (OMP) is a short, focused prompt that students answer in ~60 seconds at the end of a session to consolidate learning, surface misconceptions, and provide formative feedback. When answering, be concise, specific, and use terminology from today’s session.
- Complete the sentence: “The same cell count means something different.” What specifically differs between exercise-induced and infection-induced neutrocytosis in terms of effector function?
- How does the fMLP-stimulated oxidative burst of circulating neutrophils change after 60 min at 100 % IAT, and how does this compare to the oxidative burst during bacterial URTI?
- Simon et al. (2026) measured a fall in SELENOP immediately post-exercise followed by a rise at 60 min. Propose a mechanistic explanation for both the fall and the subsequent rise.
- Iron rose and stayed elevated after the sit-to-stand test in Simon et al. (2026). What two mechanisms were proposed to explain this post-exercise iron release, and what brings iron back to baseline by ≈ 3 h?
Key References
- Gabriel H., Kindermann W. The acute immune response to exercise: what does it mean? Int. J. Sports Med. 18 (Suppl 1): S28–S45, 1997.
- Meyer T., Gabriel H.H.W., Rätz M., Müller H.J., Kindermann W. Anaerobic exercise induces moderate acute phase response. Med. Sci. Sports Exerc. 33(4): 549–555, 2001.
- Rothe G., Valet G. Flow cytometric assays of oxidative burst activity in phagocytes. Methods Enzymol. 233: 539–548, 1994.
- Simon R., Röhr W., Schwarz M., Haase H., Puta C., Kipp A.P. Acute effects of physical exercise on biomarkers of the trace elements selenium, zinc, copper, and iron. J. Trace Elem. Med. Biol. 94: 127828, 2026.
4 From Single Bout to Overtraining: the Acute Phase Response
Learning objectives:
- Criteria of an acute phase response and the training protocols that meet them
- The time-integral of lactic acidosis as the decisive variable, and the ≥ 24 h inflammatory window
- Why routine screening labs cannot detect overtraining
4.1 Why and when an anaerobic training session induces an acute phase response
The classical APR is the systemic response to severe tissue injury or infection, characterised by IL-1/IL-6/TNF release → hepatic acute phase proteins (CRP, fibrinogen, ferritin, ↓ albumin) and a cellular response that includes monocyte activation/maturation, neutrocytosis, and a fall in serum trace elements (zinc, iron, see §3.3).
A single short anaerobic bout (e.g. SMT, 60 s all-out) is sufficient to mobilise cells from the marginal pool and to generate a transient stress-hormone rise — but it does not clearly fulfil APR criteria: no significant IL-6 rise, no CRP rise at 24 h (Fig. 6 of Meyer et al. 2001).
A repeated anaerobic interval session (e.g. AN-TS = 1 × 60 s + 8 × 10 s all-out with 5 min recovery) does satisfy the APR criteria (Meyer et al. 2001):
- Sustained lactic acidosis: lactate 13–14.5 mmol·L⁻¹ for > 60 min, pH 7.17 ± 0.07 at 6 min post.
- IL-6 elevated 6-fold at 15 min post-exercise (P < 0.01 vs SMT and Co-day), still elevated at 2 h.
- Cortisol ≈ 3.5 × Co-day at 15 min post.
- Neutrocytosis at 2 h post (P = 0.003 vs SMT).
- CRP 24 h post-exercise significantly elevated (P = 0.02), reaching the 5 mg·L⁻¹ clinical cut-off in three of twelve subjects.
- IL-8 unchanged — indicating limited systemic spill-over of locally produced chemokines.
4.1.1 Direct comparison: single 60-s all-out (SMT) vs 60-s + 8 × 10-s repeated anaerobic bouts (AN-TS)
Both training stimuli reached a comparable absolute metabolic peak (max lactate ≈ 14 mmol·L⁻¹, blood pH minimum ≈ 7.16–7.17, plasma volume contraction 13–15 %). What differs is the duration of the lactic acidosis and the cumulative endocrine load — and the immune system reads exactly this difference. The side-by-side picture from Meyer et al. (2001) is:
Immunoendocrine response to single-bout versus interval anaerobic exercise.
| Parameter (12 unspecifically trained men) | SMT (1 × 60 s) | AN-TS (1 × 60 s + 8 × 10 s) |
|---|---|---|
| Duration with lactate > 10 mmol·L⁻¹ | ~ 15 min (steep decline) | > 60 min (sustained acidosis) |
| Cortisol at 15 min post | Slight ↑ (P = 0.002 vs Co-day, NS vs rest) | ≈ 3.5 × Co-day (P = 0.002), > resting (P = 0.003) |
| IL-6 at 15 min post | Slight ↑ (P = 0.003 vs Co-day) | ≈ 6 × resting (P = 0.002 vs SMT) |
| IL-6 at 2 h post | Returned to baseline | Still elevated (P = 0.004 vs Co-day) |
| Neutrophils at 2 h post | Moderate neutrophilia (≈ 4 400 µL⁻¹) | Pronounced neutrophilia (≈ 9 500 µL⁻¹) (P = 0.003 vs SMT) |
| CD16⁺ premacrophages: peak timing | 15 min post (P = 0.004 vs rest, P = 0.003 vs Co-day/AN-TS) | 2 h post (P = 0.019 vs Co-day) — delayed appearance |
| Presumed source of CD16⁺ cells | Marginal pool (rapid demargination) | “Real” monocyte activation or bone-marrow recruitment — cannot be explained by catecholamines alone (short half-life) and not by cortisol (which usually decreases CD16⁺), so a stronger override is required |
| IL-8 | Unchanged | Unchanged |
| CRP at 24 h post | No significant rise | Significant rise (P = 0.02 vs Co-day); 3/12 subjects approached or exceeded 5 mg·L⁻¹ |
| Correlation CRP (24 h) ↔ IL-6 (15 min) | Not significant | r = 0.79, P < 0.01 |
Immunoendocrine response to single-bout versus interval anaerobic exercise.
The qualitative consequence is that the two protocols look almost identical at the level of single-time-point lactate or pH, yet they leave a completely different immunological footprint. SMT triggers a transient demargination of premacrophages plus a small, late neutrophilia — pattern of a stress response. AN-TS, by adding only ≈ 80 s of additional all-out work spread over 40 min, converts the same stimulus into a full monocyte-activation / IL-6 / CRP cascade lasting at least 24 h — pattern of a low-grade acute phase response. The key variable is therefore not maximal lactate but the time-integral of lactic acidosis (and of cortisol/catecholamines), which in AN-TS is several-fold larger than in SMT.
The mechanistic explanation that ties these observations together:
- Long-duration lactic acidosis (not just the absolute pH minimum) is the key stimulus. In vitro, lactic acidosis triggers an APR-like activation of phagocytes (Meyer et al. 2001).
- Cumulative catecholamine and cortisol secretion is greater after repeated than after single bouts.
- Monocytes that have been mobilised and activated then secrete IL-6, which drives hepatic CRP synthesis 24 h later. CRP at 24 h correlates strongly with IL-6 at 15 min in the AN-TS condition (r = 0.79, P < 0.01) but not in the SMT.
Clinical / training implications and link to overtraining. Anaerobic interval training that produces lactate > 10 mmol·L⁻¹ for > 1 h induces signs of inflammation detectable for at least 24 h — the same window in which an athlete is expected to recover and to train again. Meyer et al. (2001) explicitly framed this in terms of overtraining: (i) periods of intense training are known to precede increased susceptibility to infections, and a chronically activated immune system has been proposed as one of the responsible mechanisms; (ii) the appearance of overtraining / overstrain (staleness) is closely coupled to incompletely cured infections; (iii) the immune system and the autonomic nervous system are tightly linked, and a chronically or too frequently activated sympathetic system can lead to changes of immune function and, consequently, to overtraining (Urhausen et al. 1995; Gabriel & Kindermann 1997). The AN-TS protocol is therefore a model for one specific way in which repetitive immune stimulation by anaerobic training may act as a triggering mechanism for a reactive down-regulation of immune defence functions: each session leaves a CRP-/IL-6-/cortisol-positive trace lasting ≥ 24 h, so two such sessions per week with ≤ 24–48 h recovery cause partially superimposed APR episodes. Practical recommendations that follow directly from Meyer et al. (2001): (a) limit AN-TS-type interval sessions to a frequency at which the immune system can fully reset between bouts (typically not more than 1–2 × per week in unspecifically trained subjects, with > 48 h recovery); (b) avoid scheduling strenuous training within 24 h of an AN-TS-type session; (c) when interpreting borderline CRP values in athletes (≈ 5 mg·L⁻¹), take the training history of the past 24 h into account before suspecting infection.
4.1.2 Counterpoint from a 19-month longitudinal study — does overtraining actually depress peripheral immunophenotypes?
Gabriel et al. (1998) tested exactly this question in a prospective longitudinal design that is still one of the few of its kind. Fifteen endurance athletes (12 cyclists, 3 triathletes; V̇O₂max 61.2 ± 7.5 mL·min⁻¹·kg⁻¹) were studied approximately every 3–5 months over 19 ± 3 months — 85 examinations in total. In 15 of those examinations a formally diagnosed overtraining syndrome (OT) was captured; 70 represented normal status (NS). OT was, in most cases, experimentally induced by raising high-intensity training to ≈ 4.5 h·wk⁻¹ (vs ≈ 1.5 h·wk⁻¹ in NS) while keeping total weekly volume unchanged — exactly the pattern that AN-TS-type sessions of §4.1.1 represent on a single-session level. Performance criteria confirmed the diagnosis: time to exhaustion in a stress test at 110 % of the maximum lactate steady state fell by 27 % (16 ± 6 vs 23 ± 10 min, P < 0.01), and maximum lactate in the incremental test fell by ≈ 18 % (7.5 ± 2.7 vs 9.1 ± 2.4 mmol·L⁻¹, P < 0.01). The immunological result is a deliberate counter-balance to the AN-TS narrative: resting and post-stress-test counts of leukocytes, neutrophils, monocytes, B cells, total T cells, T-helper/inducer, T-suppressor/cytotoxic and NK cells did not differ between NS and OT (Table 1 of Gabriel et al. 1998), and the exercise-induced mobilisation pattern of every subpopulation was preserved. Eosinophils were modestly lower in OT (211 ± 176 vs 278 ± 176 µL⁻¹, P < 0.001), and the only consistent T-cell signal was a fine upregulation of activation status: activated CD3⁺HLA-DR⁺ T cells rose from 5.5 ± 2.7 to 7.3 ± 2.4 % of CD3⁺ cells (P < 0.01), and the mean fluorescence intensity of CD45RO on CD4⁺ and CD8⁺ T cells was significantly higher during OT (P < 0.001) — although the absolute count of CD45RO⁺ memory T cells was unchanged. Compared with the dramatic CD45RO⁺/HLA-DR⁺/CD8⁺ activation seen in infectious mononucleosis, this signal is small and was explicitly interpreted as a fine upregulation of T-cell function rather than pathological activation or clinically relevant immunosuppression. Five of fifteen OT athletes (33 %) reported URTI symptoms in the four weeks before the investigation, but no severe infections occurred in the final two weeks before testing — so the popular “open window” of clinically relevant URTI susceptibility could not be confirmed at the cellular level in this cohort.
Synthesis of §4 / §4.1.1 / §4.1.2. The three findings are complementary, not contradictory. §4.1.1 describes an acute immune footprint (CRP, IL-6, cortisol, neutrocytosis, CD16⁺ monocyte activation) that lasts ≥ 24 h after a single AN-TS-type session. §4.1.2 describes the steady-state peripheral picture after weeks of stacked high-intensity training: cell numbers and acute mobilisation capacity are preserved, but a subtle T-cell activation signature emerges that, when fed into a flow-cytometric self-learning classifier based on CD45RO MFI on CD4⁺/CD8⁺ T cells, distinguishes NS from OT with sensitivity ≈ 93 % and specificity ≈ 92 % (prospective predictive values 77 % / 86 %; Table 3 of Gabriel et al. 1998). Three practical conclusions follow: (i) routine screening labs — CBC, CD4/CD8 ratio, total leukocyte count, plasma glutamine — will not detect overtraining, and a normal differential does not rule it out; (ii) OT is not a gross immunosuppression: the more accurate working model is one of chronic, low-grade immune over-stimulation with intact trafficking and a fine T-cell-receptor-density signature; (iii) peripheral blood is a window, not a balance sheet — Gabriel et al. (1998) itself notes that “immunophenotypes of leukocytes derived from peripheral blood provide only limited information about the actual balance of the immune system of the whole organism”, because activated cells may preferentially migrate to tissues via the LFA-1/ICAM cascade of §2.3. This is one of the main reasons why a stronger biomarker panel — combining cells, cytokines, hormones and trace elements (§3.3) — is required before laboratory diagnosis of OT can become routine clinical practice.
4.2 Summary — what does the acute immune response to exercise mean?
- The acute exercise leukocytosis is biphasic: an immediate wave (during exercise + first minutes post) driven by hemodynamics + catecholamines via β2-adrenergic receptors, and a delayed wave (1–24 h) driven by the ACTH-cortisol axis and IL-6.
- Counts ≠ function. A leukocytosis identical in numbers to that of a bacterial URTI carries opposite functional meanings: in infection neutrophils are primed and monocytes mature; in exercise burst and phagocytosis are unchanged or reduced and monocytes are mostly demarginated regular cells.
- Intensity vs duration. Mature monocytes/premacrophages, NK cells and catecholamines respond mainly to intensity (anaerobic, > IAT). Neutrophils, ACTH, cortisol, regular monocytes respond mainly to duration (long endurance).
- A single anaerobic bout is not enough for an APR. Repeated short anaerobic bouts generating sustained lactic acidosis are — IL-6 ↑, cortisol ↑, neutrocytosis at 2 h, CRP ↑ at 24 h. This has direct implications for training programming and for interpreting CRP values in athletes.
- Trace-element redistribution (Zn, Se, Cu, Fe) accompanies the cellular APR and is one of the bridges between exercise-induced inflammation and immune-cell function.
- The whole picture is held together by diapedesis: the LFA-1/ICAM cascade is the final common pathway of every effect described above, and β2-adrenergic regulation of LFA-1 avidity is the molecular hinge linking hormones, hemodynamics, and the post-exercise reshuffling of immune cells.
4.3 Figures
NK-cell counts (CD3⁻CD16/CD56⁺) before, during and after a standardised stress test, in normal status versus overtraining. Fifteen endurance athletes (12 cyclists, 3 triathletes; V̇O₂max 61.2 ± 7.5 mL·min⁻¹·kg⁻¹) were examined approximately every 3–5 months over 19 ± 3 months, yielding 85 examinations: 70 in normal status (NS, open bars) and 15 with a diagnosed overtraining syndrome (OT, filled bars). Blood was drawn before, at the 10th minute of, at the end of, and 60 min after a stress test at 110 % of the maximum lactate steady state. Means and SD; ++ p < 0.01 vs. before exercise within group; no between-group difference reached significance at any time point (significance level 2.5 %). Both the amplitude and the shape of NK-cell mobilisation are fully preserved during overtraining. Redrawn after Gabriel et al. 1998, Fig. 3.
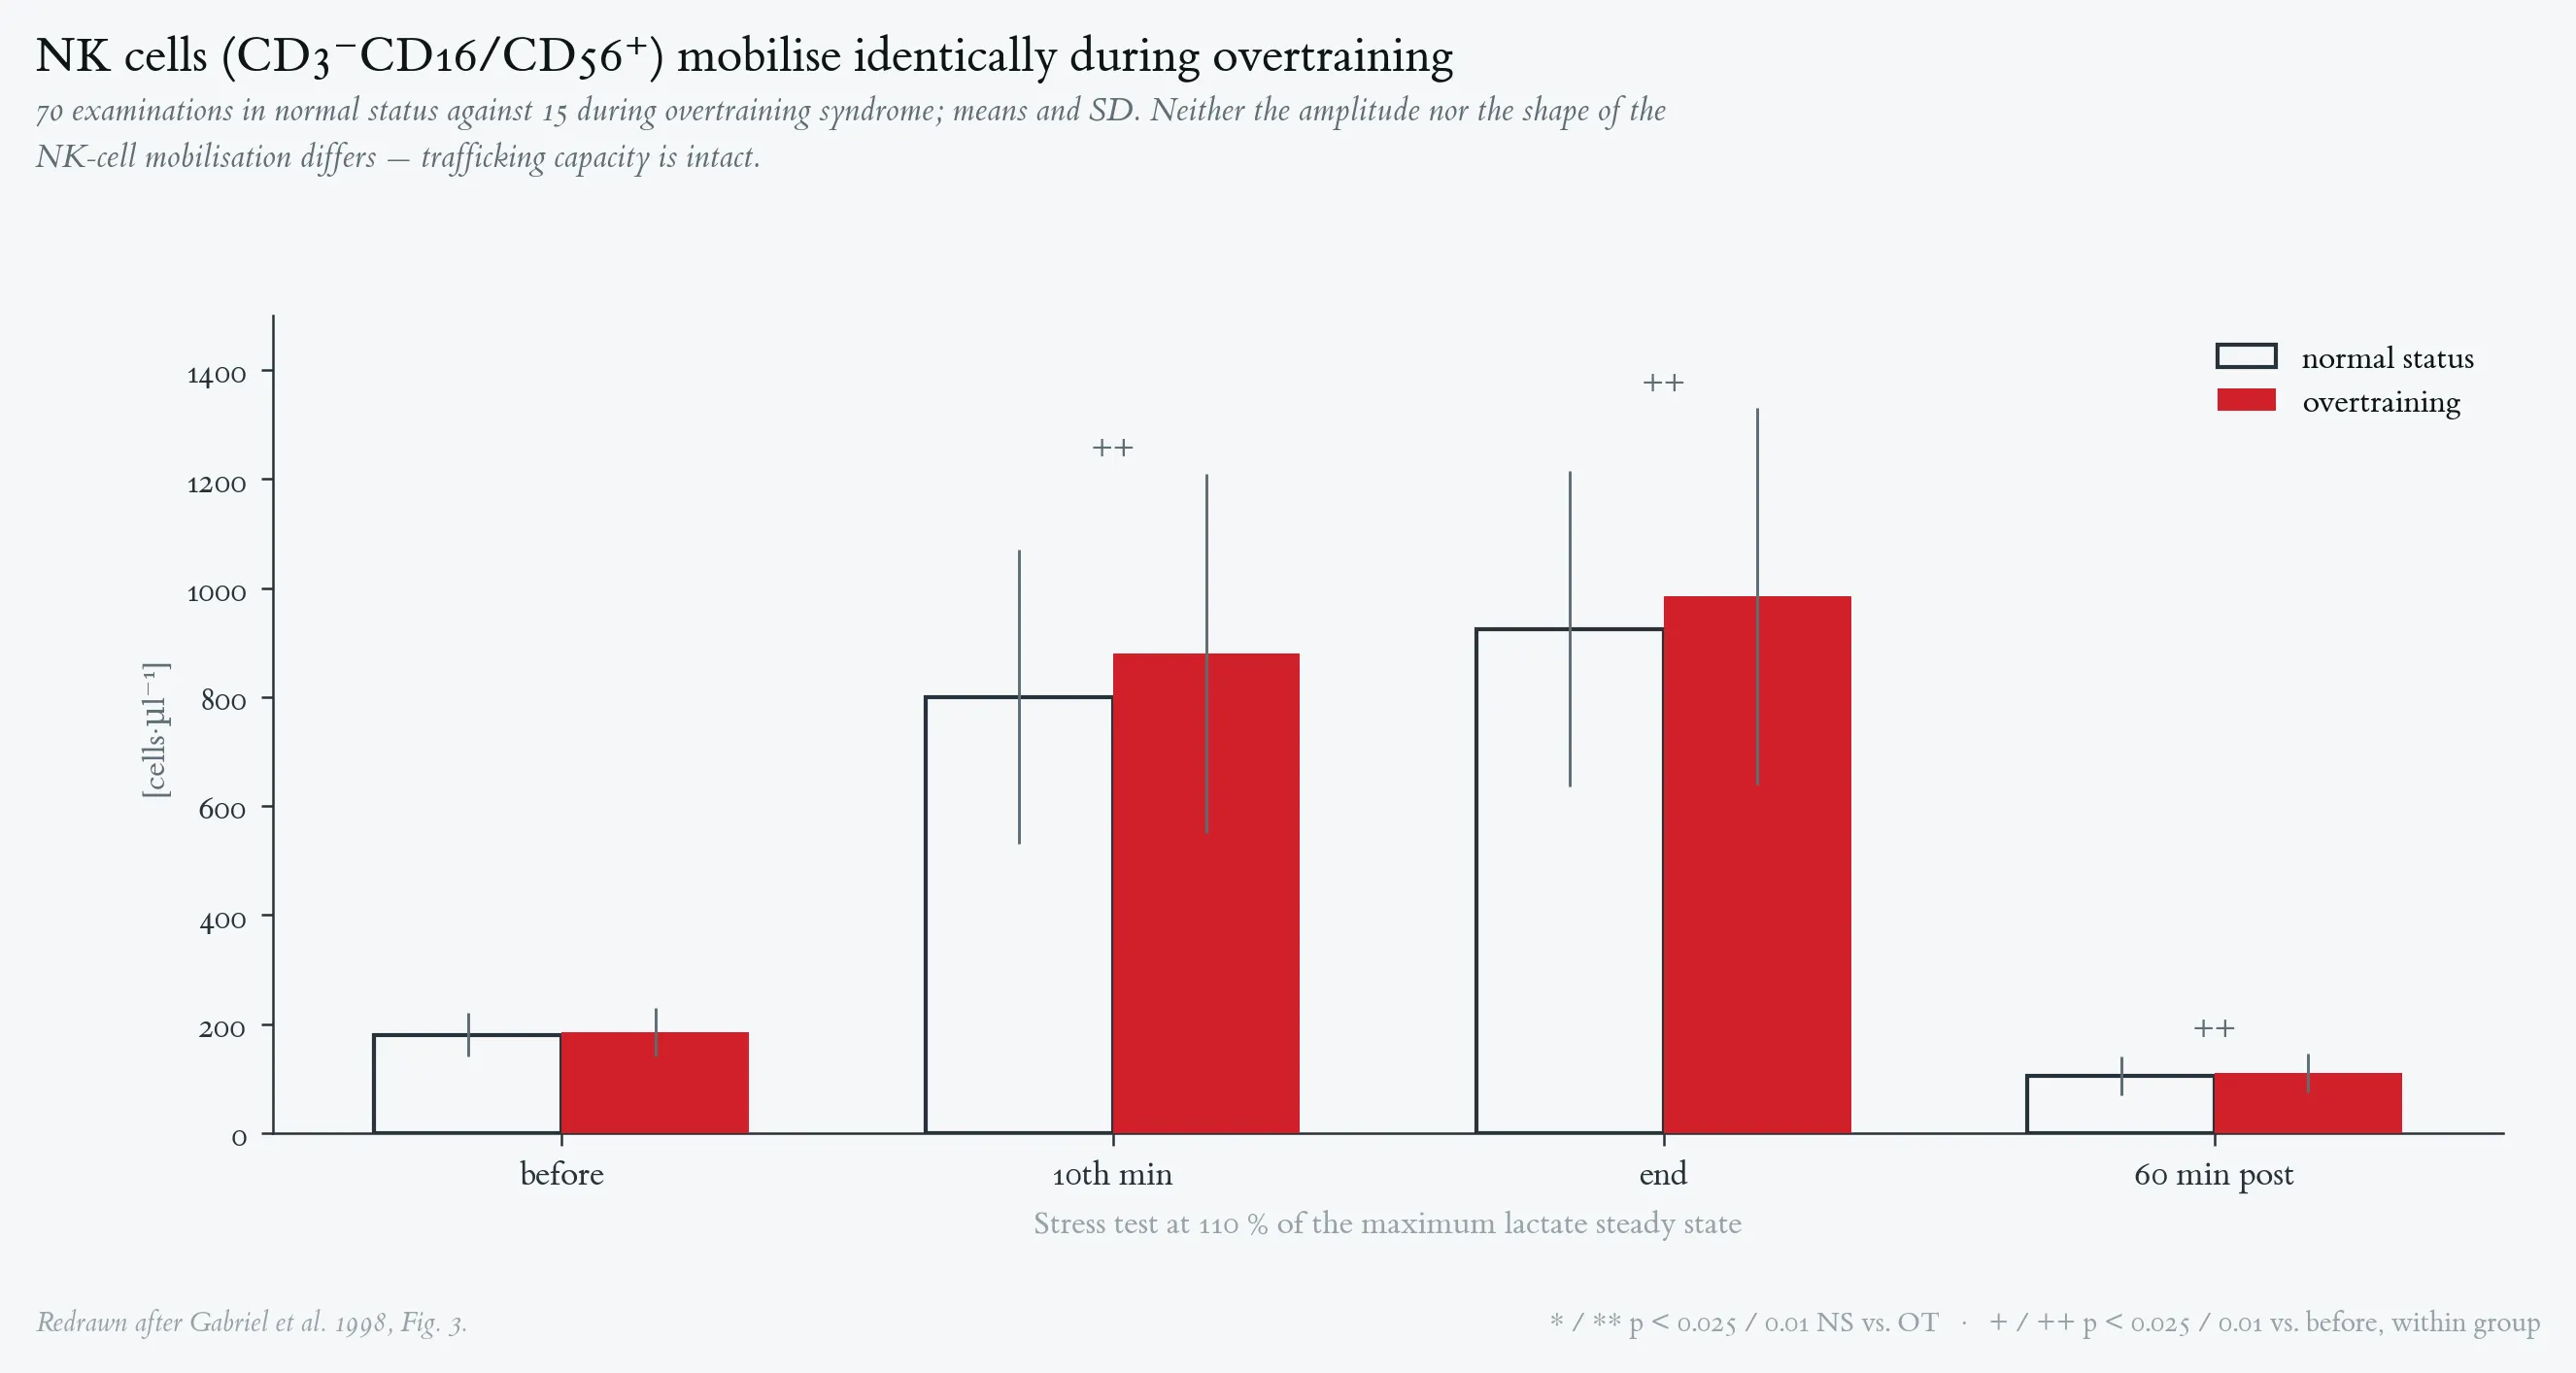
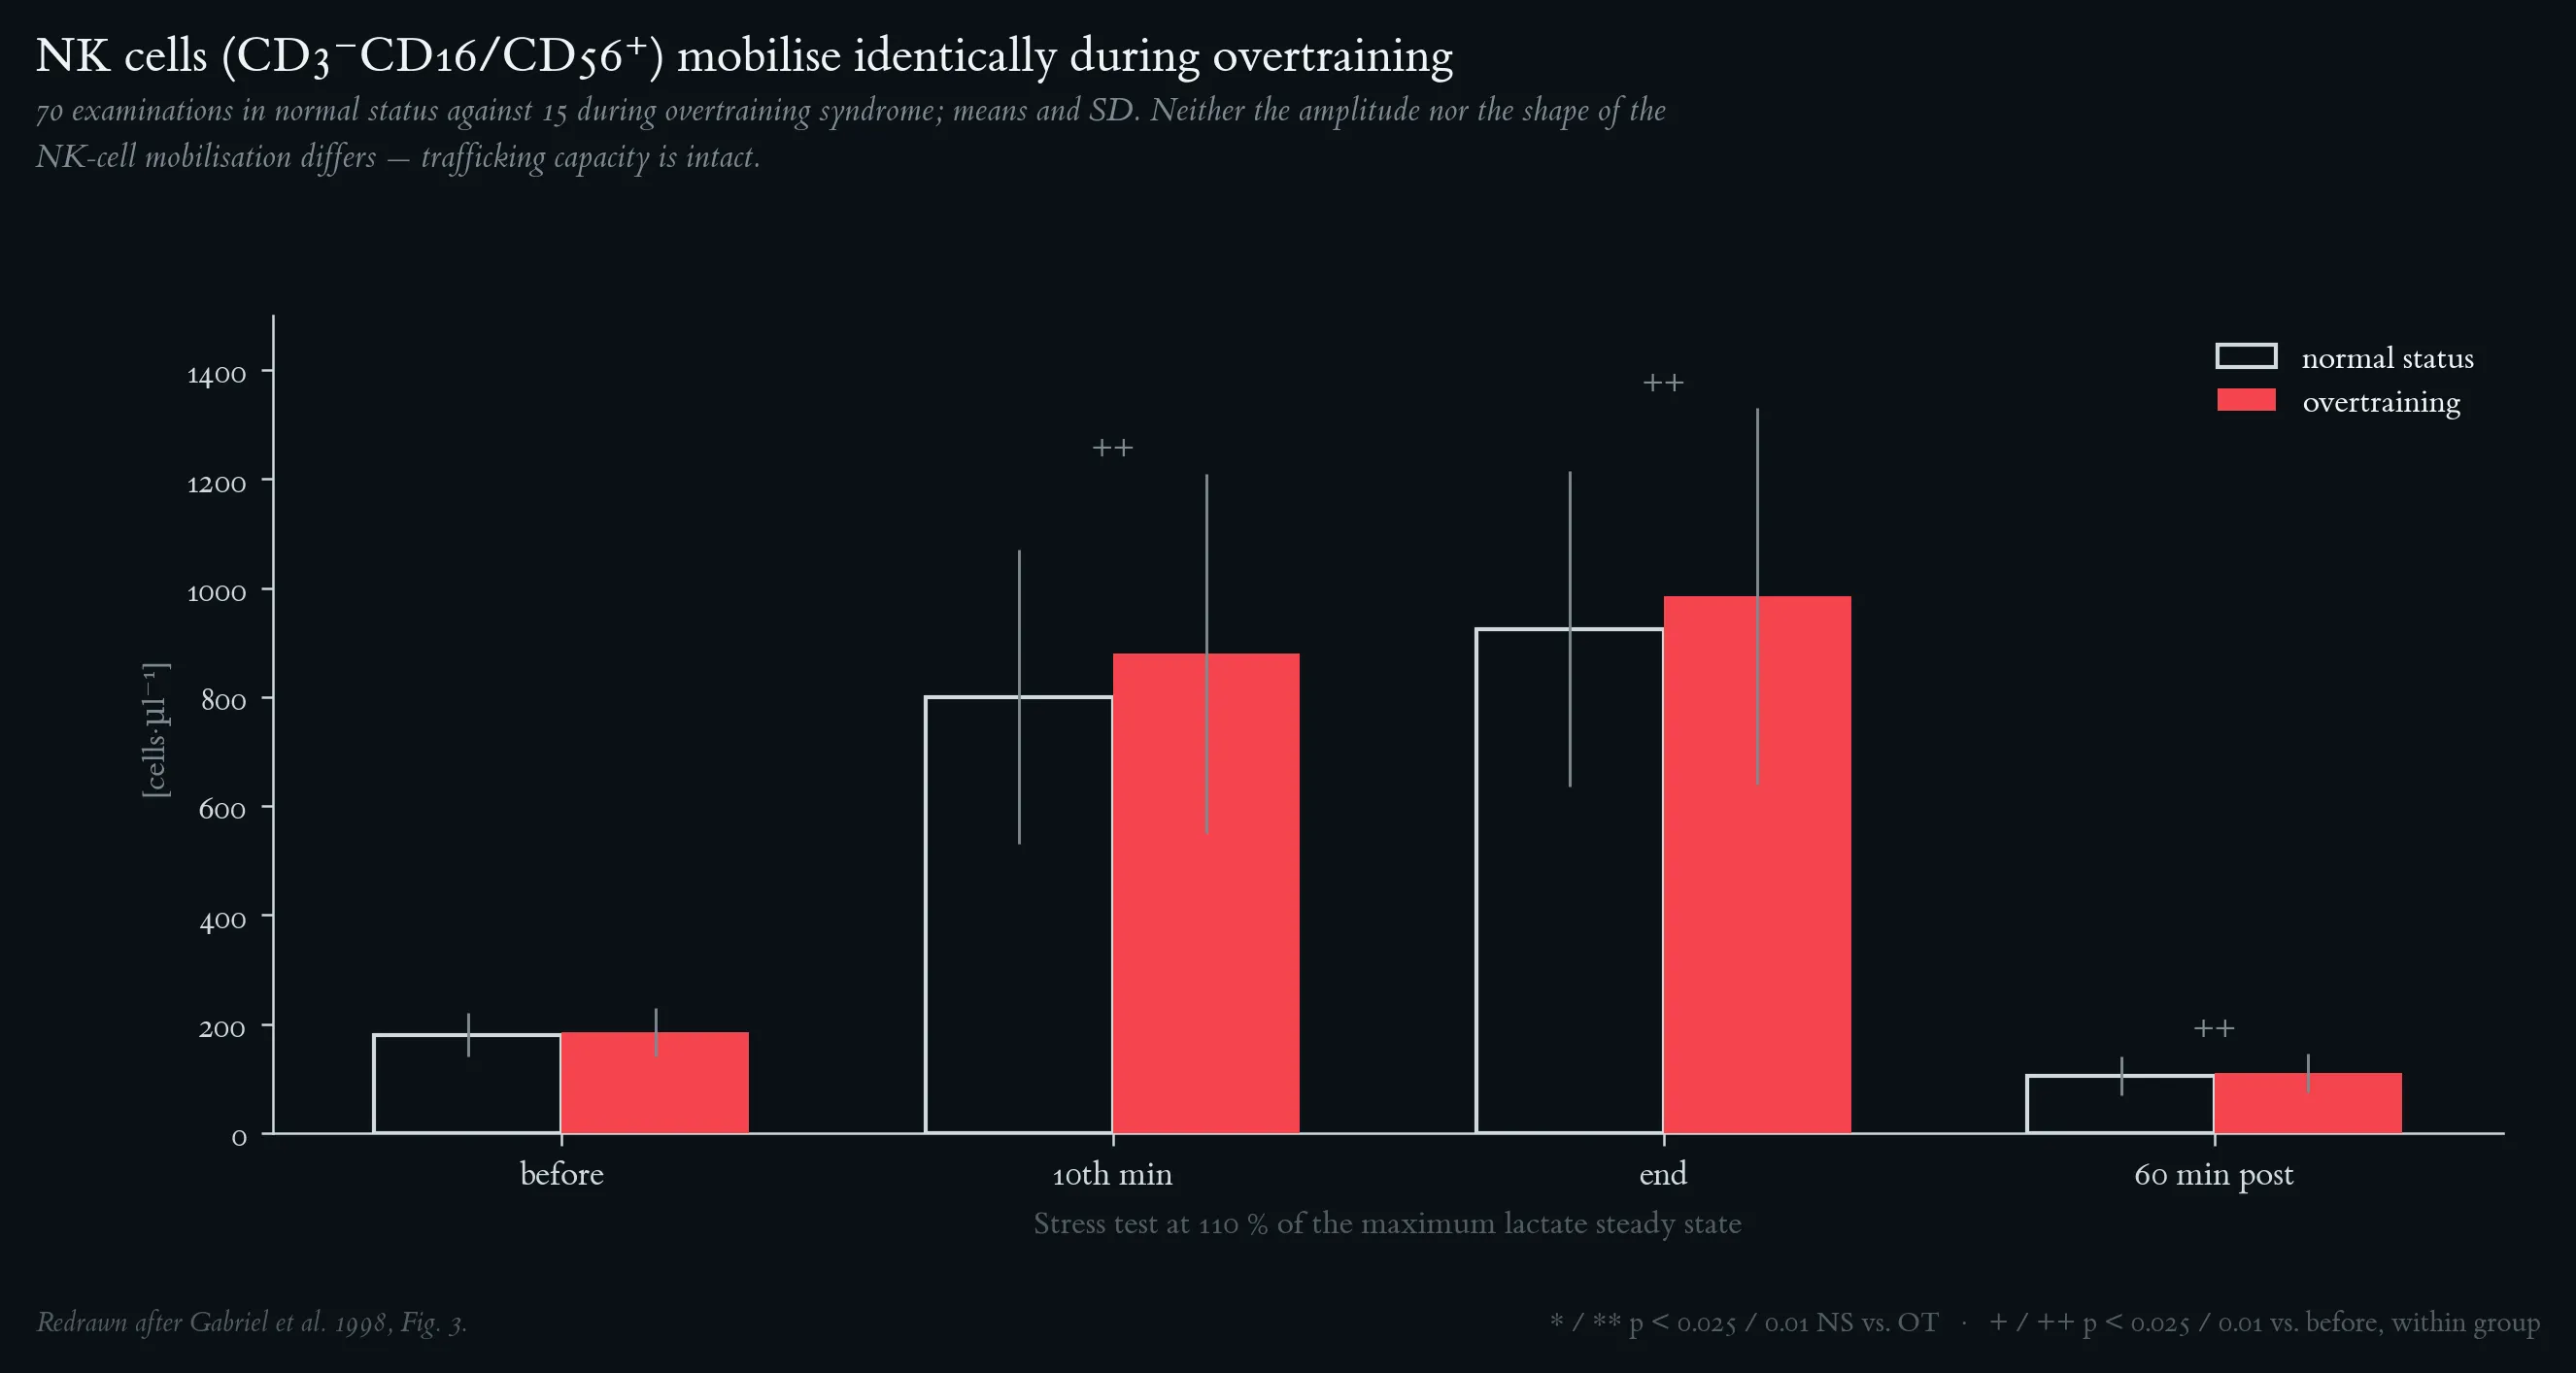
NK-cell counts (CD3⁻CD16/CD56⁺) before, during and after a standardised stress test, in normal status versus overtraining. Fifteen endurance athletes (12 cyclists, 3 triathletes; V̇O₂max 61.2 ± 7.5 mL·min⁻¹·kg⁻¹) were examined approximately every 3–5 months over 19 ± 3 months, yielding 85 examinations: 70 in normal status (NS, open bars) and 15 with a diagnosed overtraining syndrome (OT, filled bars). Blood was drawn before, at the 10th minute of, at the end of, and 60 min after a stress test at 110 % of the maximum lactate steady state. Means and SD; ++ p < 0.01 vs. before exercise within group; no between-group difference reached significance at any time point (significance level 2.5 %). Both the amplitude and the shape of NK-cell mobilisation are fully preserved during overtraining. Redrawn after Gabriel et al. 1998, Fig. 3.
Cytotoxic, non-MHC-restricted T-cell counts (CD3⁺CD16/CD56⁺). Subjects, study design, stress-test protocol and sampling as in Figure 7. Means and SD; * / ** p < 0.025 / 0.01 between NS and OT; + / ++ p < 0.025 / 0.01 vs. before exercise within group. This is the only major cell line whose absolute count was moderately higher during OT — before, at the end of, and 60 min after the test — yet the exercise-induced mobilisation pattern itself is indistinguishable between the two states, i.e. trafficking capacity is unimpaired. Redrawn after Gabriel et al. 1998, Fig. 4.
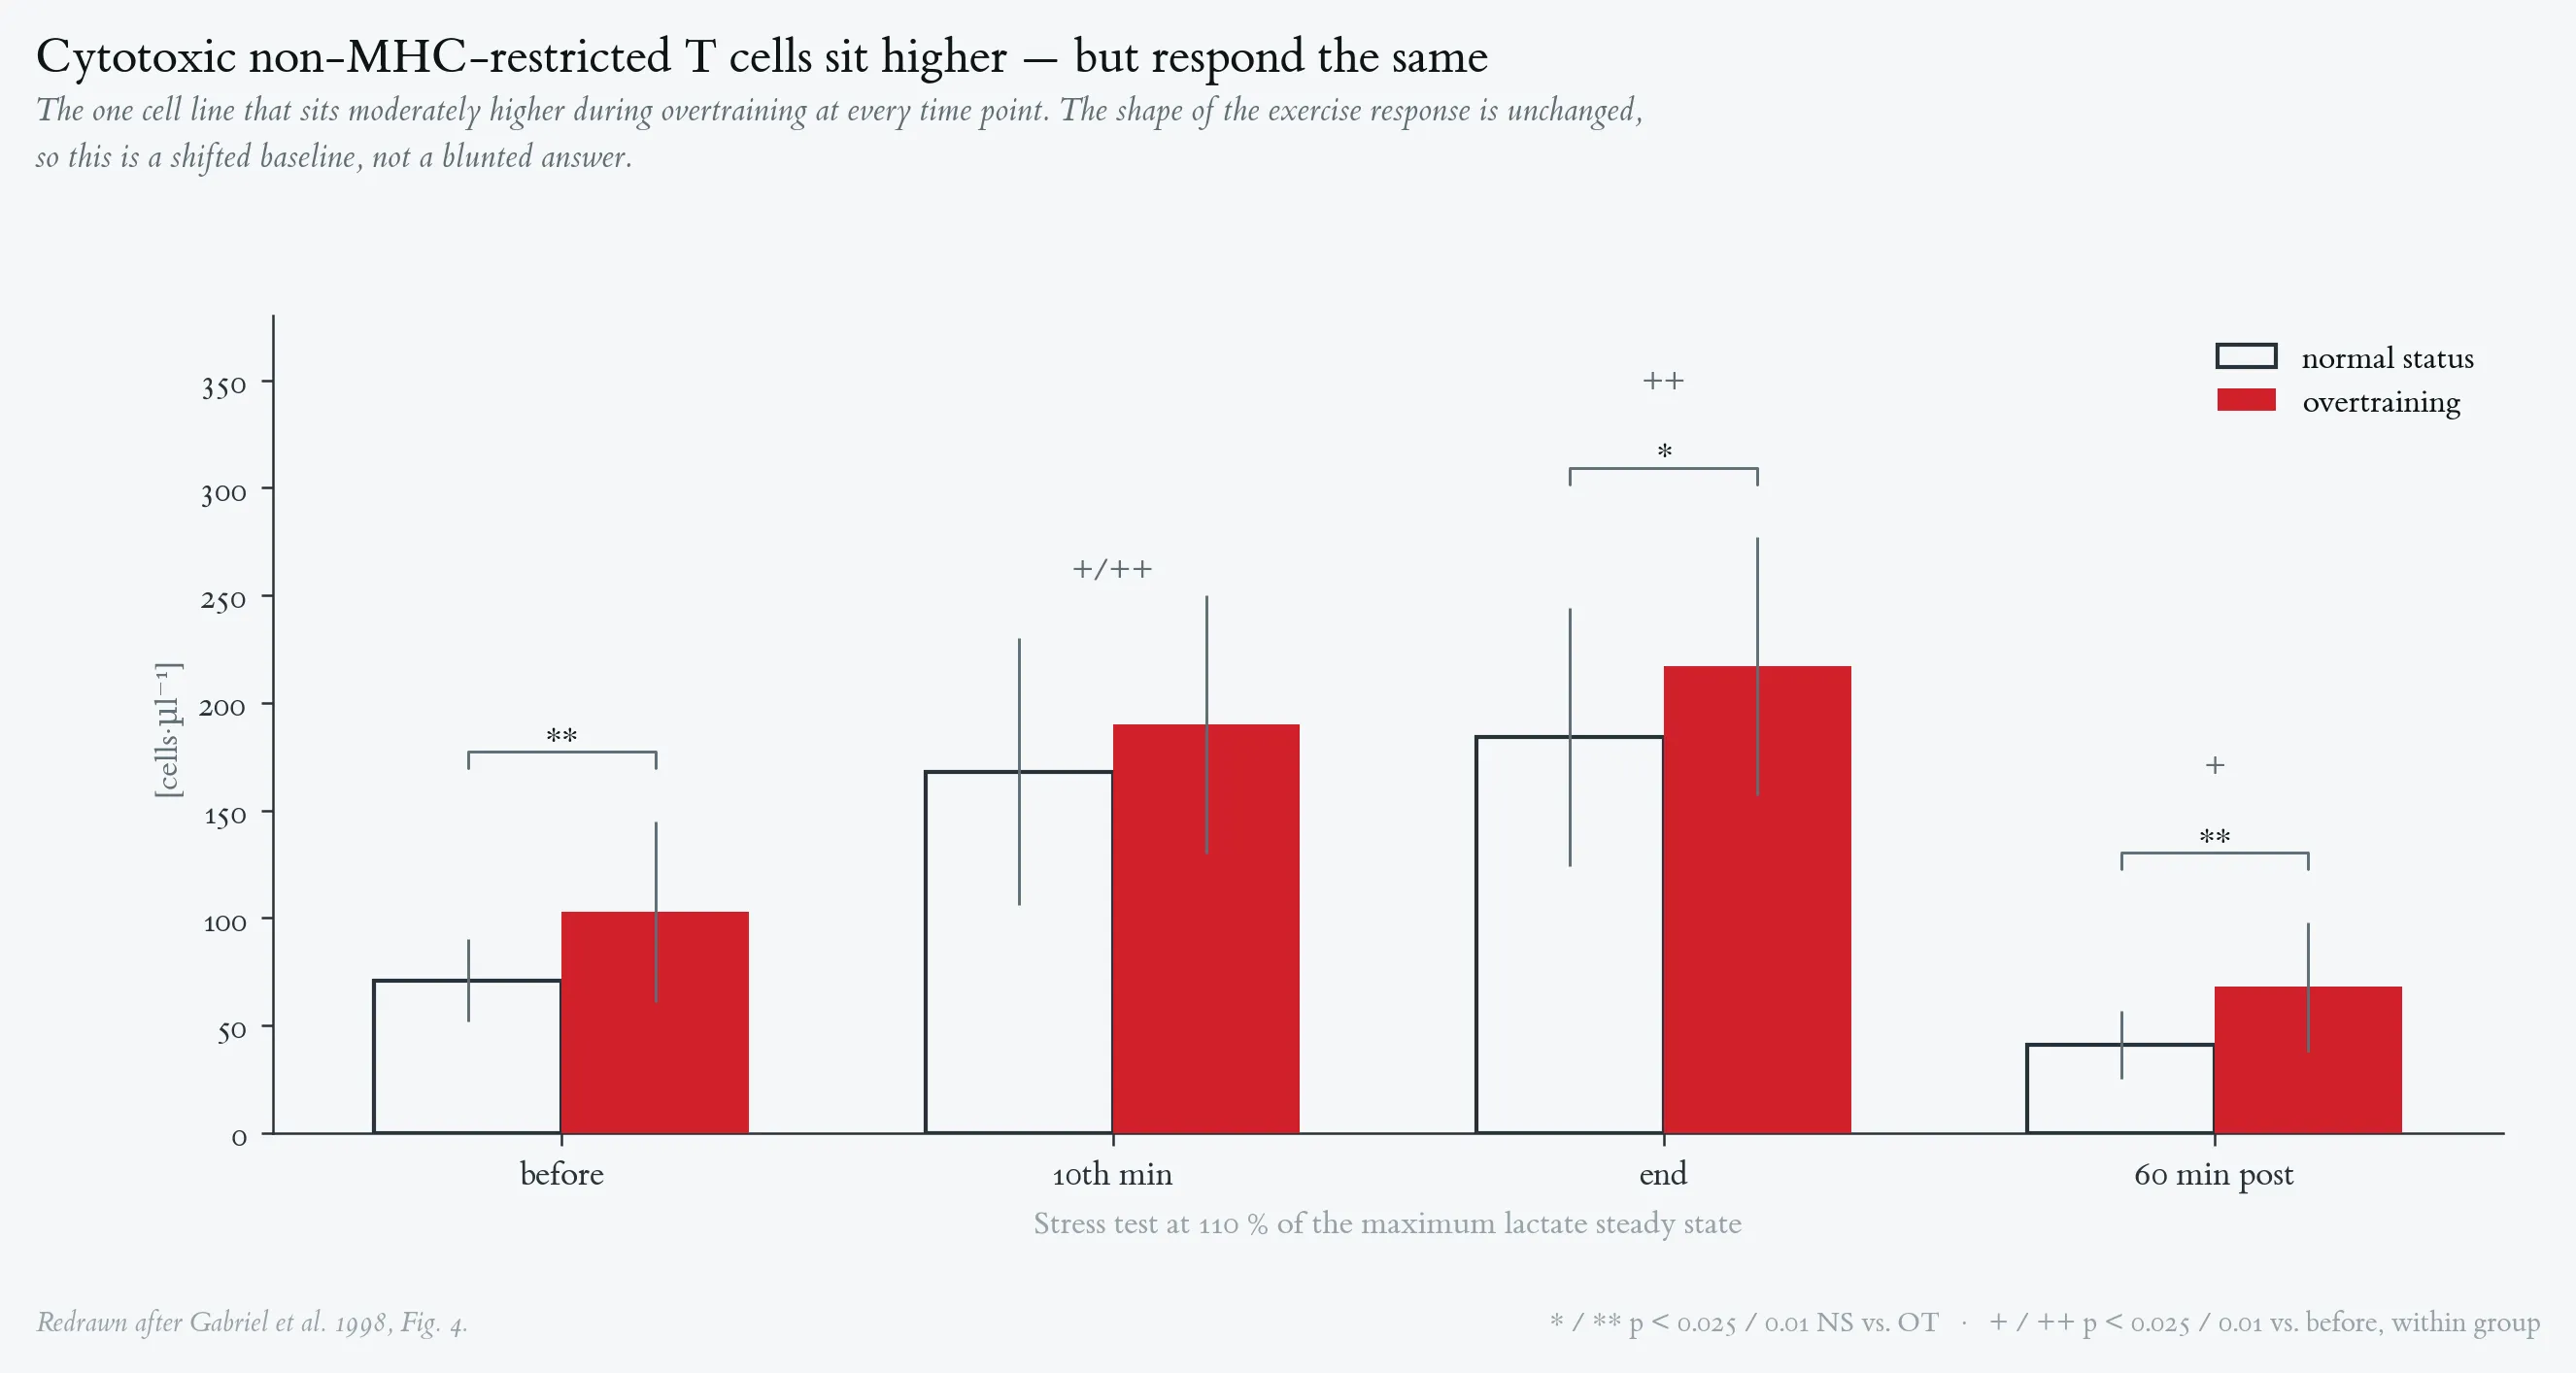
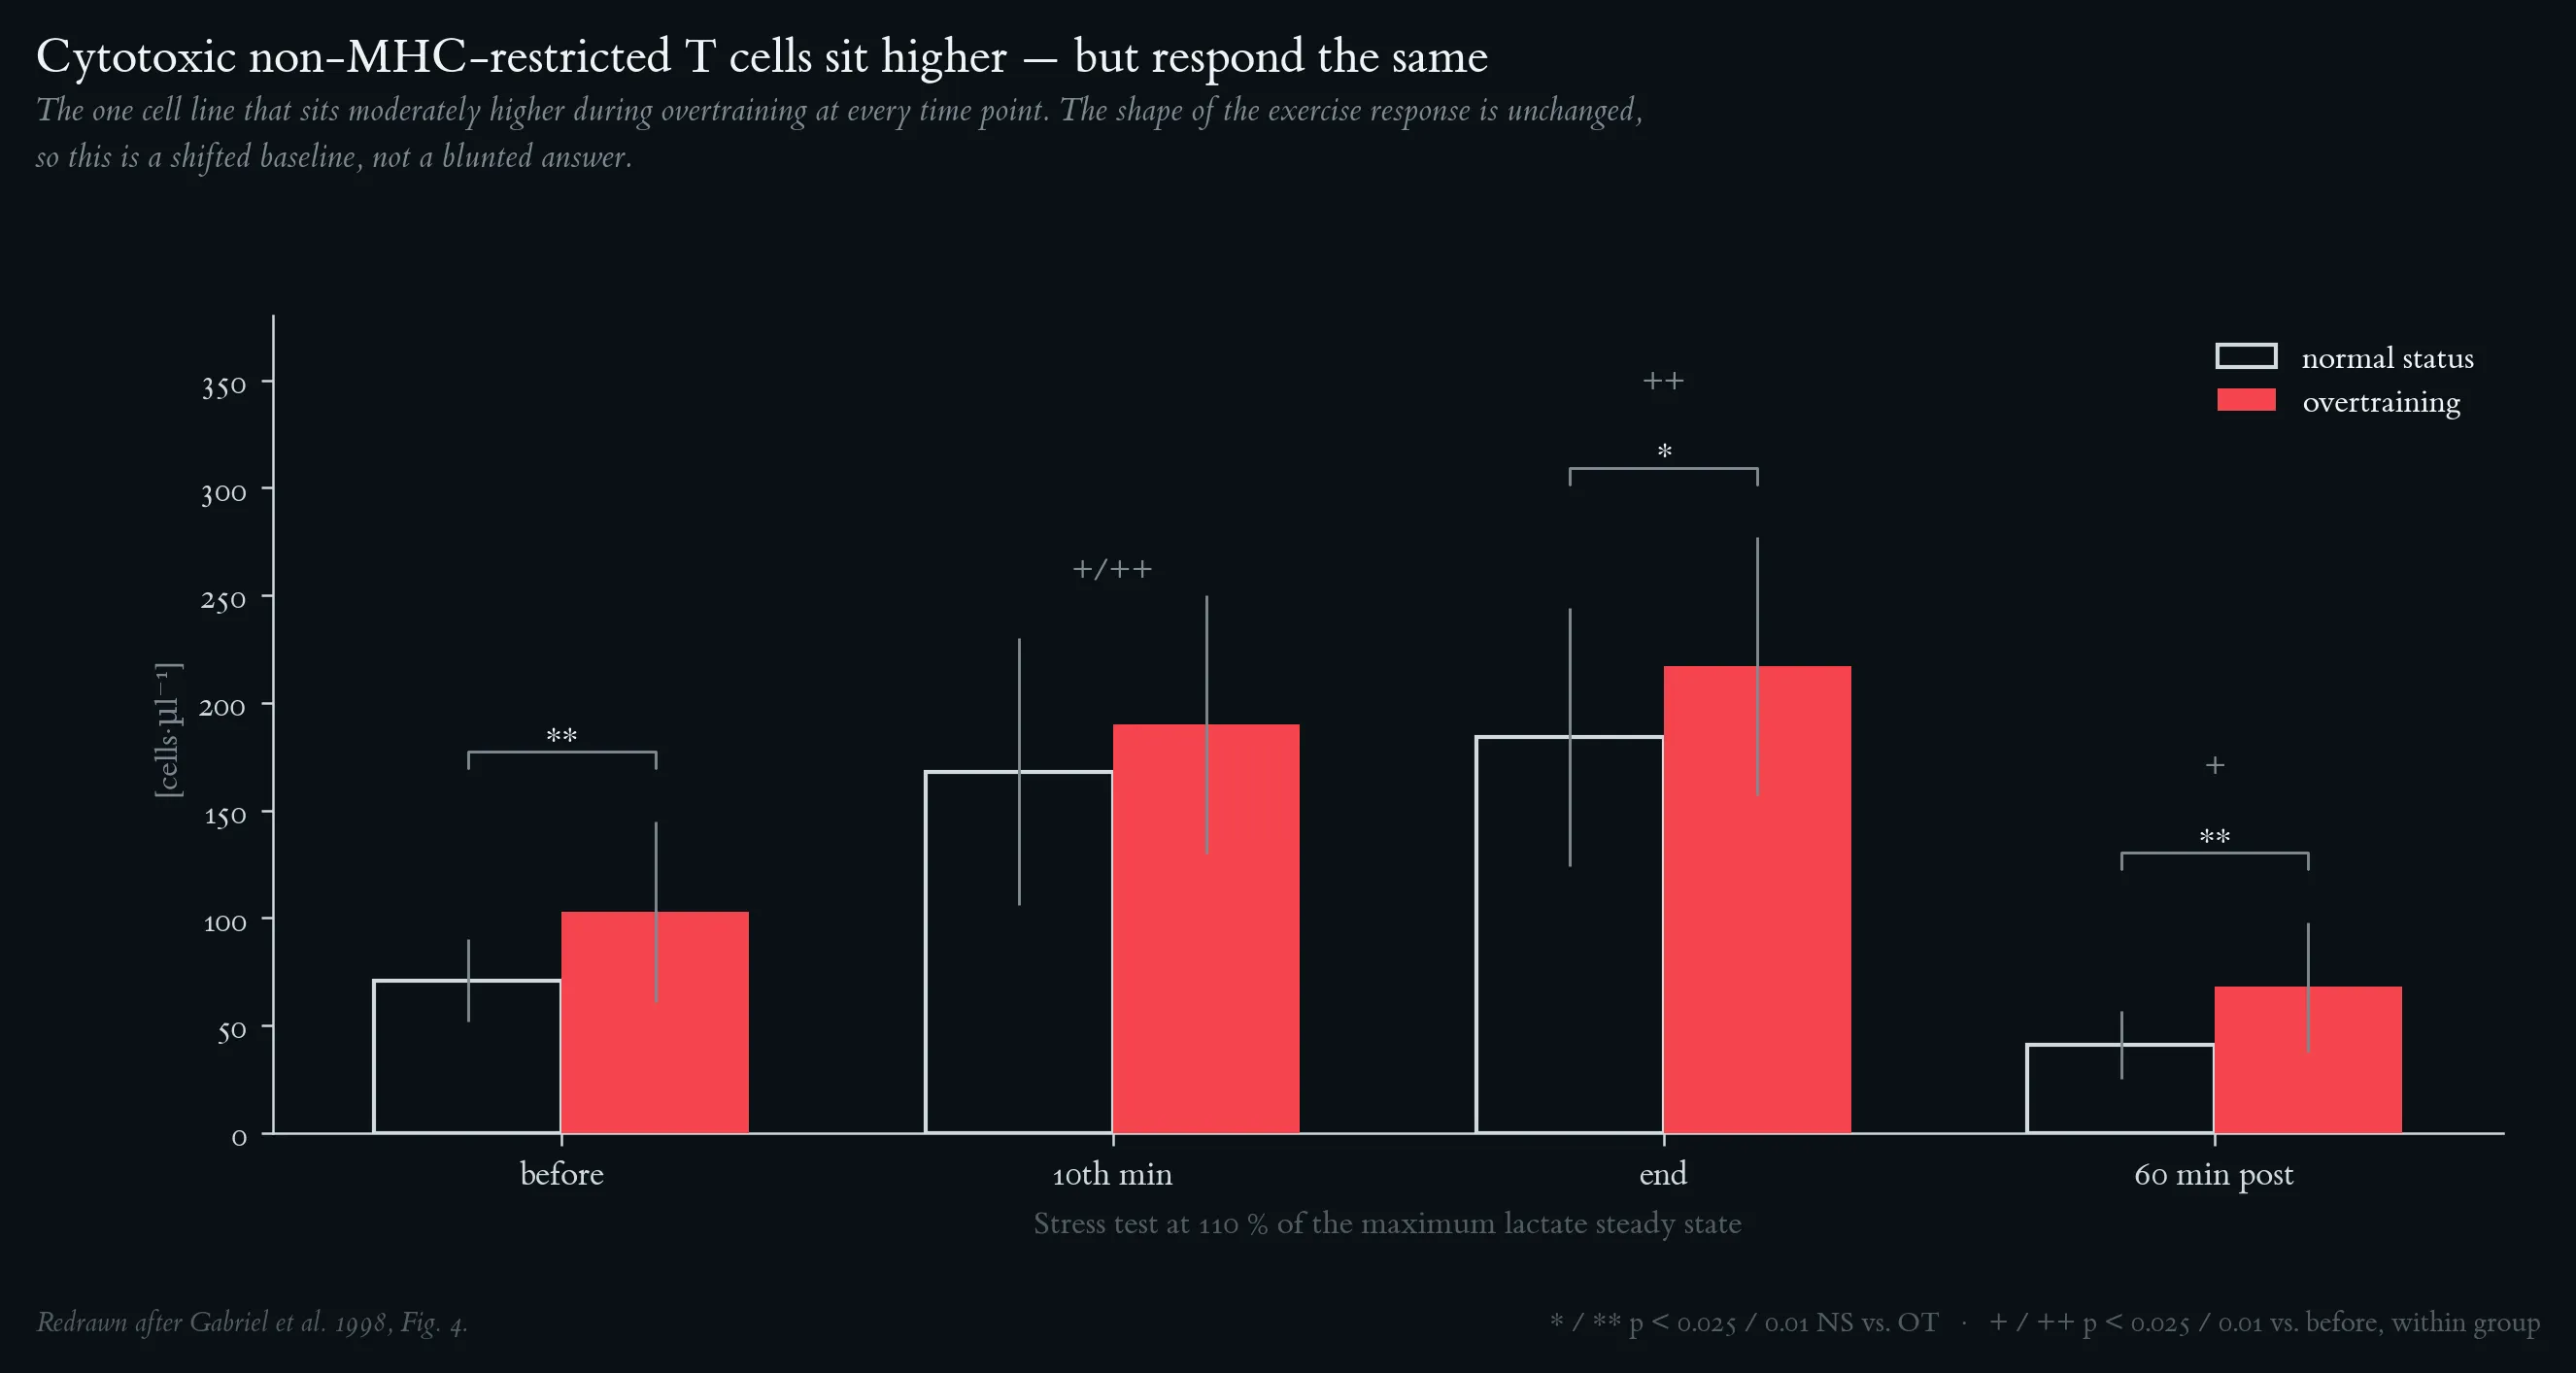
Cytotoxic, non-MHC-restricted T-cell counts (CD3⁺CD16/CD56⁺). Subjects, study design, stress-test protocol and sampling as in Figure 7. Means and SD; * / ** p < 0.025 / 0.01 between NS and OT; + / ++ p < 0.025 / 0.01 vs. before exercise within group. This is the only major cell line whose absolute count was moderately higher during OT — before, at the end of, and 60 min after the test — yet the exercise-induced mobilisation pattern itself is indistinguishable between the two states, i.e. trafficking capacity is unimpaired. Redrawn after Gabriel et al. 1998, Fig. 4.
Cytotoxic and activated T-cell subsets expressed as a percentage of CD3⁺ T cells, normal status versus overtraining. Subjects and study design as in Figure 7. CD3⁺CD16/CD56⁺ cells rose from 7.2 to 10.0 % and CD3⁺HLA-DR⁺ cells from 5.5 ± 2.7 to 7.3 ± 2.4 % of CD3⁺ cells during OT. Means and SD; * / ** p < 0.025 / 0.01 between NS and OT. Together with the higher CD45RO fluorescence intensity on CD4⁺ and CD8⁺ cells — at unchanged absolute CD45RO⁺ counts — this represents a fine upregulation of T-cell activation status rather than the pathological activation seen in, for example, infectious mononucleosis, and was not judged clinically relevant. Redrawn after Gabriel et al. 1998, Fig. 5.
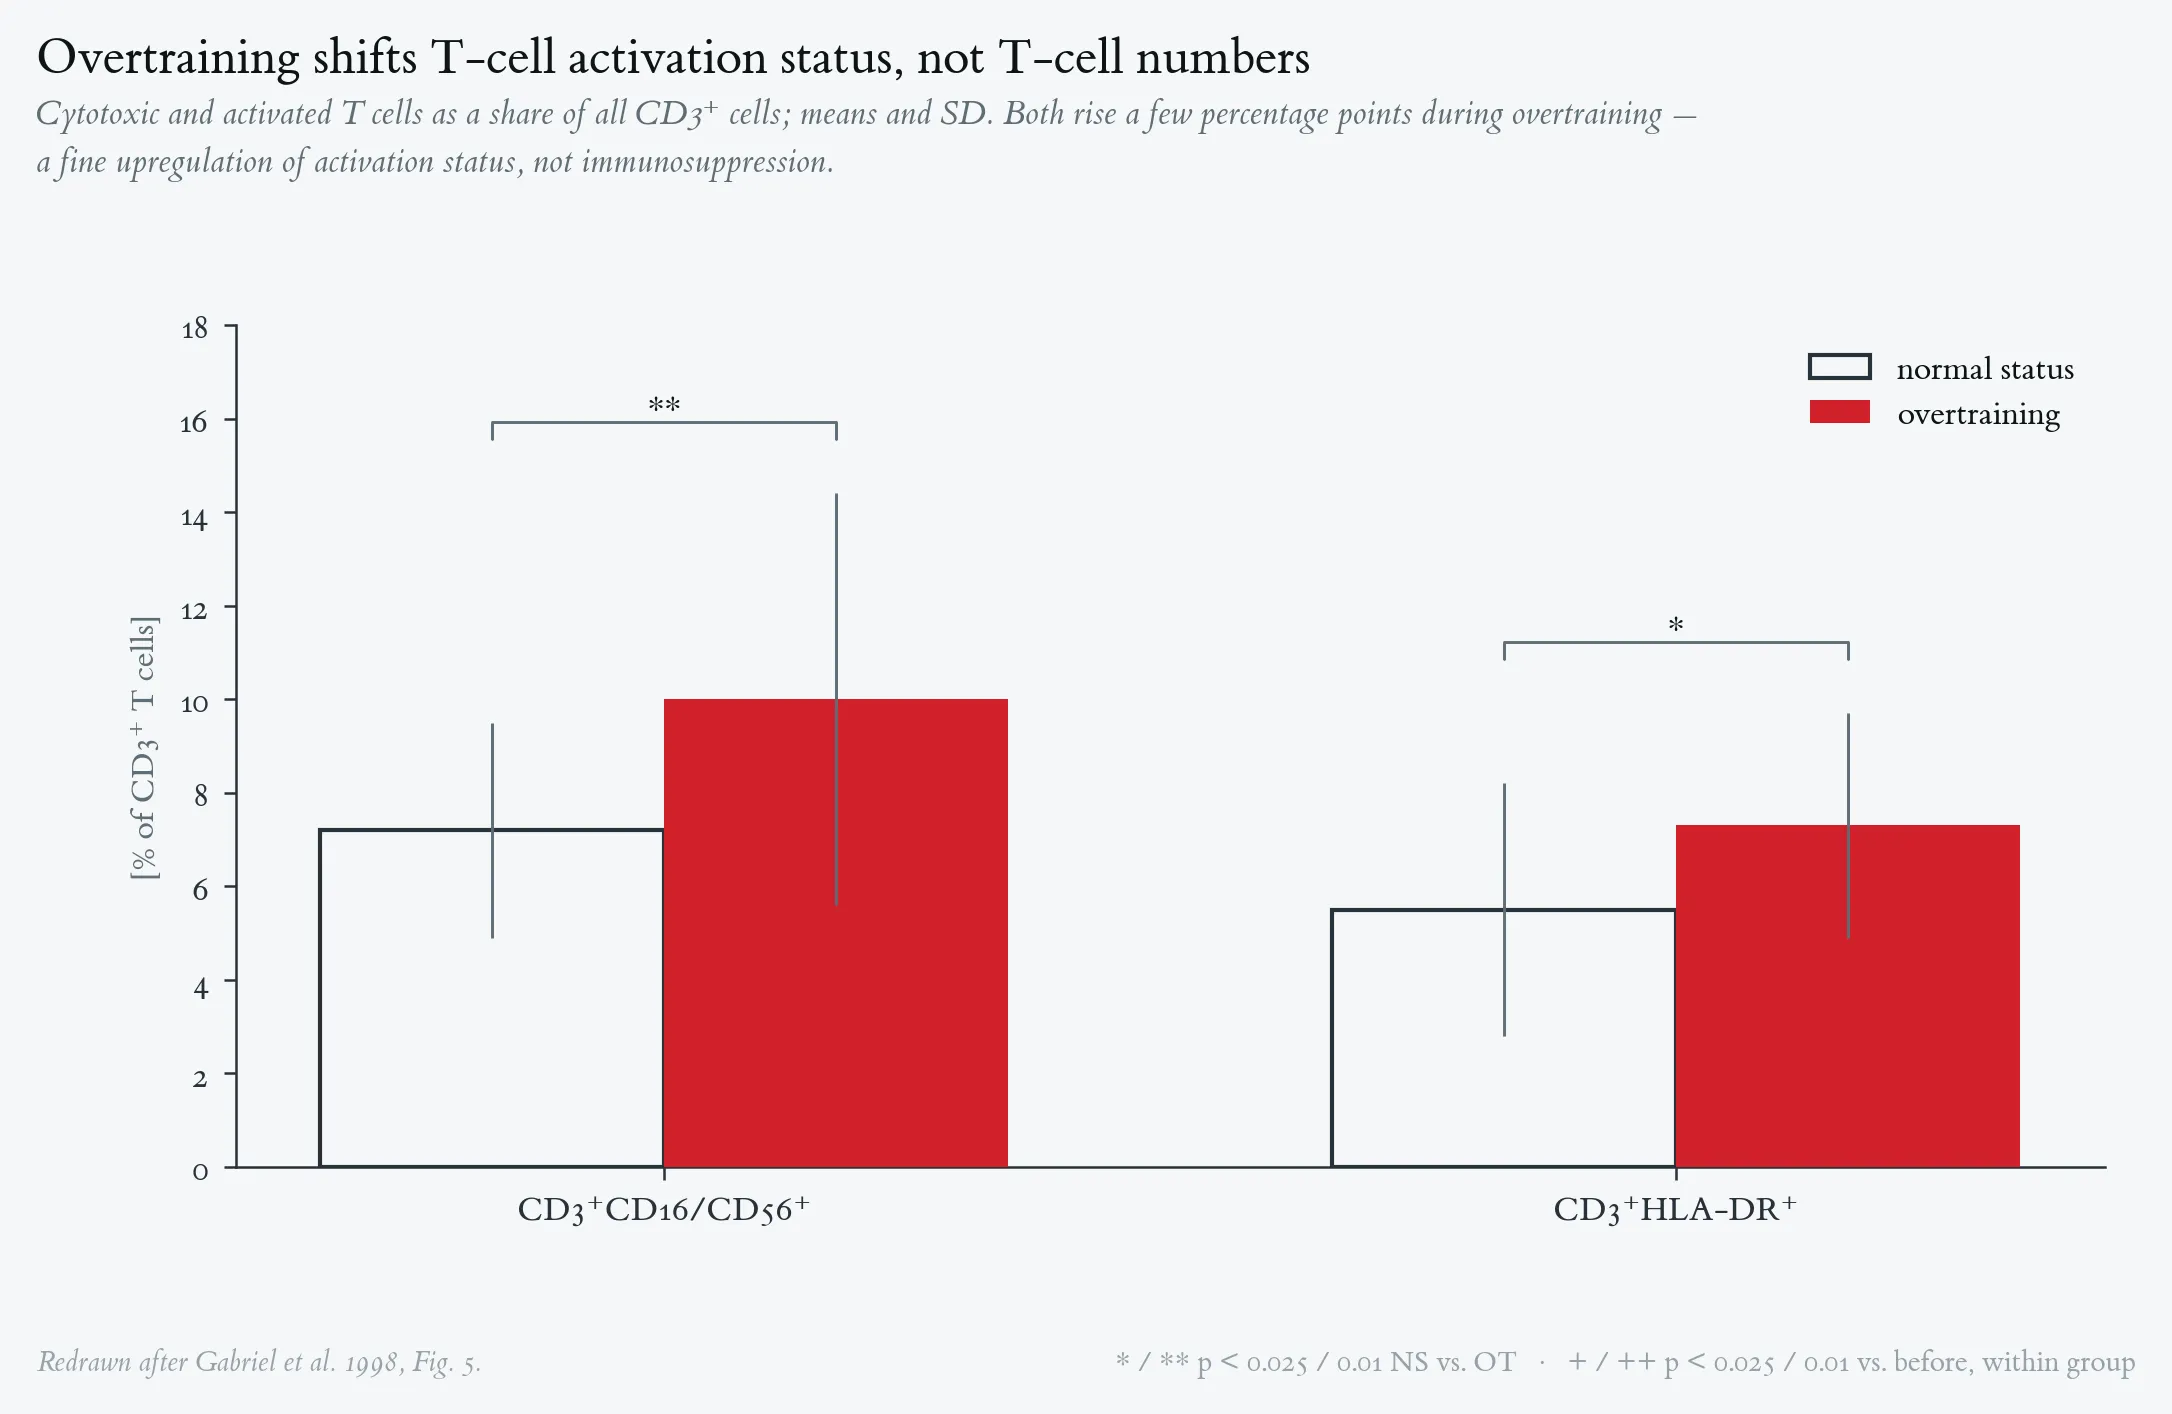
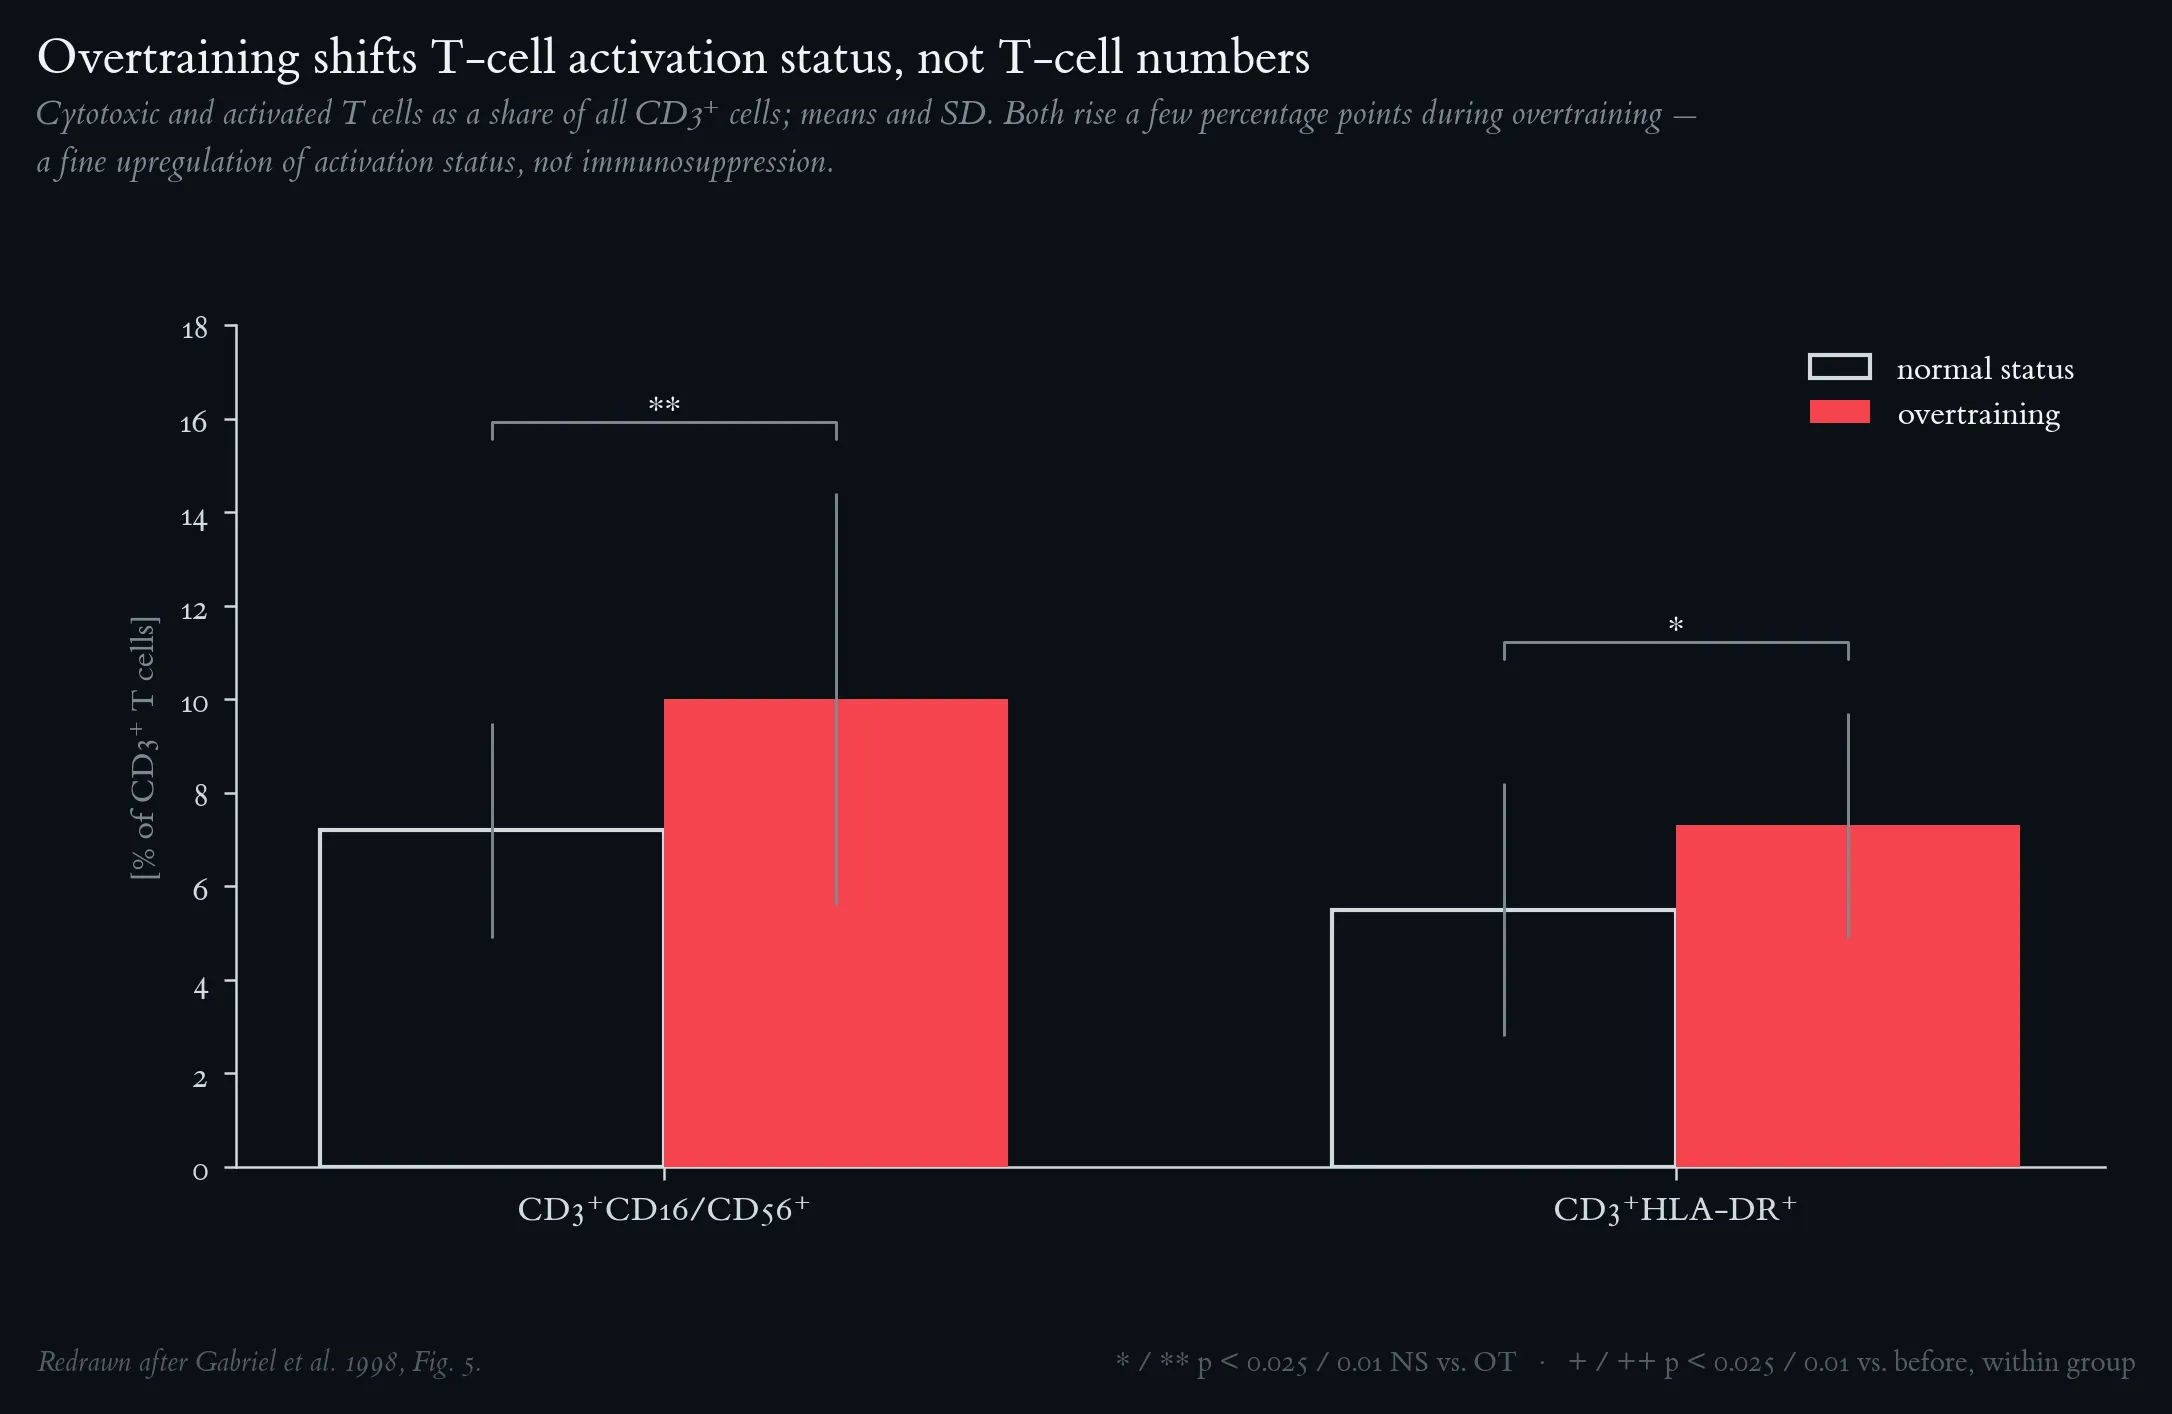
Cytotoxic and activated T-cell subsets expressed as a percentage of CD3⁺ T cells, normal status versus overtraining. Subjects and study design as in Figure 7. CD3⁺CD16/CD56⁺ cells rose from 7.2 to 10.0 % and CD3⁺HLA-DR⁺ cells from 5.5 ± 2.7 to 7.3 ± 2.4 % of CD3⁺ cells during OT. Means and SD; * / ** p < 0.025 / 0.01 between NS and OT. Together with the higher CD45RO fluorescence intensity on CD4⁺ and CD8⁺ cells — at unchanged absolute CD45RO⁺ counts — this represents a fine upregulation of T-cell activation status rather than the pathological activation seen in, for example, infectious mononucleosis, and was not judged clinically relevant. Redrawn after Gabriel et al. 1998, Fig. 5.
One-Minute-Paper Topics
A One-Minute-Paper (OMP) is a short, focused prompt that students answer in ~60 seconds at the end of a session to consolidate learning, surface misconceptions, and provide formative feedback. When answering, be concise, specific, and use terminology from today’s session.
- In Meyer et al. (2001), what single variable best distinguishes the immunological outcome of SMT from AN-TS, despite both reaching lactate ≈ 14 mmol·L⁻¹ and a comparable pH minimum?
- An athlete performs an AN-TS session on Monday evening. On Tuesday morning a routine CRP of 4.8 mg·L⁻¹ is reported. Should this be interpreted as a sign of infection? Justify your answer using the data of Meyer et al. (2001).
- Name the three main immunological criteria that classified AN-TS (but not SMT) as fulfilling an acute phase response, and give the measured values from Meyer et al. (2001).
- Gabriel et al. (1998) found that chronic overtraining did NOT suppress peripheral leukocyte counts. What subtle T-cell signature was detected, and how was it quantified?
- Why does Gabriel et al. (1998) conclude that “routine screening labs will not detect overtraining”? What type of measurement distinguished overtrained from normal-status athletes with 93 % sensitivity?
- A coach proposes two AN-TS-type interval sessions per week separated by 36 h. Using the inflammatory time-course reported by Meyer et al. (2001) (IL-6, CRP, neutrophil kinetics), formulate a science-based recommendation and explain the overtraining risk.
Key References
- Gabriel H., Kindermann W. The acute immune response to exercise: what does it mean? Int. J. Sports Med. 18 (Suppl 1): S28–S45, 1997.
- Gabriel H.H.W., Urhausen A., Valet G., Heidelbach U., Kindermann W. Overtraining and immune system: a prospective longitudinal study in endurance athletes. Med. Sci. Sports Exerc. 30(7): 1151–1157, 1998.
- Meyer T., Gabriel H.H.W., Rätz M., Müller H.J., Kindermann W. Anaerobic exercise induces moderate acute phase response. Med. Sci. Sports Exerc. 33(4): 549–555, 2001.
- Urhausen A., Gabriel H., Kindermann W. Blood hormones as markers of training stress and overtraining. Sports Med. 20: 251–276, 1995.
References
- Gabriel H., Kindermann W. The acute immune response to exercise: what does it mean? Int. J. Sports Med. 18 (Suppl 1): S28–S45, 1997.
- Gabriel H.H.W., Urhausen A., Valet G., Heidelbach U., Kindermann W. Overtraining and immune system: a prospective longitudinal study in endurance athletes. Med. Sci. Sports Exerc. 30(7): 1151–1157, 1998.
- Gabriel H.H.W., Scharhag J., Rätz M., Kindermann W. Charakterisierung der sofortigen Leukozytose nach anaerober Belastung. Dtsch. Z. Sportmed. 54(10): 274–280, 2003.
- Meyer T., Gabriel H.H.W., Rätz M., Müller H.J., Kindermann W. Anaerobic exercise induces moderate acute phase response. Med. Sci. Sports Exerc. 33(4): 549–555, 2001.
- Rothe G., Valet G. Flow cytometric assays of oxidative burst activity in phagocytes. Methods Enzymol. 233: 539–548, 1994.
- Simon R., Röhr W., Schwarz M., Haase H., Puta C., Kipp A.P. Acute effects of physical exercise on biomarkers of the trace elements selenium, zinc, copper, and iron. J. Trace Elem. Med. Biol. 94: 127828, 2026.
- Stegmann H., Kindermann W., Schnabel A. Lactate kinetics and individual anaerobic threshold. Int. J. Sports Med. 2: 160–165, 1981.
- Urhausen A., Gabriel H., Kindermann W. Blood hormones as markers of training stress and overtraining. Sports Med. 20: 251–276, 1995.
- Ziegler-Heitbrock H.W.L. Heterogeneity of human blood monocytes: the CD14⁺CD16⁺ subpopulation. Immunol. Today 17: 424–428, 1996.