Overtraining Syndrome — Pathological Counterpart of the Lactate Shuttle
Table of Contents
- The Overtraining Continuum & Physiological Signature
- The Immune & Cytokine Signature of Overtraining
- Diagnosis & Monitoring
- The Critical Differential: OTS vs Post-Infectious Syndromes
1 The Overtraining Continuum & Physiological Signature
Learning objectives:
- FOR, NFOR and OTS by recovery time on the hormesis dose-response curve
- The paradoxically low lactate signature of OTS and the limits of a graded test
- Sympathicotonic vs parasympathicotonic OT and the unifying β-receptor mechanism
1.1 Hormesis and the OT Continuum
Exercise follows a biphasic dose–response (Radak 2008): sedentary and chronic-overload sit at the two damaging ends of the same curve. The hormetic sweet spot coincides with MLSS / IAS (Kindermann).
The overtraining continuum and typical recovery timeframes.
| Term | Recovery |
|---|---|
| FOR — planned overreaching → supercompensation | Days |
| NFOR — extreme overreaching, no supercompensation | Weeks – months |
| OTS — prolonged maladaptation, exclusion diagnosis | Months – years |
The overtraining continuum and typical recovery timeframes.
On a logarithmic recovery axis the three states stop looking like neighbours: every step down the continuum multiplies the cost by roughly ten, and only OTS has no defined end. The lower band contrasts the two autonomic forms after Israel. Terminology and recovery windows after the ECSS/ACSM consensus statement (Meeusen et al. 2013).
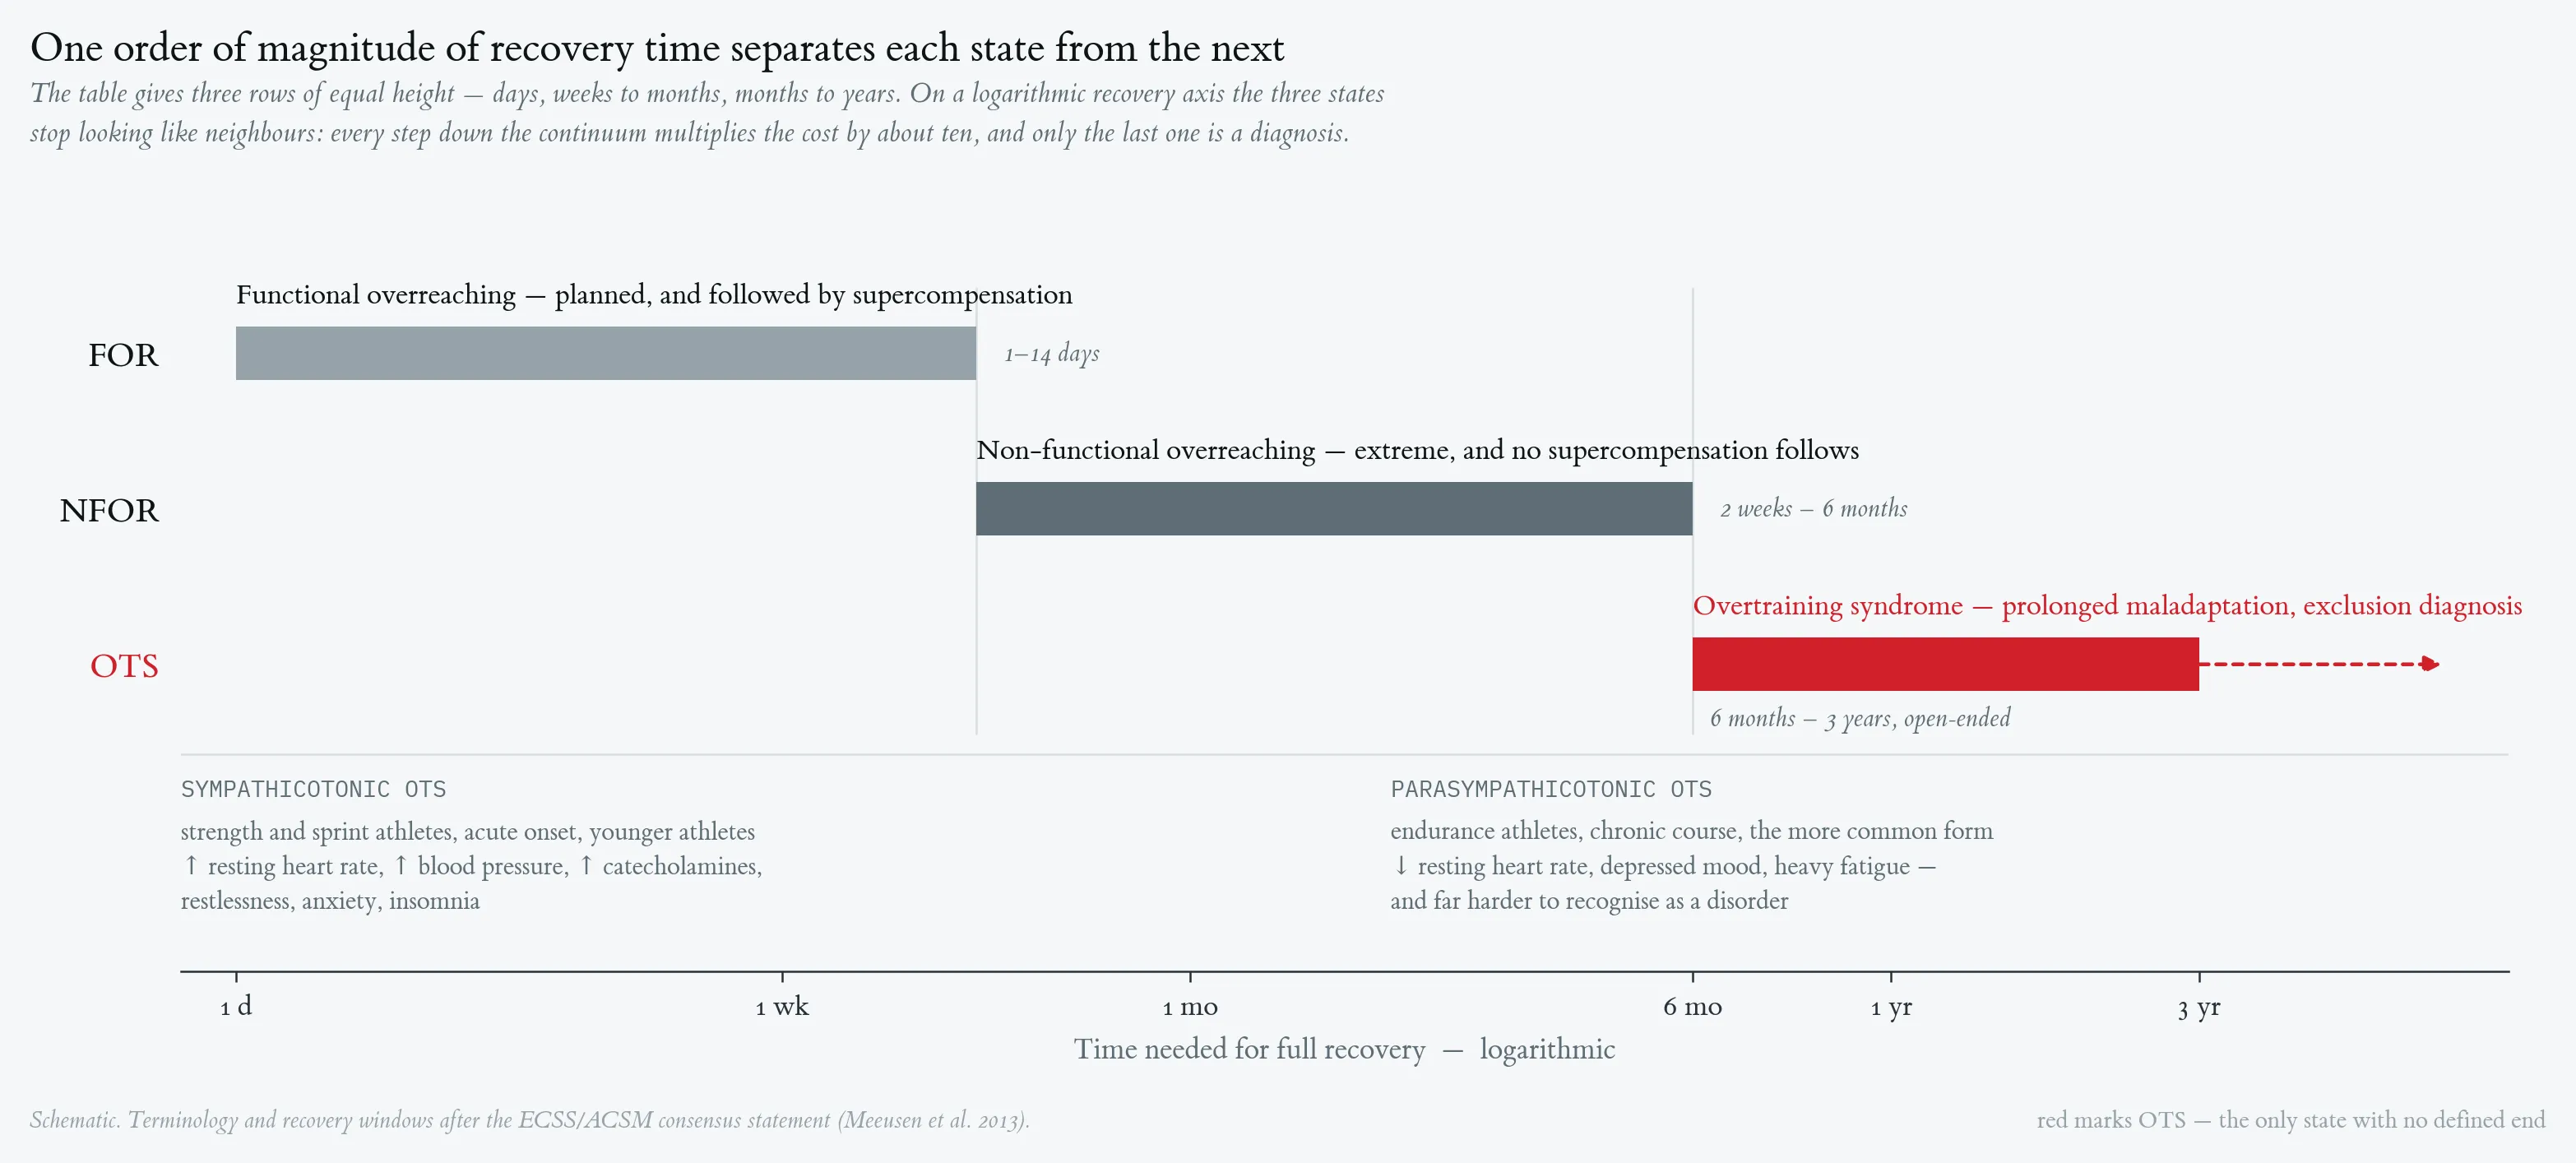
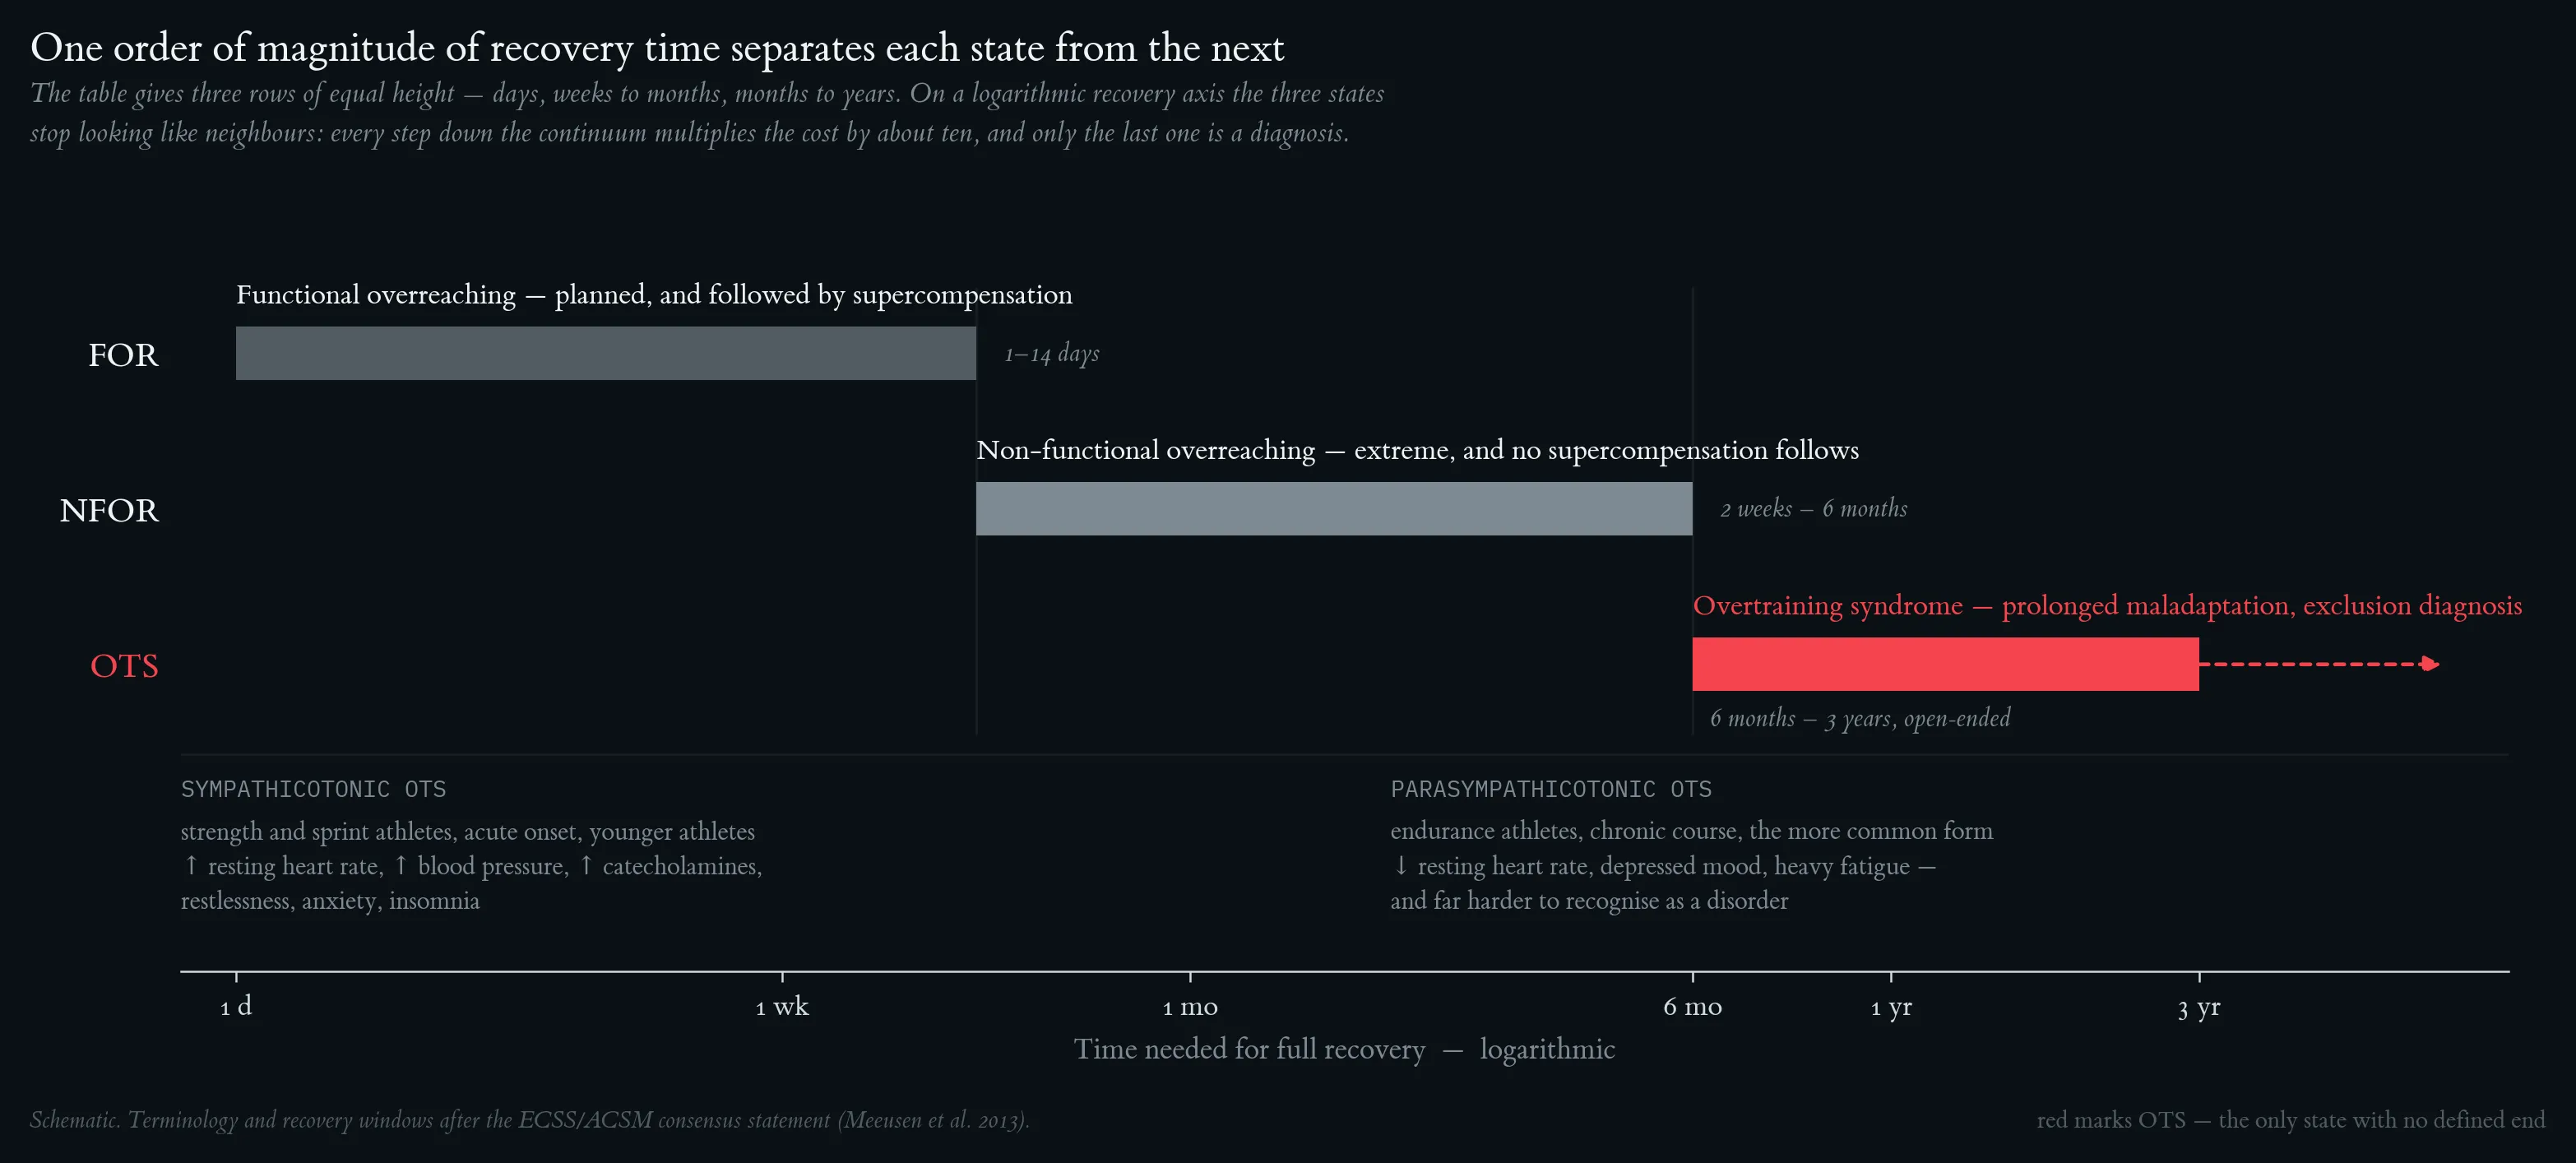
On a logarithmic recovery axis the three states stop looking like neighbours: every step down the continuum multiplies the cost by roughly ten, and only OTS has no defined end. The lower band contrasts the two autonomic forms after Israel. Terminology and recovery windows after the ECSS/ACSM consensus statement (Meeusen et al. 2013).
Prevalence (Meeusen 2013): 7–21% per season; career rate ~60% in elite endurance athletes; 91% relapse after a first OTS episode.
1.2 Lactate Curve in OTS (Urhausen 1998, Meeusen 2013)
The lactate–power curve is NOT classically left-shifted in OTS. Instead:
- Submaximal lactate ↓ slightly (deceptively “improved”)
- Maximal lactate ↓
- Max HR ↓
- Time-to-exhaustion at 110% IAS ↓ ~27% ← most sensitive ergometric marker
- 10/30 s anaerobic alactacid power unchanged
A graded test alone misleads. Always combine with a supra-threshold time-to-exhaustion test plus a mood questionnaire.
1.3 Autonomic Nervous System Markers
Israel’s two-form model:
The two autonomic forms of overtraining syndrome.
| Form | Profile | ANS signature |
|---|---|---|
| Sympathicotonic OT | Strength/sprint, acute, young | ↑ resting HR, ↑ BP, ↑ catecholamines, anxiety, insomnia |
| Parasympathicotonic OT | Endurance, chronic | ↓ resting HR, depressed mood, fatigue — harder to diagnose |
The two autonomic forms of overtraining syndrome.
Sympathetic markers: ↓ max HR; ↑ LF/HF (short-term overload); ↓ nocturnal catecholamines (chronic); blunted lactate response; blunted cortisol/ACTH/GH/PRL to exercise.
Parasympathetic markers: ↑ HF power, ↑ RMSSD (Hedelin); ↓ resting HR in chronic endurance OTS.
Unifying mechanism — β-adrenergic receptor down-regulation (Gleeson, Lehmann): chronic catecholamine surges desensitize peripheral β-AR + central HPA, explaining the convergent blunting of max HR, max lactate, cortisol, and pituitary response. Probed directly by the two-bout test (§9).
Diagnostic caveat: HRV is inconsistent across studies — useful only as longitudinal trend in the same athlete (Meeusen 2013).
Link to lactate shuttle: the blunted submax/max lactate is a downstream consequence of sympathetic exhaustion, not a shuttle failure. MCT1/MCT4 machinery remains intact.
One-Minute-Paper Topics
A One-Minute-Paper (OMP) is a short, focused prompt that students answer in ~60 seconds at the end of a session to consolidate learning, surface misconceptions, and provide formative feedback. When answering, be concise, specific, and use terminology from today’s session.
- Define FOR / NFOR / OTS; what single feature distinguishes them?
- Position OTS on the hormesis curve and name the pathway(s) suppressed.
- Why is OTS in most cases a retrospective diagnosis?
- Does the OTS lactate curve shift left, right, or neither? Contrast with detraining / Long COVID.
- Why is submax lactate sometimes ↓ in OTS, and why can this mislead?
- Describe the 110% IAS time-to-exhaustion test and the threshold for OT suspicion.
- Distinguish sympathicotonic vs. parasympathicotonic OT. Which dominates in endurance athletes?
- Name three findings explained by β-adrenergic receptor down-regulation.
- Why is HRV unreliable as a single OTS marker?
Key References
- Radak et al. (2008). Exercise, oxidative stress and hormesis. Ageing Res Rev, 7, 34–42.
- Meeusen et al. (2013). ECSS/ACSM Joint Consensus on OTS. MSSE, 45(1), 186–205.
- Urhausen et al. (1998). Ergometric & psychological findings during overtraining. IJSM, 19, 114–120.
- Israel S (1976). Zur Problematik des Übertrainings. Medizin und Sport, 16, 1–12.
- Lehmann et al. (1998). Autonomic imbalance hypothesis & OTS. MSSE, 30(7), 1140–1145.
- Hedelin et al. (2000). Cardiac autonomic imbalance in an overtrained athlete. MSSE, 32(9), 1531–1533.
- Bosquet et al. (2008). HR & overreaching: systematic review. BJSM, 42, 709–714.
2 The Immune & Cytokine Signature of Overtraining
Learning objectives:
- Smith’s cytokine hypothesis and its place in Selye’s GAS stage 3
- The OTS immune phenotype: ↓ NK cytotoxicity, Th2 shift, ↓ sIgA, ↑ resting IL-6
- Myokine red flags of overtraining as a failure of resolution
2.1 Gabriel et al. 1998 — Immunophenotyping
Companion to Urhausen 1998 (same Saarbrücken cohort). Flow cytometry of CD3/4/8/16/19/45/45RO/56/HLA-DR.
Key finding: peripheral T, B, NK cell counts are NOT altered in OTS. But receptor density of CD45RO on CD4⁺ T-cells is significantly elevated (P < 0.001).
- Self-learning classifier: specificity 92%, sensitivity 93%
- Count-based classification only: 67% / 84%
- Caveat: CD45RO ↑ also reflects subclinical viral (e.g. EBV) reactivation — always screen first
- Meeusen 2013 endorses CD45RO as the single most discriminating immune marker
2.2 Acute OT + Clinical Immune Signature (Fry 1994, Hackney 2012)
Acute OT (5 SAS soldiers, 10 days × 2 sessions/day): performance ↓, mood ↓, IL-2 + lymphocyte proliferation ↓. With recovery, mood normalizes — but fatigue and immune deficits persist.
OTS immune phenotype: ↓ NK cytotoxicity, ↓ neutrophil oxidative burst, ↓ T-cell proliferation, Th2 shift, ↓ sIgA, ↑ resting IL-6 (paradoxical), recurrent URTI, EBV/HSV reactivation, reduced vaccine response. >50% of pre-Olympic OT-symptomatic athletes present with infection vs. 0% of overreached controls.
2.3 Cytokine Hypothesis (Smith 2000)
Training overload → micro-trauma → monocyte activation
                       ↓
        Systemic IL-1β / IL-6 / TNF-α ↑
                       ↓
    CNS sickness behavior  +  Liver gluconeogenesis ↑
    HPA exhaustion         +  Immune dysfunction
OTS = Selye GAS stage 3 (exhaustion), not adaptation. Chronic inflammation downregulates PGC-1α and mitochondrial biogenesis — the same pathways the lactate shuttle (§4 parent) is designed to activate.
2.4 Overtraining and Myokine Monitoring: Red Flags for Excessive Training Load
Ringleb et al. note that excessively prolonged efforts—ultra-endurance events exceeding 5-6 hours of continuous exercise—may paradoxically shift from the adaptive pattern described to potentially detrimental immune responses characterized by sustained rather than transient elevation of pro-inflammatory signals (Ringleb et al. 2026). This observation translates into a practical monitoring approach for coaches and sports medicine practitioners: myokine biomarker profiling in the recovery period can distinguish normal post-exercise adaptation from concerning overtraining patterns.
Normal adaptation pattern: High IL-6 (g > 0.8), concurrent elevated IL-1ra/IL-10, TNF-α normal to mildly elevated, with rapid normalization within 24-48 hours.
Concerning overtraining pattern: Sustained IL-6 elevation at 48-72 hours post-training, delayed or absent IL-1ra/IL-10 elevation, or paradoxical sustained TNF-α elevation suggesting NF-κB-dependent pro-inflammatory signaling. These patterns warrant training load reduction and recovery protocol intensification to prevent progression to overtraining syndrome with its attendant immunological suppression.
One-Minute-Paper Topics
A One-Minute-Paper (OMP) is a short, focused prompt that students answer in ~60 seconds at the end of a session to consolidate learning, surface misconceptions, and provide formative feedback. When answering, be concise, specific, and use terminology from today’s session.
- What did Gabriel 1998 measure that prior studies missed? Specificity/sensitivity?
- Why screen EBV/CMV before attributing CD45RO↑ to OTS?
- Summarize Smith’s cytokine hypothesis in five steps. Which Selye-GAS stage?
- How does chronic inflammation blunt lactate-as-lactormone signaling?
Key References
- Gabriel et al. (1998). Overtraining and immune system. MSSE, 30(7), 1151–1157.
- Fry et al. (1994). Psychological & immunological correlates of acute overtraining. BJSM, 28(4), 241–246.
- Hackney & Koltun (2012). Immune system & overtraining: clinical implications. Acta Clin Croat, 51, 633–641.
- Smith (2000). Cytokine hypothesis of overtraining. MSSE, 32(2), 317–331.
- Ringleb M, Fabritius F, Godde J, Puta C, Bloch W, Javelle F (2026) Circulating myokine responses to acute endurance exercise and their role in immunoregulation: a systematic review and meta-analysis. The FASEB Journal 40(4):e71536. https://doi.org/10.1096/fj.202504780R.
- Kistner TM, Pedersen BK, Lieberman DE (2022) Interleukin 6 as an energy allocator in muscle tissue. Nat Metab 4:170-179.
- Meeusen et al. (2013). ECSS/ACSM Joint Consensus on OTS. MSSE, 45(1), 186–205.
3 Diagnosis & Monitoring
Learning objectives:
- Gleeson’s criteria for an ideal OTS marker
- Psychological monitoring with POMS / RESTQ-Sport and the inverted iceberg profile
- The ECSS/ACSM two-bout test, Foster session-RPE load, and prevention
3.1 Gleeson’s Marker Framework (2002)
Criteria for an ideal OTS marker: sensitive to load, predictive, distinguishable from acute exercise, easy/cheap, non-invasive, measurable at rest or after a short submaximal bout.
Verdict — what works:
Candidate diagnostic markers for overtraining syndrome.
| Marker | Status |
|---|---|
| Blunted cortisol response to standardized exercise | Best hormonal probe (saliva-based) |
| Blunted lactate response to fixed-intensity exercise | β-adrenergic / HPA dysregulation |
| CD4⁺CD45RO⁺ expression | High specificity + sensitivity (see §5) |
| Salivary IgA ↓ | Good with caveats |
Candidate diagnostic markers for overtraining syndrome.
What doesn’t work alone: plasma glutamine, CK, urea, cortisol/T ratio, resting catecholamines, CD4/CD8 ratio.
3.2 Psychological Monitoring (Morgan 1987, Meeusen 2013)
- POMS: dose-response with training load; iceberg profile inverts in staleness; up to 80% of OTS athletes show clinical depression
- TDS (7 items): higher discriminant accuracy than full POMS
- RESTQ-Sport (77 items, 19 factors): captures stress and recovery
- Psychomotor speed / reaction-time tests (Stroop, finger pre-cuing): detect central fatigue earlier than biochemistry
3.3 ECSS/ACSM 2013 Consensus (Meeusen et al.)
3.3.1 Two-Bout Maximal Exercise Test
Two incremental tests to exhaustion, separated by 4 hours. Hormonal pattern on bout 2 vs. bout 1:
Neuroendocrine response to a two-bout exercise protocol by training state.
| State | ACTH / PRL / GH on bout 2 |
|---|---|
| Healthy | Comparable |
| FOR | Less pronounced |
| NFOR | Hyperreactive |
| OTS | Bout 1 extreme + complete suppression in bout 2 |
Neuroendocrine response to a two-bout exercise protocol by training state.
The only protocol that prospectively differentiates NFOR from OTS.
3.3.2 Foster Session-RPE Load Model
- Daily load = session RPE × duration (min)
- Monotony = daily mean ÷ SD
- Strain = weekly load × monotony
Spikes in monotony/strain prospectively predict illness and injury.
3.3.3 Prevention (the only “treatment” is rest)
- ≥ 1 passive rest day/week
- Sleep hygiene
- CHO 8.5 g/kg/day (Achten 2004); glutamine/BCAA supplementation does NOT help
- Avoid monotony; individualize intensity (IAS-based)
- Suspend training during URTI
- Multidisciplinary monitoring for elite athletes
3.3.4 Diagnostic Flowchart
Underperformance ≥ 2 weeks
  → Rule out organic causes (CBC, ferritin, TSH, EBV/CMV, CK, allergies, cardiology)
  → Lactate test: submax ↓ + max ↓ + max HR ↓
  → 110% IAS time-to-exhaustion test (Urhausen) → t_exh ↓ ≥ 20%
  → Two-bout exercise test (Meeusen) → bout 2 suppression
  → Flow cytometry: CD45RO on CD4⁺ ↑↑ (rule out EBV)
  → POMS / TDS / RESTQ-Sport → TMD ↑, depression ↑↑
  → 2–4 weeks complete rest
        → recovery in weeks → NFOR
        → no recovery in months → OTS
One-Minute-Paper Topics
A One-Minute-Paper (OMP) is a short, focused prompt that students answer in ~60 seconds at the end of a session to consolidate learning, surface misconceptions, and provide formative feedback. When answering, be concise, specific, and use terminology from today’s session.
- Recite Gleeson’s six criteria for an ideal OTS marker.
- Why is a blunted cortisol response more informative than resting cortisol?
- Describe the two-bout test. What hormonal pattern distinguishes FOR/NFOR/OTS?
- Calculate Foster monotony and strain for: 400, 420, 380, 410, 390, 400, 410 (RPE × min).
- State the most important prevention strategy and the CHO recommendation (g/kg/day).
Key References
- Gleeson (2002). Biochemical & immunological markers of overtraining. JSSM, 1, 31–41.
- Morgan et al. (1987). Psychological monitoring of overtraining and staleness. BJSM, 21(3), 107–114.
- Meeusen et al. (2013). ECSS/ACSM Joint Consensus on OTS. MSSE, 45(1), 186–205.
- Foster (1998). Monitoring training with reference to OTS. MSSE, 30, 1164–1168.
- Achten et al. (2004). Higher CHO during intensified training. J Appl Physiol, 96, 1331–1340.
- Kreher & Schwartz (2012). Overtraining Syndrome: A Practical Guide. Sports Health, 4(2), 128–138.
4 The Critical Differential: OTS vs Post-Infectious Syndromes
Learning objectives:
- OTS vs ME/CFS and Long COVID: the lactate-clearance signature
- Broken upstream sympathetic drive against broken downstream oxidative machinery
- Contraindications to graded exercise, and pacing within the energy envelope
4.1 Lactate Clearance: OTS vs. Post-Infectious Syndromes
Critical differential. OTS and ME/CFS / Long COVID look similar (fatigue, low max lactate) but have opposite clearance signatures.
Lactate and metabolic signatures distinguishing OTS from ME/CFS and Long COVID.
| Feature | OTS | ME/CFS / Long COVID |
|---|---|---|
| Lactate–power curve | No shift | Left-shifted |
| Resting lactate | Normal | ↑ (correlates with PEM, Lien 2019) |
| Submax lactate (low W) | ↓ or unchanged | ↑ |
| Max lactate | ↓ | ↓ |
| Post-exercise clearance | Largely preserved | Slower |
| 2-day CPET VO₂ at AT (day 2) | Variable | Reproducibly ↓ (Snell 2013) |
| Peripheral O₂ extraction | Preserved | ↓ (Haunhorst 2022) |
| Primary defect | Reduced production (β-AR / HPA) | Reduced clearance / oxidation (mitochondrial + microvascular) |
| Recovery | Months with rest | Often years; PEM after minimal effort |
Lactate and metabolic signatures distinguishing OTS from ME/CFS and Long COVID.
Both conditions lower maximal lactate, but only one moves the curve. Overtraining reproduces the healthy lactate–power curve under a lower ceiling — the defect is reduced production. ME/CFS and Long COVID shift the whole curve left and up, and 4 mmol·L⁻¹ arrives 44 percentage points earlier — a clearance defect. Schematic curves; discriminating features after Lien et al. (2019), Snell et al. (2013) and Haunhorst et al. (2022).
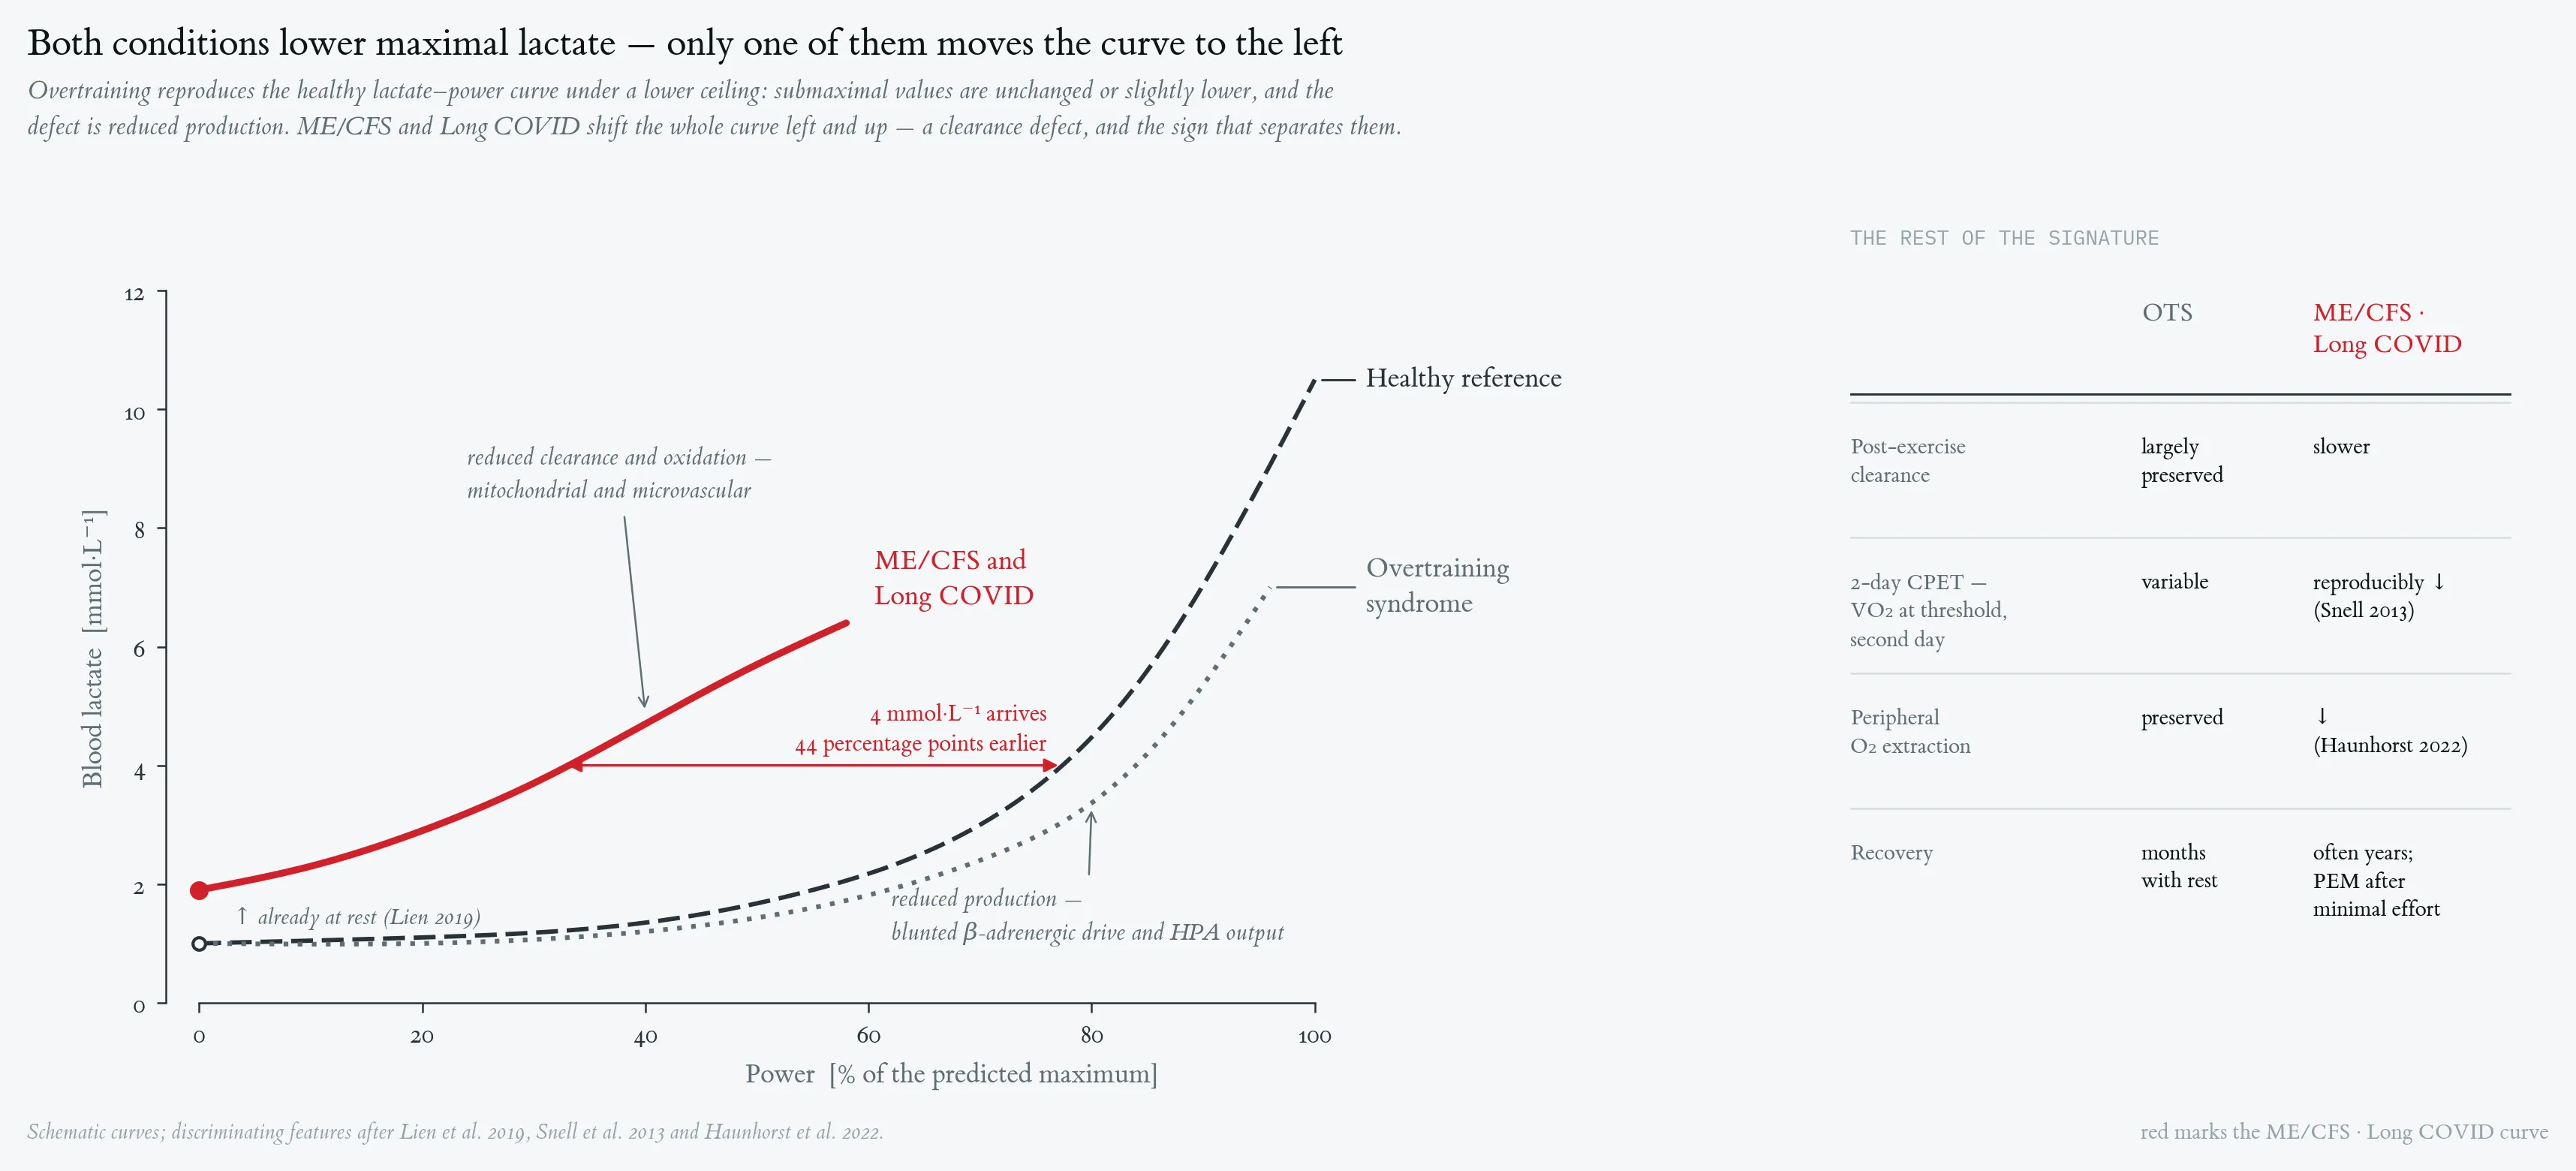
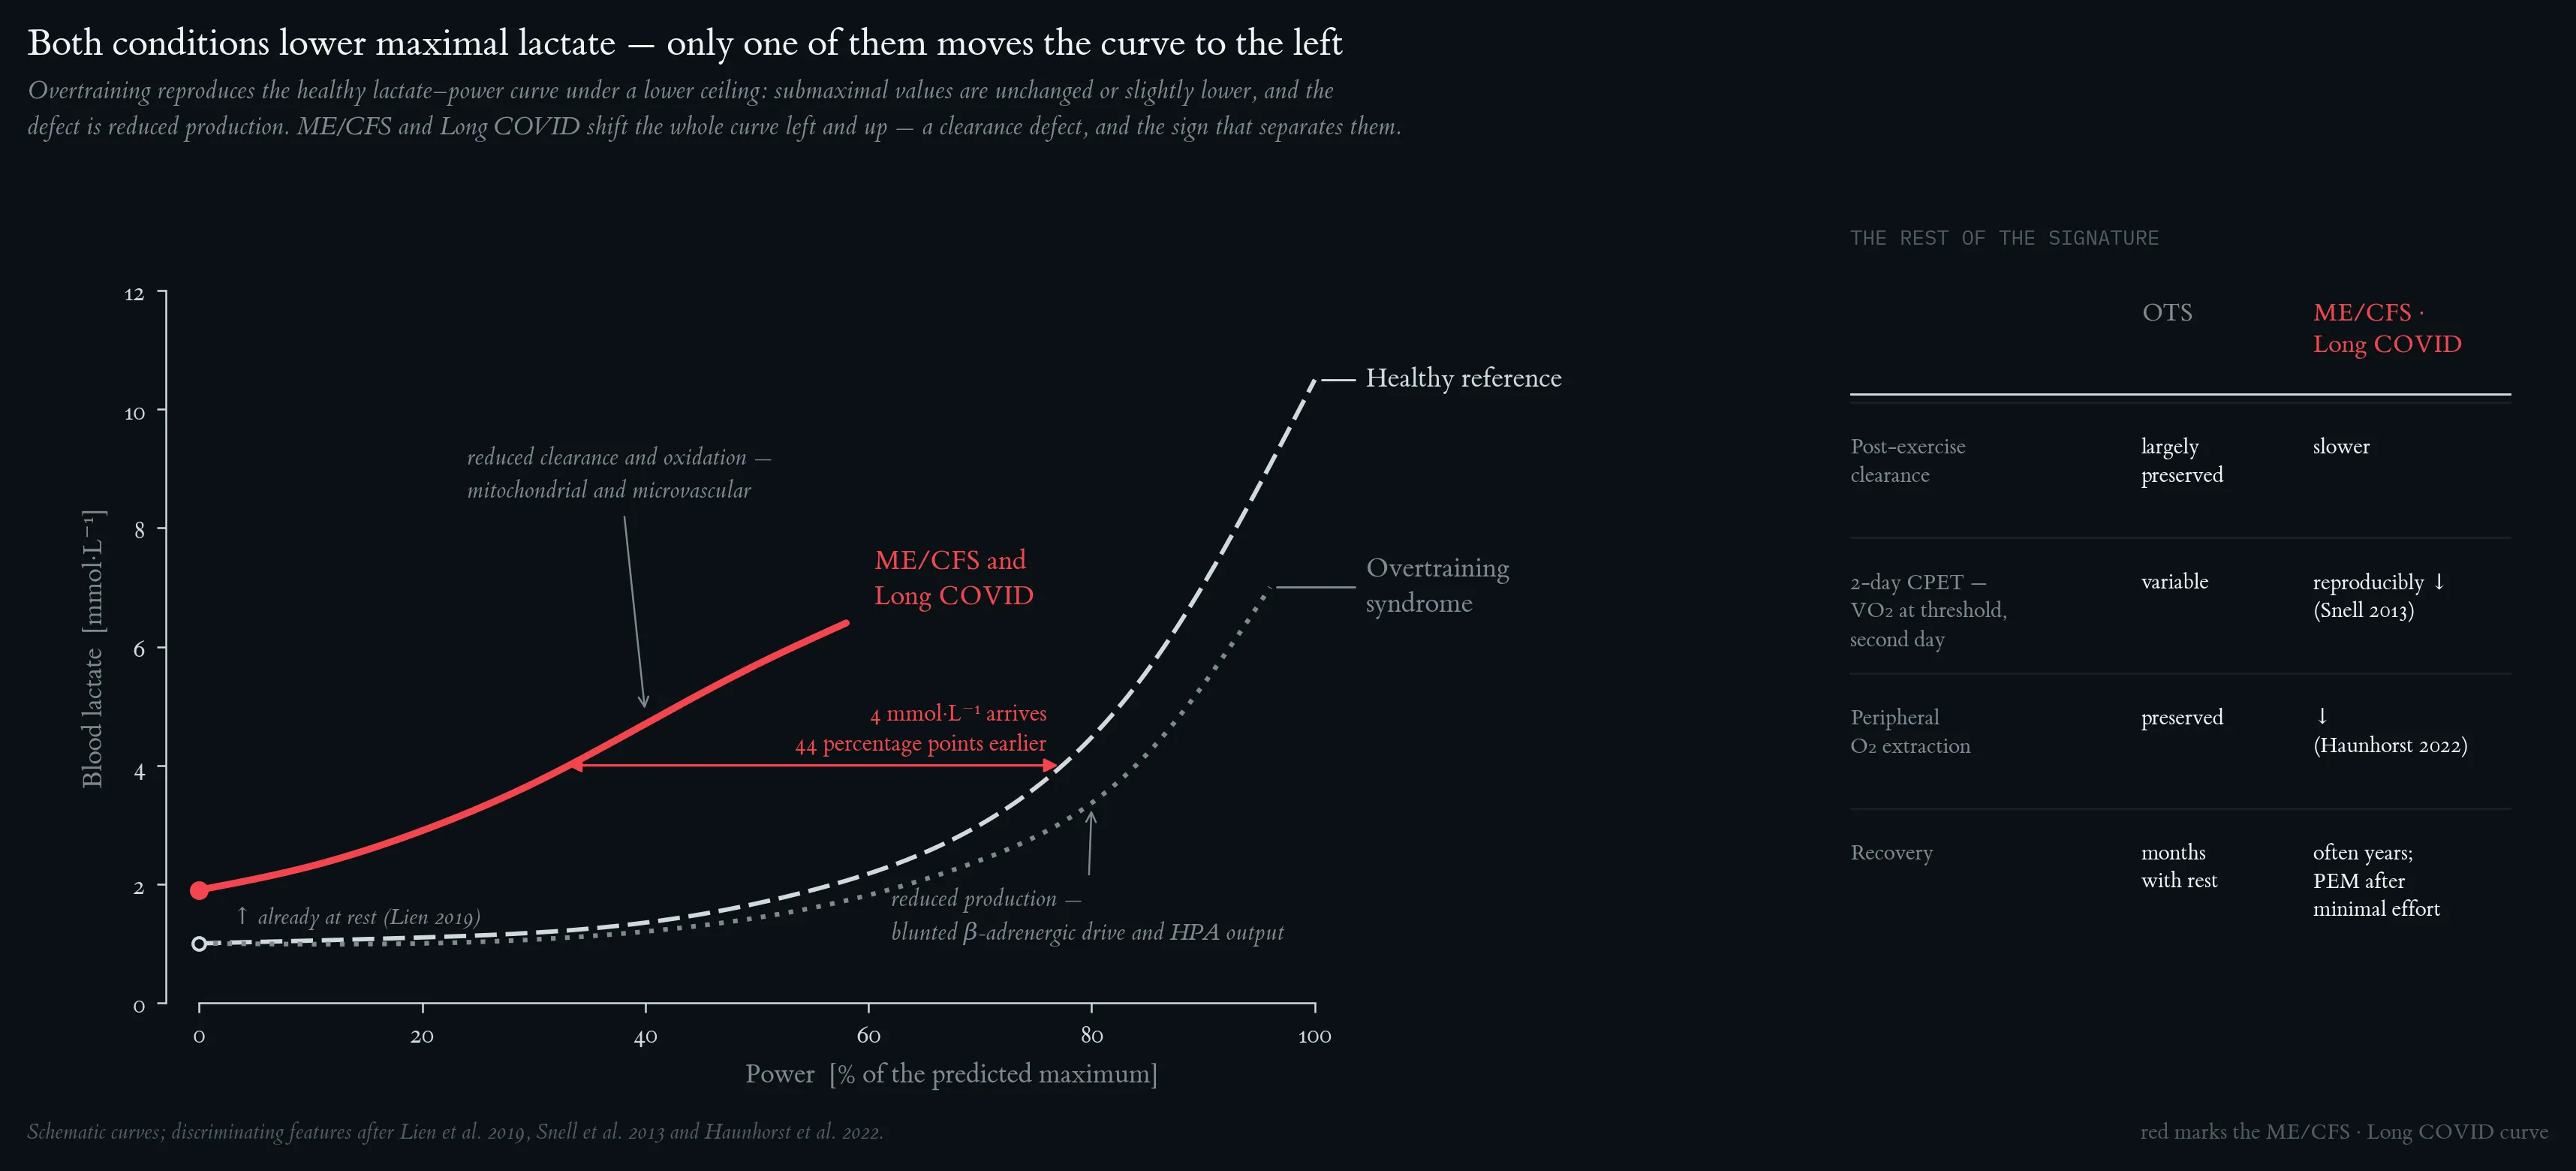
Both conditions lower maximal lactate, but only one moves the curve. Overtraining reproduces the healthy lactate–power curve under a lower ceiling — the defect is reduced production. ME/CFS and Long COVID shift the whole curve left and up, and 4 mmol·L⁻¹ arrives 44 percentage points earlier — a clearance defect. Schematic curves; discriminating features after Lien et al. (2019), Snell et al. (2013) and Haunhorst et al. (2022).
Mechanism in post-infectious syndromes (Haunhorst 2022, 2024; Joseph 2023; Singh 2022):
- Mitochondrial dysfunction (complex I/IV, PDH ↓; PCr resynthesis ↓)
- Reduced MCT1 expression in muscle subgroups
- Endothelial / microvascular dysfunction
- Autonomic dysregulation (POTS overlap)
- Failed lactate-mediated ETC activation (Cai 2023)
- Immunometabolic dysregulation (Haunhorst 2024)
Brooks-shuttle lens: OTS breaks the upstream sympathetic drive that fuels glycolytic production — shuttle machinery intact. Post-infectious syndromes break the downstream oxidative machinery that consumes lactate — the drain is plugged.
Therapeutic consequence (clinically critical):
- OTS → rest (Meeusen 2013)
- ME/CFS / Long COVID with PEM → pacing within energy envelope — graded exercise can worsen the condition (Haunhorst 2024)
Same lactate-curve abnormality at face value can require opposite therapy depending on whether the defect is autonomic exhaustion or mitochondrial-microvascular dysfunction.
Mixed phenotypes (overtrained athlete + EBV/SARS-CoV-2 infection) are common and require the Meeusen 2013 flowchart expanded with microvascular/immunometabolic work-up.
4.2 Open Questions
- MCT1/MCT4 expression in OTS muscle? (Brooks 2022)
- Histone lactylation as persistence mechanism?
- Does impaired lactate signaling underlie blunted T-cell response in OTS? (Cai 2023)
- OTS as non-infectious analog of PEM in ME/CFS / Long COVID?
- Sex differences + RED-S interactions under-studied
- Multicenter validation of two-bout test
One-Minute-Paper Topics
A One-Minute-Paper (OMP) is a short, focused prompt that students answer in ~60 seconds at the end of a session to consolidate learning, surface misconceptions, and provide formative feedback. When answering, be concise, specific, and use terminology from today’s session.
- Argue for or against: OTS as a non-infectious PEM analog.
- A fatigued athlete shows elevated resting lactate, left-shifted lactate-power curve, and reproducible day-2 VO₂ drop on 2-day CPET. OTS or post-infectious? What therapy is contraindicated, and why?
Key References
- Haunhorst S, … Puta C (2022). Long COVID: putative pathophysiology & physical activity. Oxford Open Immunology, 3(1), iqac006.
- Haunhorst S, … Puta C et al. (2024). Physical activity-induced PEM: microvascular alterations & immunometabolic interactions in post-COVID & ME/CFS. Infection.
- Lien et al. (2019). Elevated resting lactate correlates with PEM severity in ME/CFS. Sci Rep, 9, 19181.
- Singh et al. (2022). Persistent exertional intolerance after COVID-19: invasive CPET. Chest, 161(1), 54–63.
- Joseph et al. (2023). Exercise pathophysiology in ME/CFS and PASC. Chest, 164(3), 717–726.
- Snell et al. (2013). Discriminative validity of 2-day CPET in CFS. Phys Ther, 93(11), 1484–1492.
References
- Achten et al. (2004). Higher CHO during intensified training. J Appl Physiol, 96, 1331–1340.
- Bosquet et al. (2008). HR & overreaching: systematic review. BJSM, 42, 709–714.
- Brooks et al. (2022). Tracing the lactate shuttle to the mitochondrial reticulum. Exp Mol Med, 54, 1332–1347.
- Cai et al. (2023). Lactate activates the mitochondrial electron transport chain independently of its metabolism. Mol Cell, 83, 3904–3920.
- Foster (1998). Monitoring training with reference to OTS. MSSE, 30, 1164–1168.
- Fry et al. (1994). Psychological & immunological correlates of acute overtraining. BJSM, 28(4), 241–246.
- Gabriel et al. (1998). Overtraining and immune system. MSSE, 30(7), 1151–1157.
- Gleeson (2002). Biochemical & immunological markers of overtraining. JSSM, 1, 31–41.
- Hackney & Koltun (2012). Immune system & overtraining: clinical implications. Acta Clin Croat, 51, 633–641.
- Haunhorst S, … Puta C (2022). Long COVID: putative pathophysiology & physical activity. Oxford Open Immunology, 3(1), iqac006.
- Haunhorst S, … Puta C et al. (2024). Physical activity-induced PEM: microvascular alterations & immunometabolic interactions in post-COVID & ME/CFS. Infection.
- Hedelin et al. (2000). Cardiac autonomic imbalance in an overtrained athlete. MSSE, 32(9), 1531–1533.
- Israel S (1976). Zur Problematik des Übertrainings. Medizin und Sport, 16, 1–12.
- Joseph et al. (2023). Exercise pathophysiology in ME/CFS and PASC. Chest, 164(3), 717–726.
- Kistner TM, Pedersen BK, Lieberman DE (2022) Interleukin 6 as an energy allocator in muscle tissue. Nat Metab 4:170-179.
- Kreher & Schwartz (2012). Overtraining Syndrome: A Practical Guide. Sports Health, 4(2), 128–138.
- Lehmann et al. (1998). Autonomic imbalance hypothesis & OTS. MSSE, 30(7), 1140–1145.
- Lien et al. (2019). Elevated resting lactate correlates with PEM severity in ME/CFS. Sci Rep, 9, 19181.
- Meeusen et al. (2013). ECSS/ACSM Joint Consensus on OTS. MSSE, 45(1), 186–205.
- Morgan et al. (1987). Psychological monitoring of overtraining and staleness. BJSM, 21(3), 107–114.
- Radak et al. (2008). Exercise, oxidative stress and hormesis. Ageing Res Rev, 7, 34–42.
- Singh et al. (2022). Persistent exertional intolerance after COVID-19: invasive CPET. Chest, 161(1), 54–63.
- Smith (2000). Cytokine hypothesis of overtraining. MSSE, 32(2), 317–331.
- Snell et al. (2013). Discriminative validity of 2-day CPET in CFS. Phys Ther, 93(11), 1484–1492.
- Urhausen et al. (1998). Ergometric & psychological findings during overtraining. IJSM, 19, 114–120.