Energy Expenditure, MET-concept, Thresholds, Determine Exercise Intensity
Table of Contents
- Energy Expenditure
- Behaviour and V̇O₂
- Threshold Concepts
- Determining and Monitoring Exercise Intensity
1 Energy Expenditure
Learning objectives:
- BMR and RMR: measurement conditions, the FAO/WHO prediction equations, and their determinants
- The five factors affecting metabolic rate, and typical total daily energy expenditure
- Calorimetry, the caloric equivalent of oxygen, the Weir formula, and RQ versus RER
Any physical activity consumes energy. Even in an apparently inactive state, the organism needs energy. The energy consumption during physical inactivity and physical activity can be estimated and measured. Both exact measurements and estimates can be useful and valuable in practice, depending on the goal.
1.1 Basal Metabolic Rate (BMR)
The basal metabolic rate (BMR) reflects the sum total of the body’s many avenues for heat production — measured under stringent laboratory conditions (postabsorptive state, no prior physical activity, supine rest for 30 min in a thermoneutral environment). Oxygen consumption values for BMR typically range between 160–290 mL·min⁻¹ (0.8–1.43 kcal·min⁻¹) depending on sex, age, body size, and fat-free body mass (FFM).
BMR prediction formulae (FAO/WHO/UNU 2004):
FAO/WHO/UNU equations for predicting basal metabolic rate by sex and age. To convert MJ·day⁻¹ to kcal·day⁻¹, multiply the result by 239.
| Sex | Age (years) | Formula (MJ·day⁻¹) |
|---|---|---|
| Women | 10–18 | BMR = 0.056 × body mass [kg] + 2.898 |
| Women | 19–30 | BMR = 0.062 × body mass [kg] + 2.036 |
| Women | 31–60 | BMR = 0.034 × body mass [kg] + 3.538 |
| Women | >60 | BMR = 0.038 × body mass [kg] + 2.755 |
| Men | 10–18 | BMR = 0.074 × body mass [kg] + 2.754 |
| Men | 19–30 | BMR = 0.063 × body mass [kg] + 2.896 |
| Men | 31–60 | BMR = 0.048 × body mass [kg] + 3.653 |
| Men | >60 | BMR = 0.049 × body mass [kg] + 2.459 |
FAO/WHO/UNU equations for predicting basal metabolic rate by sex and age. To convert MJ·day⁻¹ to kcal·day⁻¹, multiply the result by 239.
The FAO/WHO/UNU equations plotted for the two adult age bands. BMR rises linearly with body mass, and the sex difference is larger than the age difference across the whole range. Worked example: a 30-year-old man of 75 kg is predicted at 7.62 MJ·day⁻¹ ≈ 1821 kcal·day⁻¹ (FAO/WHO/UNU 2004).
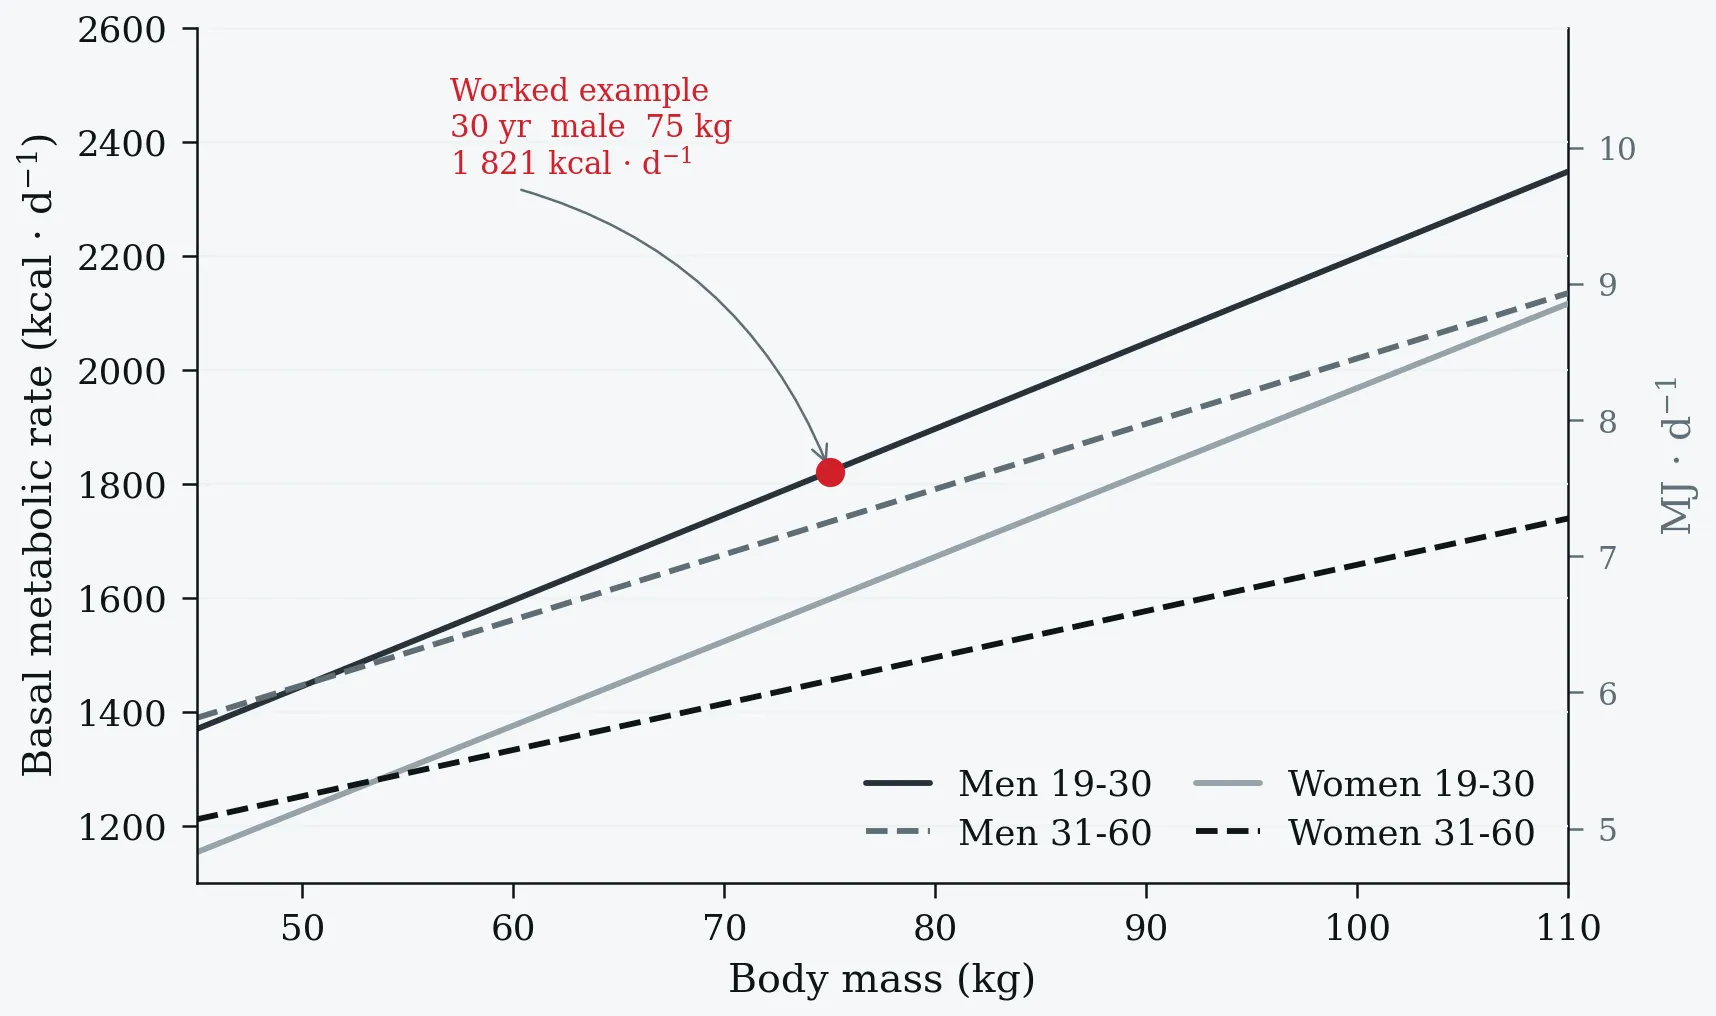
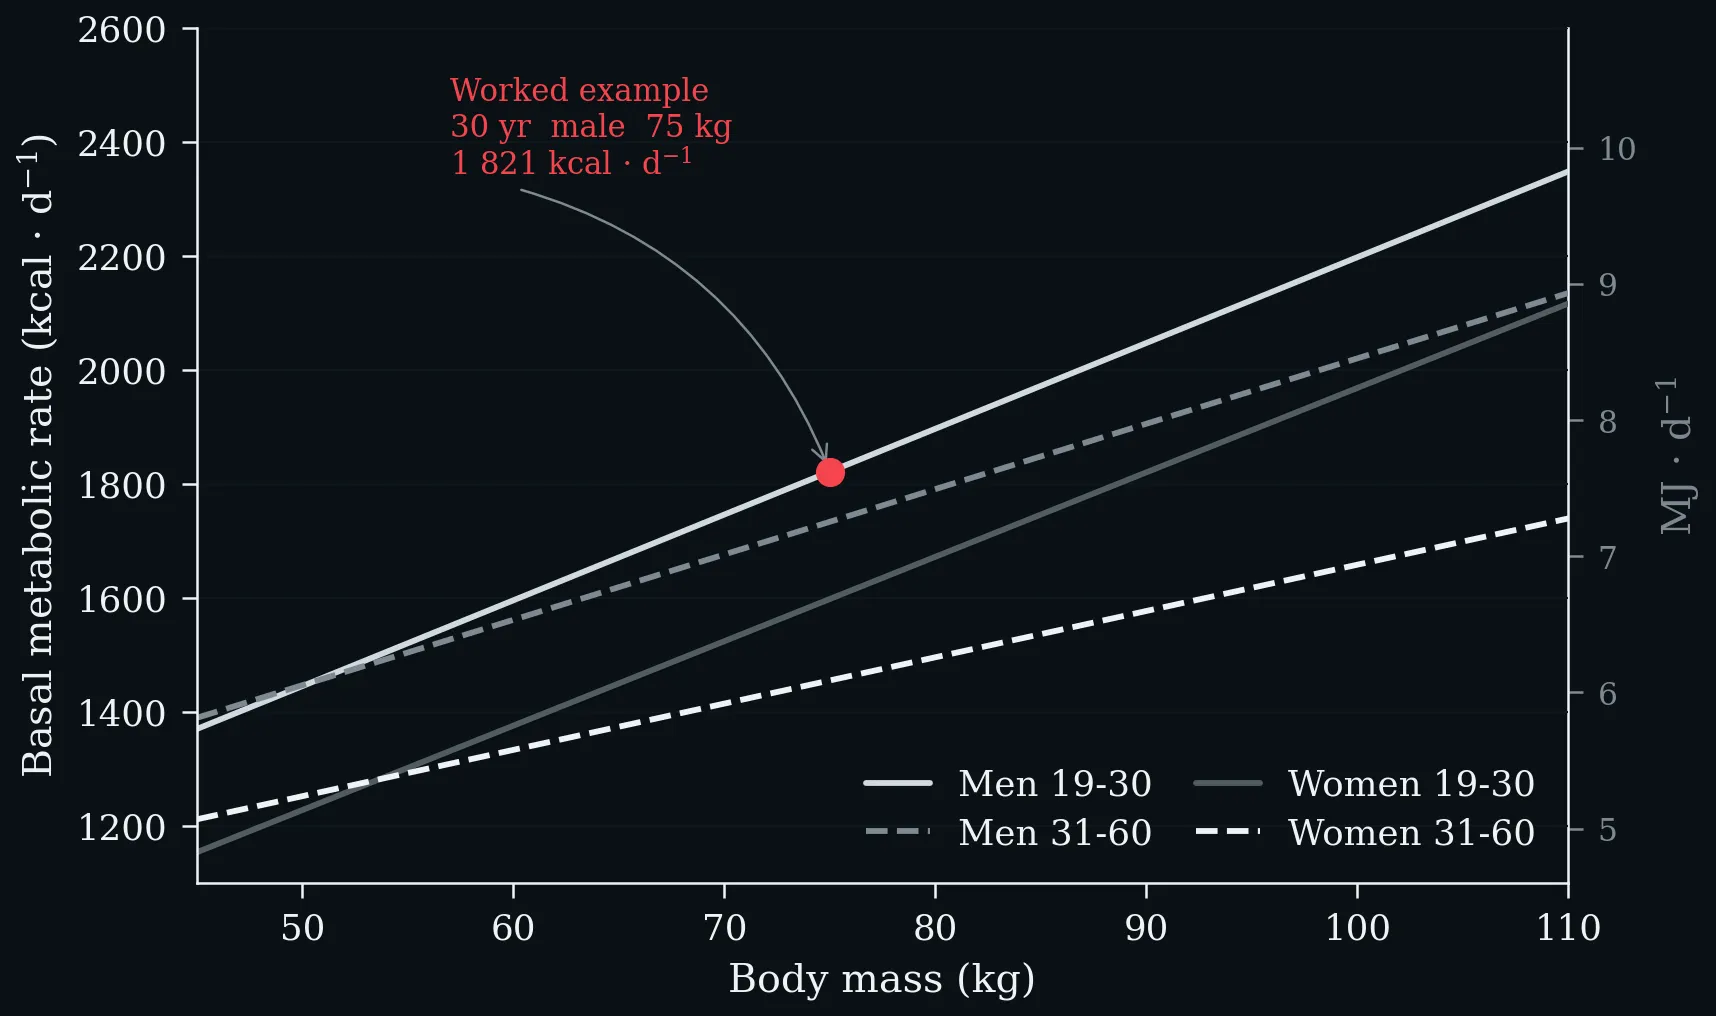
The FAO/WHO/UNU equations plotted for the two adult age bands. BMR rises linearly with body mass, and the sex difference is larger than the age difference across the whole range. Worked example: a 30-year-old man of 75 kg is predicted at 7.62 MJ·day⁻¹ ≈ 1821 kcal·day⁻¹ (FAO/WHO/UNU 2004).
1.2 Basal vs. Resting Metabolic Rate
The resting metabolic rate (RMR) is measured 3–4 hours after a light meal without prior physical activity. BMR is always slightly lower than RMR. Both show high reproducibility under standardised conditions. RMR, like BMR, decreases with age from variations in fat-free body mass (FFM). The RMR for men generally exceeds values for women of similar body size.
1.3 Total Daily Energy Expenditure (TDEE)
Five major factors affect metabolic rate:
- Physical activity
- Diet-induced thermogenesis
- Calorigenic effect of food on exercise metabolism
- Climate
- Pregnancy
Physical activity exerts the greatest effect on metabolic rate. At rest, muscles generate about 20 % of the body’s total energy expenditure. During all-out effort, skeletal muscle energy expenditure can increase more than 100 times above resting value to account for nearly 85 % of total EE.
TDEE averages: 2,900 kcal for men and 2,200 kcal for women aged 19–50 years.
1.4 Energy and Physical Activity
Different classification systems rate the strenuousness of physical activities based on: (1) ratio of energy cost to resting energy requirement; (2) oxygen requirement in mL·kg⁻¹·min⁻¹; or (3) multiples of resting metabolism as METs. Heavier individuals expend more total energy, particularly in weight-bearing activities.
1.5 Energy Expenditure Measurement
Direct calorimetry measures heat production in an insulated calorimeter. Indirect calorimetry infers EE from O₂ consumption and CO₂ production using open- or closed-circuit spirometry. The doubly labelled water technique estimates EE in free-living conditions and serves as a gold standard for validating long-term EE estimates.
1.6 V̇O₂ and Energy
Oxygen uptake directly measures energy expenditure. Average caloric yield:
- 1 litre O₂ from mixed diet ≈ 4.8 kcal (≈20 kJ)
- 1 litre O₂ from glucose exclusively ≈ 5.0 kcal (≈21 kJ) — caloric equivalent of glucose
- 1 litre O₂ from fat ≈ 4.7 kcal (≈19.6 kJ)
- 1 litre O₂ from protein ≈ 4.67 kcal (≈18.8 kJ)
1.7 Energy Expenditure Calculation — Weir Formula
Weir (1949) presented a simple method accurate to within ±1 % of the traditional RQ method:
kcal·min⁻¹ = V̇E(STPD) × (1.044 − 0.0499 × %O₂E)
where V̇E(STPD) = expired minute ventilation (L·min⁻¹) corrected to STPD conditions, and %O₂E = expired oxygen percentage. The value in parentheses is the “Weir factor.” Alternatively:
kcal·min⁻¹ = ([1.1 × RQ] + 3.9) × V̇O₂
1.8 RQ vs. RER
The respiratory quotient (RQ) reflects macronutrient catabolism at the cellular level:
Respiratory quotient (RQ) for the complete catabolism of carbohydrate, fat, and protein.
| Substrate | Reaction | RQ |
|---|---|---|
| Carbohydrate | C₆H₁₂O₆ + 6 O₂ → 6 CO₂ + 6 H₂O | 1.00 |
| Fat (palmitic acid) | C₁₆H₃₂O₂ + 23 O₂ → 16 CO₂ + 16 H₂O | 0.696 |
| Protein (albumin) | C₇₂H₁₁₂N₂O₂₂S + 77 O₂ → 63 CO₂ + … | 0.818 |
Respiratory quotient (RQ) for the complete catabolism of carbohydrate, fat, and protein.
The respiratory exchange ratio (RER) reflects pulmonary gas exchange and may diverge from RQ during hyperventilation or exhaustive exercise (RER > 1.00). RER does not fully mirror the macronutrient mixture catabolised under all physiological conditions.
One-Minute-Paper Topics
A One-Minute-Paper (OMP) is a short, focused prompt that students answer in ~60 seconds at the end of a session to consolidate learning, surface misconceptions, and provide formative feedback. When answering, be concise, specific, and use terminology from today’s session.
- What stringent conditions must be met to measure a true basal metabolic rate? Using the FAO/WHO/UNU equations, estimate the BMR of a 30-year-old man weighing 75 kg and convert the result to kcal·day⁻¹.
- The lecture identifies five major factors affecting metabolic rate. Rank them by quantitative impact on TDEE for a recreational endurance athlete, and justify your ranking.
- State the Weir formula. Which two variables does it require, and why is indirect calorimetry more practical than direct calorimetry in an exercise setting?
- Distinguish the respiratory quotient (RQ) from the respiratory exchange ratio (RER). Under what conditions do they diverge, and what does an RER > 1.00 indicate during exhaustive exercise?
- The caloric yield per litre of O₂ differs by substrate (~4.7 kcal for fat, ~5.0 kcal for glucose). Why is a mixed-diet average of ~4.8 kcal·L⁻¹ used in practice, and when would substrate-specific values matter?
- What does the doubly labelled water technique measure, and why does it serve as a gold standard for validating long-term energy expenditure estimates?
Key References
- FAO/WHO/UNU. Human Energy Requirements — Report of a Joint FAO/WHO/UNU Expert Consultation. FAO Food and Nutrition Technical Report Series 1, Rome, 2004.
- Weir JB de V. New Methods for Calculating Metabolic Rate with Special Reference to Protein Metabolism. Journal of Physiology 109 (1–2), 1949: 1–9.
2 Behaviour and V̇O₂
Learning objectives:
- Oxygen as the essential substrate of energy supply: organ utilisation, deficiency tolerance, and ROS
- Normoxia, tissue acidosis, and pulmonary gas exchange after Fick’s first law
- V̇O₂ and MET as intensity measures — the 3.5 mL·kg⁻¹·min⁻¹ convention, MET ≠ MET, and MET-minutes
2.1 Physical Performance, Activity and Behaviour
From a biological point of view, movement is a vital skill enabling physical performance, physical activity, and behaviour. A minimum level of physical fitness is required to be physically active. Physical performance and physical activity are the main determining factors for behaviour in everyday life, at work, and in leisure time.
2.2 Oxygen — Essential for Energy Supply
Oxygen (O₂) is essential for the energy supply of cells. A prolonged lack of O₂ — usually the result of a circulatory disorder — initially leads to functional failures and later to irreversible cell and organ damage. There are no significant oxygen stores in cells, and oxygen-independent metabolism is insufficient for energy requirements. Therefore, sufficient O₂ must be constantly supplied via the circulatory system.
O₂ utilisation by organ:
- Kidneys: ~25 % O₂ utilisation
- Cerebral cortex, skeletal muscles, myocardium (rest): 40–60 %
- Working skeletal muscles and myocardium (heavy exercise): up to ~90 %
During exercise, O₂ consumption of cardiac muscle tissue increases 3–4 times above resting conditions; working skeletal muscle groups increase to more than 20–50 times the resting value.
Adaptation to O₂ deficiency. Depending on duration and extent, O₂ deficiency leads to limitations in organ function or cell death. In neurons, irreversible damage occurs after less than 10 minutes of anoxia; in skeletal muscles only after several hours. For the whole organism, the resuscitation time is approximately 4 minutes at normal body temperature.
Too much oxygen can be harmful — oxygen radicals damage cell membranes, enzymes and DNA. Reactive oxygen species continuously formed in cells play an important role as signalling molecules at low concentrations but cause cell damage at high concentrations.
2.3 V̇O₂ and Daily Behaviour
Any type of physical activity and therefore behaviour requires energy. The amount of oxygen required for energy metabolism is supplied via pulmonary respiration and transported via blood to organs such as skeletal muscles.
Exercise intensity classification by oxygen uptake (V̇O₂), after the ACSM Guidelines for Exercise Testing and Prescription.
| Intensity Level | V̇O₂ (mL·kg⁻¹·min⁻¹) |
|---|---|
| Very light | < 7.0 |
| Light | ≥ 7.0 and < 10.5 |
| Moderate | ≥ 10.5 and < 21.0 |
| Vigorous | ≥ 21.0 and < 30.8 |
| Near-maximal to maximal | ≥ 30.8 |
Exercise intensity classification by oxygen uptake (V̇O₂), after the ACSM Guidelines for Exercise Testing and Prescription.
2.4 V̇O₂ as a Measure of Energy Expenditure
Oxygen uptake provides information about the energy requirements and energy consumption of the organism. When providing energy, oxygen consumption depends on the type of energy source: fats require more oxygen to burn than carbohydrates or proteins, resulting in different physiological calorific values.
2.5 Normoxia and Energy Supply
Normoxia means that sufficient O₂ is available at all times for all tasks of a cell, tissue or organ. Under normoxic conditions the O₂ requirement for the respiratory chain is covered by a corresponding O₂ supply.
The short-term increase in O₂ supply can be achieved through increased blood flow; in the medium term through increased O₂ capacity of the blood. Various hormones, body temperature, and mitochondrial uncoupling proteins (e.g. UCP1) influence basal O₂ consumption. Consumption-increasing hormones include catecholamines and thyroid hormones.
2.6 O₂ Deficiency and Energy Supply
O₂ deficiency leads to severely restricted ATP formation. Anaerobic glycolysis cannot compensate for a disruption in O₂ supply in the long term. The resulting lactate and protons transported from cells into the extracellular space can lead to tissue acidosis.
Composition and partial pressures of the main constituents of dry air at sea level.
| Component | Volume (%) | Partial pressure (mmHg) |
|---|---|---|
| N₂ | 78.09 | 593.45 |
| O₂ | 20.95 | 159.21 |
| Ar | 0.927 | 7.04 |
| CO₂ | 0.039 | 0.293 |
Composition and partial pressures of the main constituents of dry air at sea level.
2.7 Breathing and Gas Exchange
Gas exchange occurs in the alveoli by diffusion. After ventilation transports O₂-rich gas into the alveoli, O₂ is absorbed into the blood and CO₂ released. The 1st Fick diffusion law describes pulmonary gas exchange: diffusion current is proportional to the partial pressure difference and exchange area, and inversely proportional to layer thickness. The Krogh diffusion constant for CO₂ is approximately 20 times that of O₂.
At rest:
- Alveolar O₂ fraction: 14 % by volume; O₂ partial pressure: ~100 mmHg
- Alveolar CO₂ fraction: 5.6 % by volume; CO₂ partial pressure: ~40 mmHg
The diffusion capacity for adults at rest is normally 30 mL·min⁻¹·mmHg⁻¹. Contact time for equilibration of partial pressures in the pulmonary capillaries: approximately 0.3–0.7 s.
2.8 MET — Metabolic Equivalents of Task
2.8.1 Physical Activity Levels
The metabolic equivalent (MET) is an index of energy expenditure. One MET is the rate of EE while sitting at rest; by scientific convention, 1 MET = 3.5 mL·kg⁻¹·min⁻¹ O₂ uptake = 1 kcal·kg⁻¹·h⁻¹.
Left: physical activity classification by MET range, after the Compendium of Physical Activities (Ainsworth et al. 2011), with the corresponding ACSM V̇O₂ cut-points on the upper axis. Right: the same activities recalculated for an individual whose resting metabolic rate is 2.8 instead of the conventional 3.5 mL·kg⁻¹·min⁻¹ — every tabulated MET value rises by 25 %.
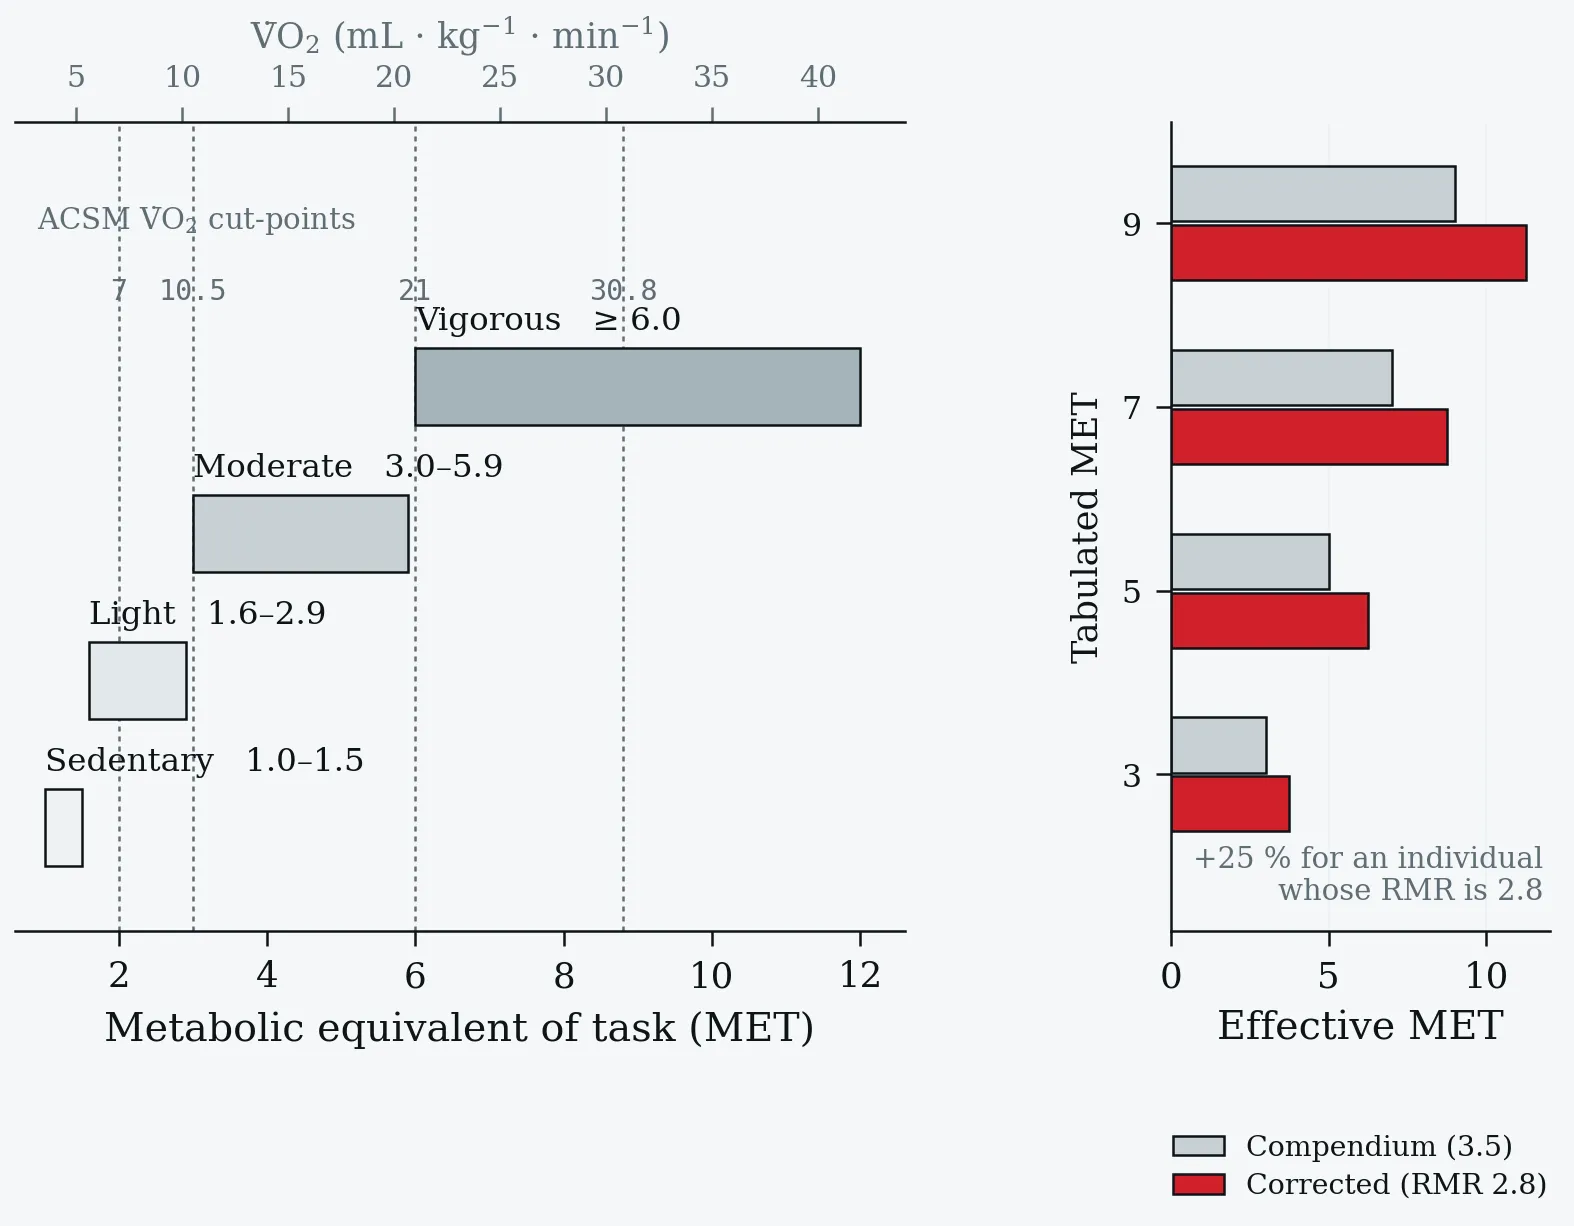
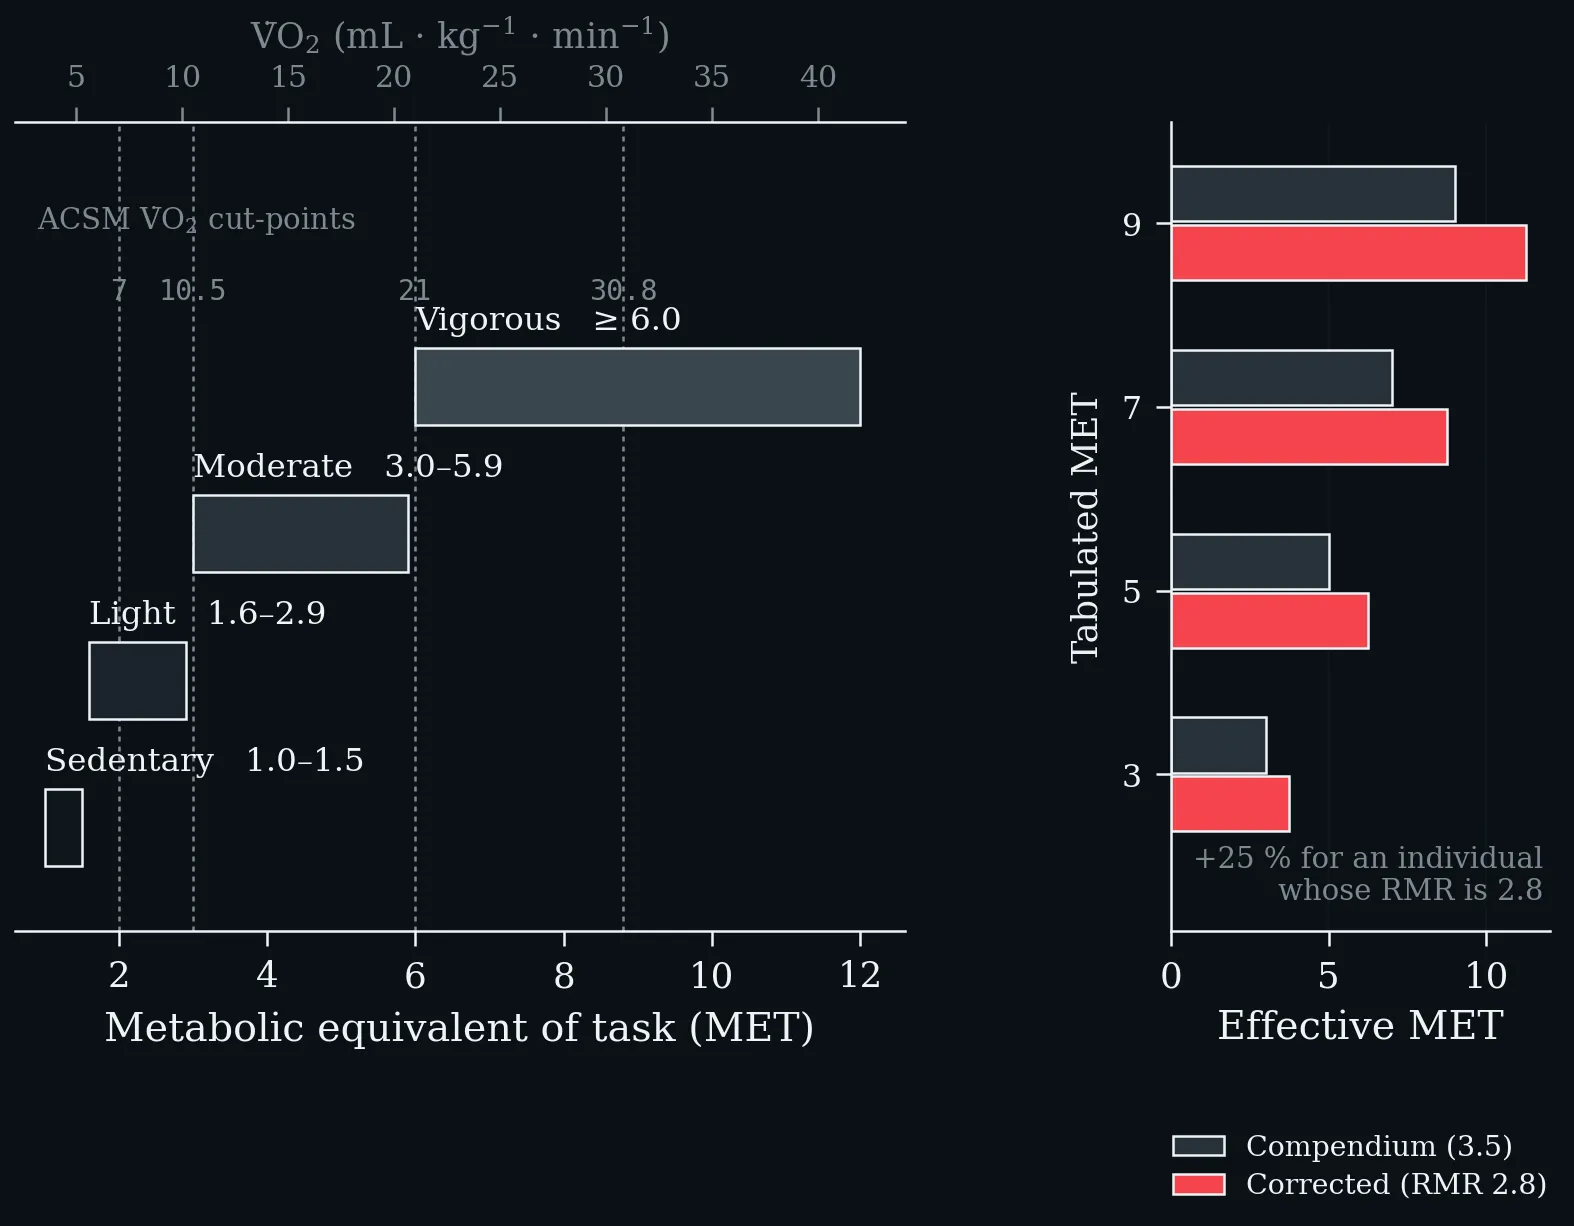
Left: physical activity classification by MET range, after the Compendium of Physical Activities (Ainsworth et al. 2011), with the corresponding ACSM V̇O₂ cut-points on the upper axis. Right: the same activities recalculated for an individual whose resting metabolic rate is 2.8 instead of the conventional 3.5 mL·kg⁻¹·min⁻¹ — every tabulated MET value rises by 25 %.
2.8.2 What Is MET?
1 MET corresponds to 3.5 mL·kg⁻¹·min⁻¹. Most source studies catalogued in the 2011 Compendium reported energy costs as either V̇O₂ (mL·kg⁻¹·min⁻¹) or MET using 3.5 as the denominator (Ainsworth et al. 2011). There are differences between the standard denominator and the real RMR. For an individual with a predicted RMR = 2.8 mL·kg⁻¹·min⁻¹, the corrected MET would be 3.5/2.8 = 125 % of Compendium values.
2.8.3 MET ≠ MET?
1 MET is not always the same amount of V̇O₂. The standard 3.5 mL·kg⁻¹·min⁻¹ is a convention; individual resting metabolic rate differs. The Compendium MET level for any physical activity can be multiplied by the ratio (standard MET / individual predicted RMR) for individual correction.
2.9 MET-min
MET-minutes quantify the total amount of physical activity performed in a standardised manner. Calculated as: METs × duration in minutes.
Example: Jogging at 7 METs for 30 min on 3 days/week = 7 × 30 × 3 = 630 MET·min·wk⁻¹
MET-minutes are usually standardised per week or per day and used in physical activity guidelines and epidemiological studies.
One-Minute-Paper Topics
A One-Minute-Paper (OMP) is a short, focused prompt that students answer in ~60 seconds at the end of a session to consolidate learning, surface misconceptions, and provide formative feedback. When answering, be concise, specific, and use terminology from today’s session.
- Define 1 MET in mL·kg⁻¹·min⁻¹ and in kcal·kg⁻¹·h⁻¹. Calculate the weekly MET-minutes for a student who cycles at 8 METs for 30 minutes on three days per week.
- Why does the standard 1 MET = 3.5 mL·kg⁻¹·min⁻¹ misrepresent the energy cost for a person whose predicted RMR is 2.8 mL·kg⁻¹·min⁻¹? State the correction factor and for whom it matters.
- Using the ACSM V̇O₂ classification (very light < 7.0 to near-maximal ≥ 30.8 mL·kg⁻¹·min⁻¹), assign an intensity level to walking at 5 km/h, climbing stairs, and a maximal cycling sprint.
- What happens to ATP formation when the O₂ supply is insufficient, and how does tissue acidosis arise from lactate and proton transport?
- Define normoxia and describe how O₂ delivery is increased in the short term versus the medium term. Name one hormone that increases O₂ consumption.
- State Fick’s first diffusion law as applied to pulmonary gas exchange. Given that the Krogh diffusion constant of CO₂ is about 20 times that of O₂, which gas is affected first when the diffusion distance increases?
Key References
- Ainsworth BE, Haskell WL, Herrmann SD, et al. 2011 Compendium of Physical Activities — A Second Update of Codes and MET Values. Medicine & Science in Sports & Exercise 43 (8), 2011: 1575–1581.
- American College of Sports Medicine. ACSM’s Guidelines for Exercise Testing and Prescription.
3 Threshold Concepts
Learning objectives:
- The anaerobic threshold as the maximum lactate steady state
- The physiological responses that appear above the anaerobic threshold
- First (T1) and second (T2) thresholds across the lactate, gas-exchange, ventilatory and power–duration models
3.1 The Anaerobic Threshold
The anaerobic threshold is a conceptual approach developed to determine the exercise intensity at which arterial blood lactate concentration begins to increase sharply during an incremental exercise test (Wasserman and McIlroy 1964). During such tests, blood lactate accumulation is attributed to inadequate oxygen delivery to contracting muscle resulting in increased rates of glycolysis and lactate production.
The anaerobic threshold represents the maximum lactate steady state — the metabolic point at which muscular lactate formation and elimination from skeletal muscles are just about balanced. From the perspective of gas exchange, this point also represents the maximum equilibrium of oxygen uptake in the organism (Poole et al. 2021).
3.2 Physiological Responses Above the Anaerobic Threshold
- Accelerated muscle glycogen utilisation and anaerobic regeneration of ATP
- Reduced exercise endurance
- Metabolic acidosis
- Delay in V̇O₂ steady state
- Increased V̇CO₂ over that predicted from aerobic metabolism
- Increased PaCO₂ and PETCO₂ with time
- Bohr effect — increasing O₂ extraction from blood rather than decreasing capillary PO₂
- Increased plasma electrolyte concentration
- Haemoconcentration
- Increased production of metabolic intermediaries (e.g. glycerol phosphate, alanine)
- Increased catecholamine levels
- Increased double product (systolic blood pressure × heart rate)
3.3 Threshold Concepts — T1 and T2
The same two thresholds read from two different signals on one work-rate axis. Top: blood lactate first rises above baseline at T1 and reaches the maximal lactate steady state at T2. Bottom: V̇E/V̇O₂ turns upward at the first ventilatory (gas-exchange) threshold and V̇E/V̇CO₂ follows at the respiratory compensation point. The shaded band between them is the transition zone in which metabolism is neither purely aerobic nor sustainably anaerobic (Faude et al. 2009; Meyer et al. 2005).
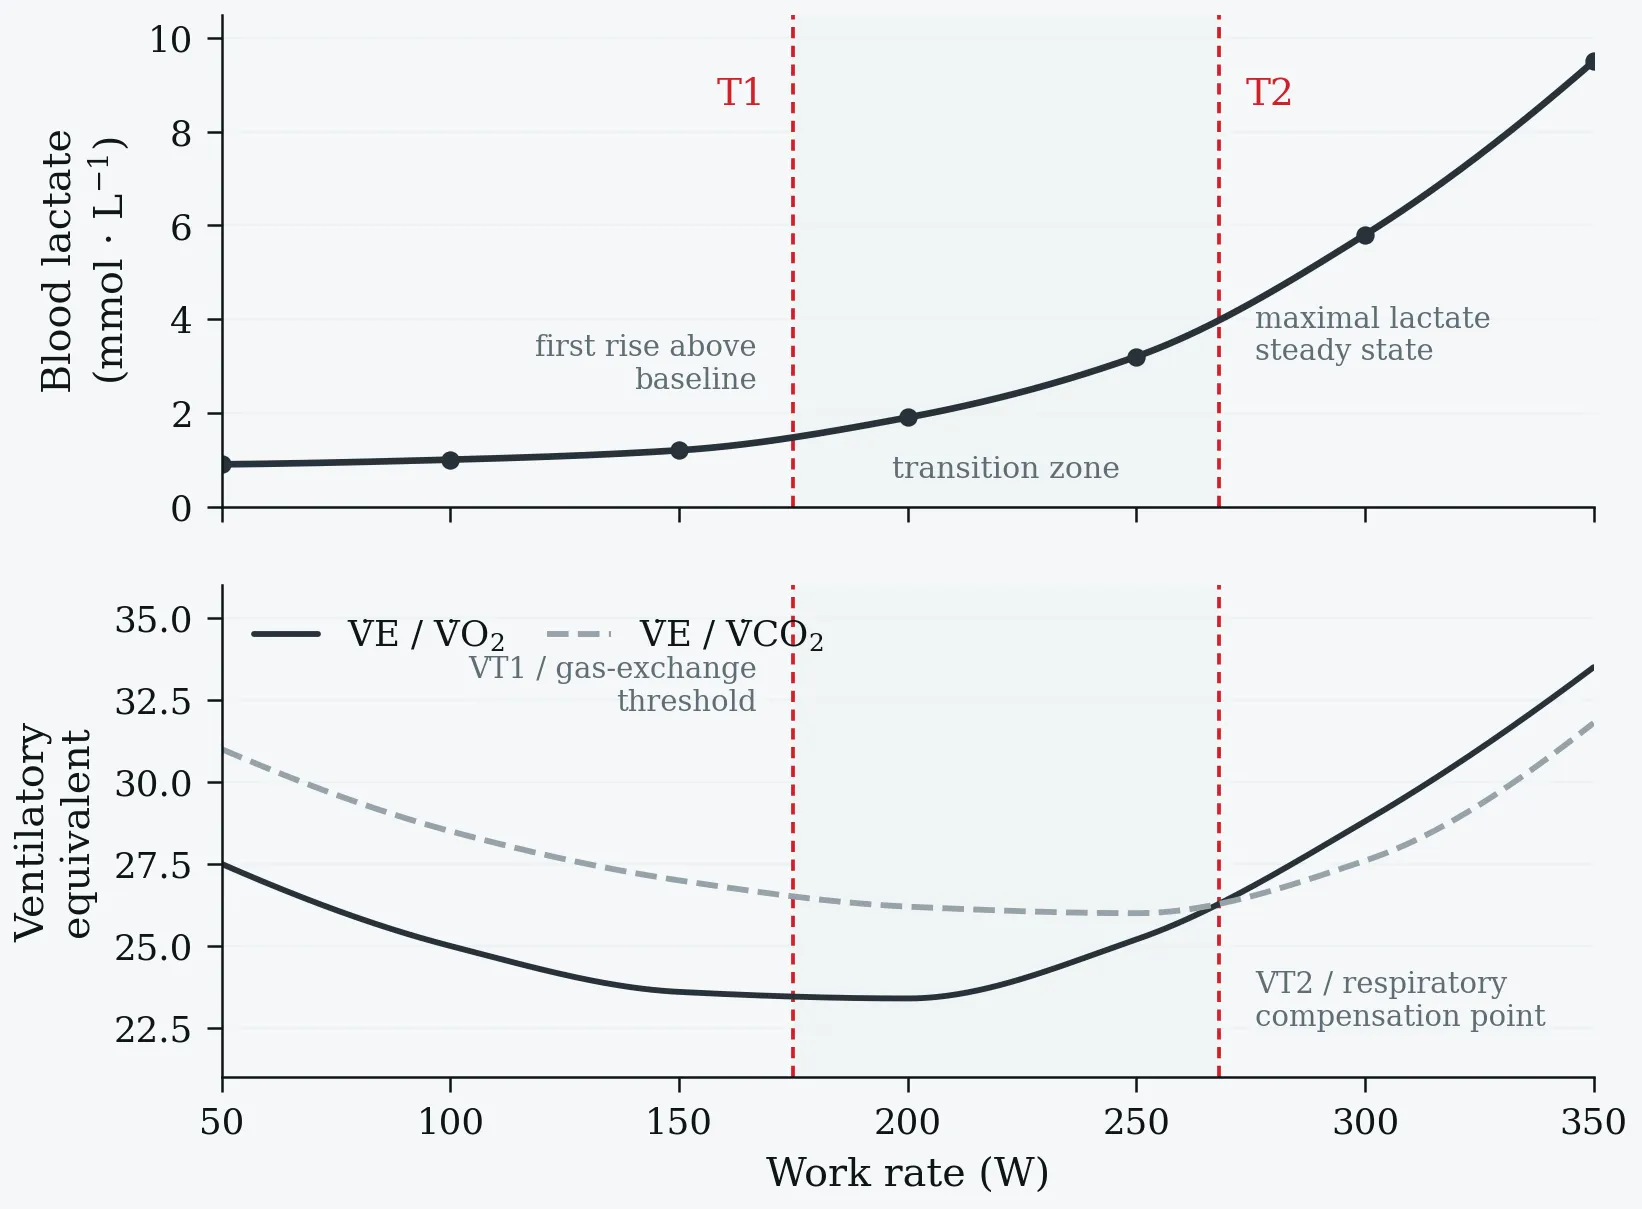
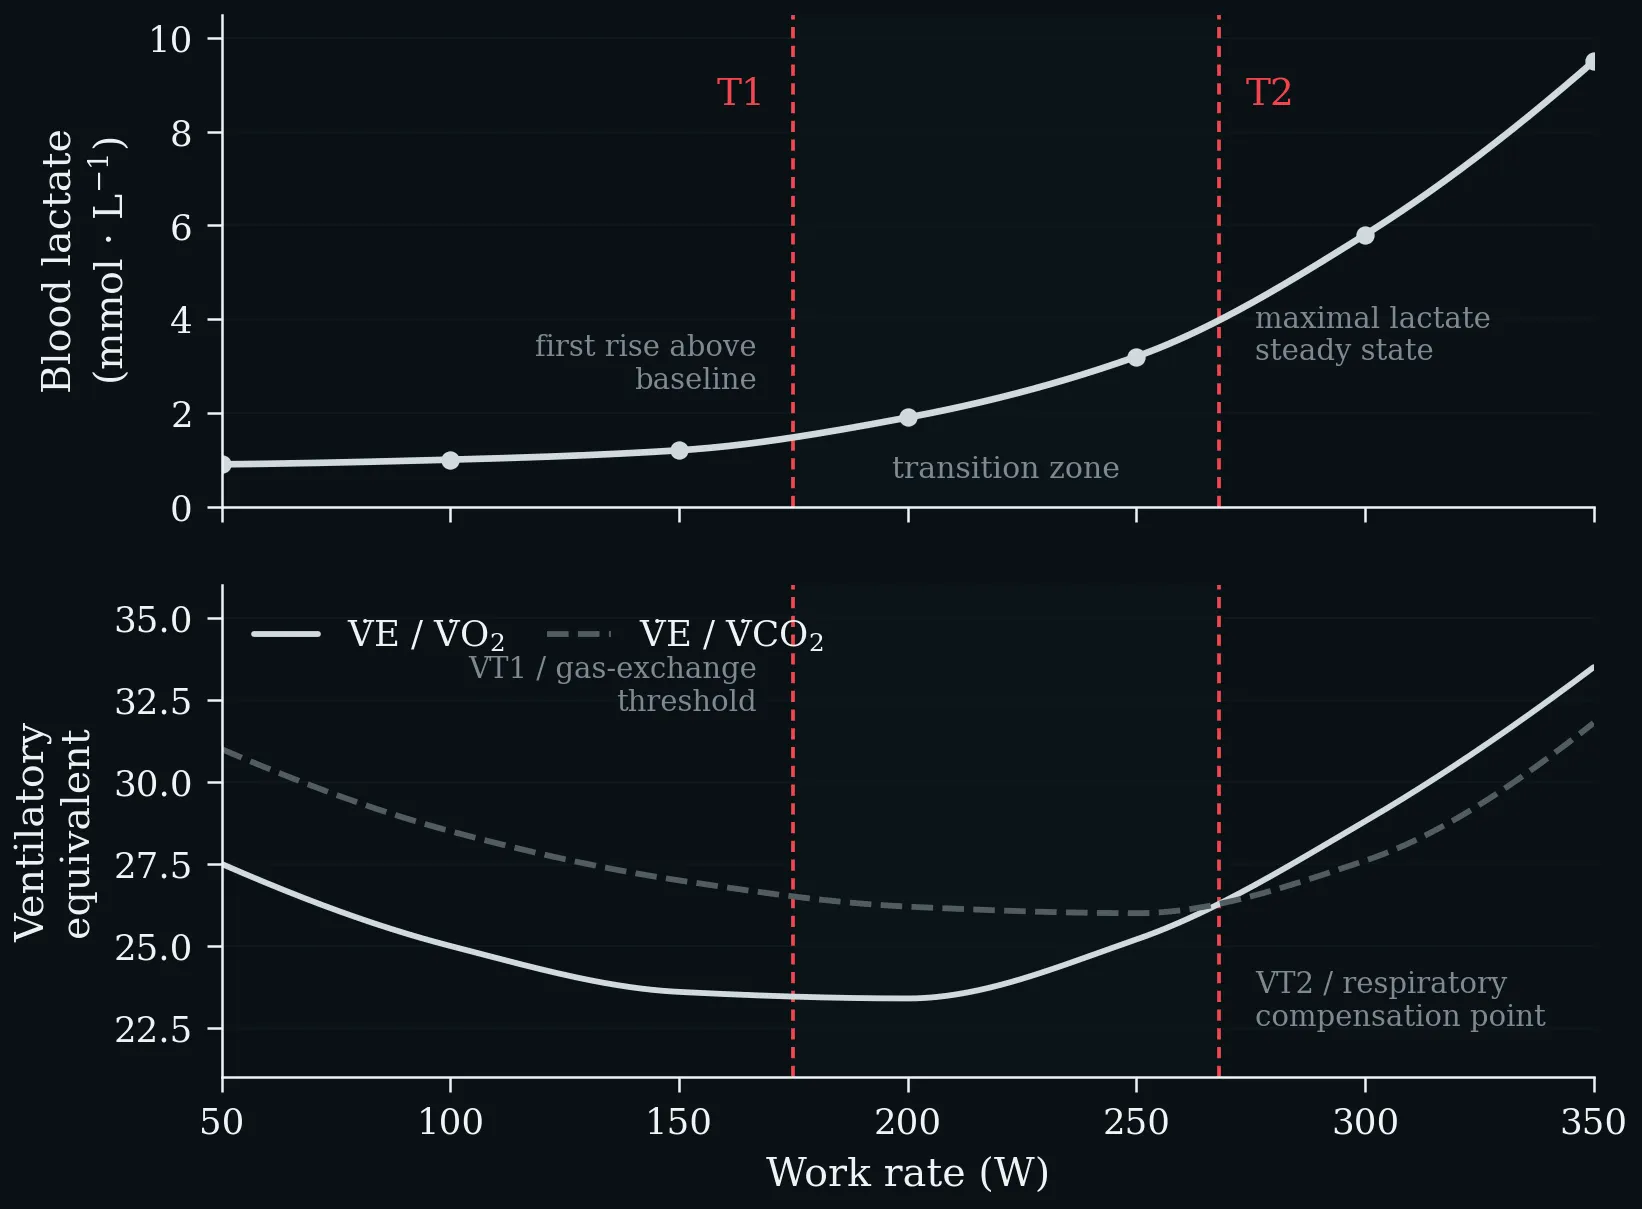
The same two thresholds read from two different signals on one work-rate axis. Top: blood lactate first rises above baseline at T1 and reaches the maximal lactate steady state at T2. Bottom: V̇E/V̇O₂ turns upward at the first ventilatory (gas-exchange) threshold and V̇E/V̇CO₂ follows at the respiratory compensation point. The shaded band between them is the transition zone in which metabolism is neither purely aerobic nor sustainably anaerobic (Faude et al. 2009; Meyer et al. 2005).
First (T1) and second (T2) threshold concepts across the lactate, gas-exchange, ventilatory, and power–duration models (Faude et al. 2009; Meyer et al. 2005).
| Threshold | Concept | Description |
|---|---|---|
| T1 | Lactate threshold | Blood lactate begins to rise above baseline; upper boundary for nearly exclusive aerobic metabolism |
| T1 | Gas exchange threshold | Transition from steady-state to excess CO₂ production |
| T1 | Ventilatory threshold | First breakpoint of systematic increase in V̇E/V̇O₂ |
| T2 | Critical power | Asymptote of the power–duration relationship |
| T2 | Maximum lactate steady-state | Highest constant workload with equilibrium between lactate production and elimination |
| T2 | Respiratory compensation point (RCP) | Second breakpoint of systematic increase in V̇E/V̇O₂ |
First (T1) and second (T2) threshold concepts across the lactate, gas-exchange, ventilatory, and power–duration models (Faude et al. 2009; Meyer et al. 2005).
One-Minute-Paper Topics
A One-Minute-Paper (OMP) is a short, focused prompt that students answer in ~60 seconds at the end of a session to consolidate learning, surface misconceptions, and provide formative feedback. When answering, be concise, specific, and use terminology from today’s session.
- Who first described the anaerobic threshold in cardiac patients, and how is it defined physiologically as the maximum lactate steady state?
- Why does blood lactate accumulate during an incremental test above the threshold? What does the “maximum equilibrium of oxygen uptake” mean from the perspective of gas exchange?
- List five of the twelve physiological responses that occur above the anaerobic threshold, and explain which of them most directly limits endurance performance.
- Compare the first (T1) and second (T2) thresholds across the lactate, ventilatory and gas-exchange models. What does each model measure, and are the concepts interchangeable?
- The responses above the threshold include an increase in the double product. What is the double product, and what does its rise indicate?
Key References
- Faude O, Kindermann W, Meyer T. Lactate Threshold Concepts — How Valid Are They? Sports Medicine 39 (6), 2009: 469–490.
- Meyer T, Lucía A, Earnest CP, Kindermann W. A Conceptual Framework for Performance Diagnosis and Training Prescription from Submaximal Gas Exchange Parameters. International Journal of Sports Medicine 26 (S1), 2005: S38–S48.
- Poole DC, Rossiter HB, Brooks GA, Gladden LB. The Anaerobic Threshold — 50+ Years of Controversy. Journal of Physiology 599 (3), 2021: 737–767.
- Wasserman K, McIlroy MB. Detecting the Threshold of Anaerobic Metabolism in Cardiac Patients During Exercise. American Journal of Cardiology 14, 1964: 844–852.
4 Determining and Monitoring Exercise Intensity
Learning objectives:
- The four traditional families of intensity methods, and why percentage anchors fail
- The ACSM/ESSA five-level terminology and its physiological anchors (MT1, MT2, W_max)
- Repetitions in reserve rather than %1-RM for resistance exercise, and RPE as an adjunct
4.1 Methods for Determining Exercise Intensity
There is currently no consensus regarding which of the many commonly used methods to establish different exercise intensities for different populations is best (Bishop et al. 2025). Traditional methods for determining exercise intensity include: (a) threshold-based approaches, using the first and second metabolic thresholds (MT1 and MT2) to demarcate exercise domains; (b) percentages of anchor measurements, such as %VO₂max, %HRmax, or %HRR, which — despite widespread use — do not achieve category-specific cardiovascular and metabolic responses in all individuals; (c) fixed values, such as metabolic equivalents (METs), which do not adequately consider individual differences in age, sex, body mass, and fitness; and (d) perceptual measures, most notably the Rating of Perceived Exertion (RPE), which integrates feelings of effort, strain, and fatigue from peripheral muscles, the cardiopulmonary system, and the central nervous system (Bishop et al. 2025).
4.2 The ACSM/ESSA Standardised Terminology
A joint American College of Sports Medicine (ACSM) Expert Statement and Exercise and Sports Science Australia (ESSA) Consensus Statement proposed a standardised five-level exercise intensity terminology — Very Low, Low, Moderate, High, and Very High — applicable to both cardiorespiratory and resistance exercise, together with five corresponding perception-of-effort descriptors: very easy, easy, somewhat hard, hard, and very hard (Bishop et al. 2025). The preferred method for prescribing cardiorespiratory exercise intensity is the direct measurement of metabolic thresholds and the work rate associated with the attainment of VO₂max during a graded exercise test (GXT), as this produces similar physiological stresses across individuals with different exercise capacities. For resistance exercise, the statement recommends prescribing intensity via repetitions in reserve (RIR) rather than percentage of one-repetition maximum (%1-RM), since RIR better captures both load and proximity to neuromuscular failure. RPE is recommended as a useful adjunct method to help monitor both cardiorespiratory and resistance exercise, particularly when laboratory-based assessments are not available (Bishop et al. 2025).
Tables 6 and 7 summarise the current descriptors and criteria from leading organisations, while Table 8 presents the proposed standardised classifications anchored to metabolic thresholds, RIR, and RPE scales.
Current descriptors and criteria for cardiorespiratory exercise intensity. Suggested values assume VO₂max = 10 METs or 35 mL O₂·kg⁻¹·min⁻¹. Adapted from Bishop et al. (2025).
| Intensity descriptor | % VO₂max (ESSA 2010) | % VO₂max (ACSM 2020) | % HRR (ESSA 2010) | % HRR (ACSM 2020) | % HRmax (ESSA 2010) | % HRmax (ACSM 2020) | RPE₂₀ (ESSA 2010) | RPE₂₀ (ACSM 2020) | METs (ESSA 2010) | METs (ACSM 2020) |
|---|---|---|---|---|---|---|---|---|---|---|
| Sedentary | < 20 | — | < 20 | — | < 40 | — | < 8 | — | < 1.6 | — |
| Very light | < 37 | < 28 | < 30 | < 20 | < 57 | < 50 | < 9 | < 10 | < 2.0 | < 2.8 |
| Light | 20–40 | 37–45 | 20–40 | 28–45 | 40–55 | 57–63 | 8–10 | 9–11 | 1.6–3 | 2.8–4.5 |
| Moderate | 40–60 | 46–63 | 40–60 | 45–63 | 55–70 | 64–76 | 11–13 | 12–13 | 3–6 | 4.6–6.3 |
| Hard | — | 64–86 | — | — | 60–84 | 77–93 | — | 14–16 | 6.4–8.6 | — |
| Vigorous | 60–85 | 64–90 | 60–85 | ≥ 87 | 70–90 | 77–95 | 14–16 | 14–17 | 6–9 | 6–8.7 |
| Near-max to maximal | ≥ 91 | — | ≥ 90 | — | ≥ 86 | — | ≥ 18 | — | ≥ 8.8 | — |
| Maximal | 100 | 100 | 100 | 100 | 100 | 100 | 20 | 20 | — | — |
Current descriptors and criteria for cardiorespiratory exercise intensity. Suggested values assume VO₂max = 10 METs or 35 mL O₂·kg⁻¹·min⁻¹. Adapted from Bishop et al. (2025).
Current descriptors and criteria for resistance exercise intensity. Adapted from Bishop et al. (2025).
| Intensity descriptor | % 1-RM (ESSA 2010) | % 1-RM (ACSM 2020) | % 1-RM (Howley 2001) |
|---|---|---|---|
| Very light | < 30 | < 30 | < 30 |
| Light | 30–49 | 30–49 | 30–49 |
| Moderate | 50–69 | 50–69 | 50–69 |
| Hard | 70–84 | — | 70–84 |
| Very hard / Vigorous | ≥ 85 | ≥ 85 | ≥ 85 |
| Maximal | 100 | 100 | 100 |
Current descriptors and criteria for resistance exercise intensity. Adapted from Bishop et al. (2025).
Proposed standardised classifications for exercise intensity. MT1, first metabolic threshold; MT2, second metabolic threshold; W_max, work rate associated with VO₂max attainment during a graded exercise test. Source: Bishop et al. (2025).
| Category | Cardiorespiratory Exercise (Physiological Reference) | Resistance Exercise (Reps in Reserve, RIR) | RPE₁₀ | RPE₂₀ |
|---|---|---|---|---|
| Inactive | Inactive | Inactive | 0 | 6 |
| Very Low | No current measure | > 8 | < 2 | ≤ 9 |
| Low | < MT1 | 7–8 | 2–3 | 10–11 |
| Moderate | > MT1 but < MT2 | 4–6 | 4–5 | 12–14 |
| High | > MT2 but < W_max | 2–3 | 6–7 | 15–16 |
| Very High | > W_max | < 2 | 8–10 | ≥ 17 |
Proposed standardised classifications for exercise intensity. MT1, first metabolic threshold; MT2, second metabolic threshold; W_max, work rate associated with VO₂max attainment during a graded exercise test. Source: Bishop et al. (2025).
Practical insight. The direct measurement of metabolic thresholds via GXT remains the gold standard for individualised exercise prescription in cardiorespiratory exercise, because percentage-based anchors (%VO₂max, %HRmax, %HRR, METs) do not reliably elicit the same metabolic stress across individuals. For resistance exercise, RIR provides a more ecologically valid measure of intensity than %1-RM alone. When laboratory assessment is unavailable, RPE serves as a practical adjunct for monitoring both exercise modalities.
One-Minute-Paper Topics
A One-Minute-Paper (OMP) is a short, focused prompt that students answer in ~60 seconds at the end of a session to consolidate learning, surface misconceptions, and provide formative feedback. When answering, be concise, specific, and use terminology from today’s session.
- The ACSM/ESSA consensus argues that percentage-based anchors (%V̇O₂max, %HRmax, %HRR, METs) fail to produce consistent physiological stress across individuals. Why? What is the preferred alternative for cardiorespiratory exercise?
- Describe the five-level (Very Low → Very High) framework. Which physiological anchors define the category boundaries for cardiorespiratory exercise?
- Explain why the consensus recommends RIR rather than %1-RM for prescribing resistance exercise intensity. Which RIR range corresponds to the “High” category?
- Which RPE₂₀ range corresponds to the “High” category of the proposed classification, and which physiological signals does RPE integrate?
- Name one situation in which RPE is the method of choice, and explain why the consensus positions it as an adjunct rather than as a primary method.
Key References
- Bishop DJ et al. Physical Activity and Exercise Intensity Terminology — ACSM/ESSA Joint Expert Statement. Journal of Science and Medicine in Sport 28, 2025: 980–991.
References
- Ainsworth BE, Haskell WL, Herrmann SD, et al. 2011 Compendium of Physical Activities — A Second Update of Codes and MET Values. Medicine & Science in Sports & Exercise 43 (8), 2011: 1575–1581.
- American College of Sports Medicine. ACSM’s Guidelines for Exercise Testing and Prescription.
- Bishop DJ et al. Physical Activity and Exercise Intensity Terminology — ACSM/ESSA Joint Expert Statement. Journal of Science and Medicine in Sport 28, 2025: 980–991.
- FAO/WHO/UNU. Human Energy Requirements — Report of a Joint FAO/WHO/UNU Expert Consultation. FAO Food and Nutrition Technical Report Series 1, Rome, 2004.
- Faude O, Kindermann W, Meyer T. Lactate Threshold Concepts — How Valid Are They? Sports Medicine 39 (6), 2009: 469–490.
- Meyer T, Lucía A, Earnest CP, Kindermann W. A Conceptual Framework for Performance Diagnosis and Training Prescription from Submaximal Gas Exchange Parameters. International Journal of Sports Medicine 26 (S1), 2005: S38–S48.
- Poole DC, Rossiter HB, Brooks GA, Gladden LB. The Anaerobic Threshold — 50+ Years of Controversy. Journal of Physiology 599 (3), 2021: 737–767.
- Wasserman K, McIlroy MB. Detecting the Threshold of Anaerobic Metabolism in Cardiac Patients During Exercise. American Journal of Cardiology 14, 1964: 844–852.
- Weir JB de V. New Methods for Calculating Metabolic Rate with Special Reference to Protein Metabolism. Journal of Physiology 109 (1–2), 1949: 1–9.