Heart Rate as a Biomarker — The Resting Value, the Ceiling and the Fall
Table of Contents
- Resting Heart Rate — What It Predicts
- From Light to Heart Rate — How a Wearable Produces the Number
- Measuring Resting Heart Rate — Definitions, Devices, Baselines
- Maximum Heart Rate — The Denominator Under Every Zone
- Heart-Rate Recovery — The Minute After Exercise
1 Resting Heart Rate — What It Predicts
Learning objectives:
- The dose–response between resting heart rate and mortality, and what survives adjustment for fitness
- Proposed mechanisms sorted by evidence: demonstrated, associated, hypothetical
- The distinction between a validated risk marker and a validated treatment target
Three numbers run through exercise physiology and through every wearable a student owns: the heart rate at rest, the highest it will go, and how fast it comes back down. They are measured differently, they predict different things, and only one of them is usually measured at all. The chapters of this lecture take them in that order and ask of each the same two questions — what does it predict, and do we actually know the value we are using? This chapter takes the resting value.
1.1 Definition
Resting heart rate is the heart rate of a person who is awake, in a neutral thermal environment, and has not recently exerted themselves. Every word in that sentence is a protocol decision, and §3.1 shows what happens when different sources make them differently.
1.2 The Dose–Response with Mortality
Zhang et al. (2016) pooled forty-six prospective cohorts: 1 246 203 participants and 78 349 deaths for all-cause mortality, 848 320 participants and 25 800 deaths for cardiovascular mortality. Each ten-beat increment carried a relative risk of 1.09 (95% CI 1.07–1.12) for all-cause and 1.08 (1.06–1.10) for cardiovascular mortality, independent of the classical risk factors. The dose–response was linear from 45 bpm upwards: there is no point at which a lower resting heart rate stops being better. For cardiovascular mortality, the increase in risk was significant at 90 versus 45 bpm.
Aune et al. (2017) extended this across eighty-seven studies. The gradient is steepest for heart failure and for all-cause mortality, and atrial fibrillation is the one outcome that does not follow — its association is J-shaped. A slow resting rate is not protective for everything.
Relative risk per 10 bpm higher resting heart rate, by outcome, pooled from eighty-seven prospective studies (Aune et al. 2017). All-cause mortality is highlighted.
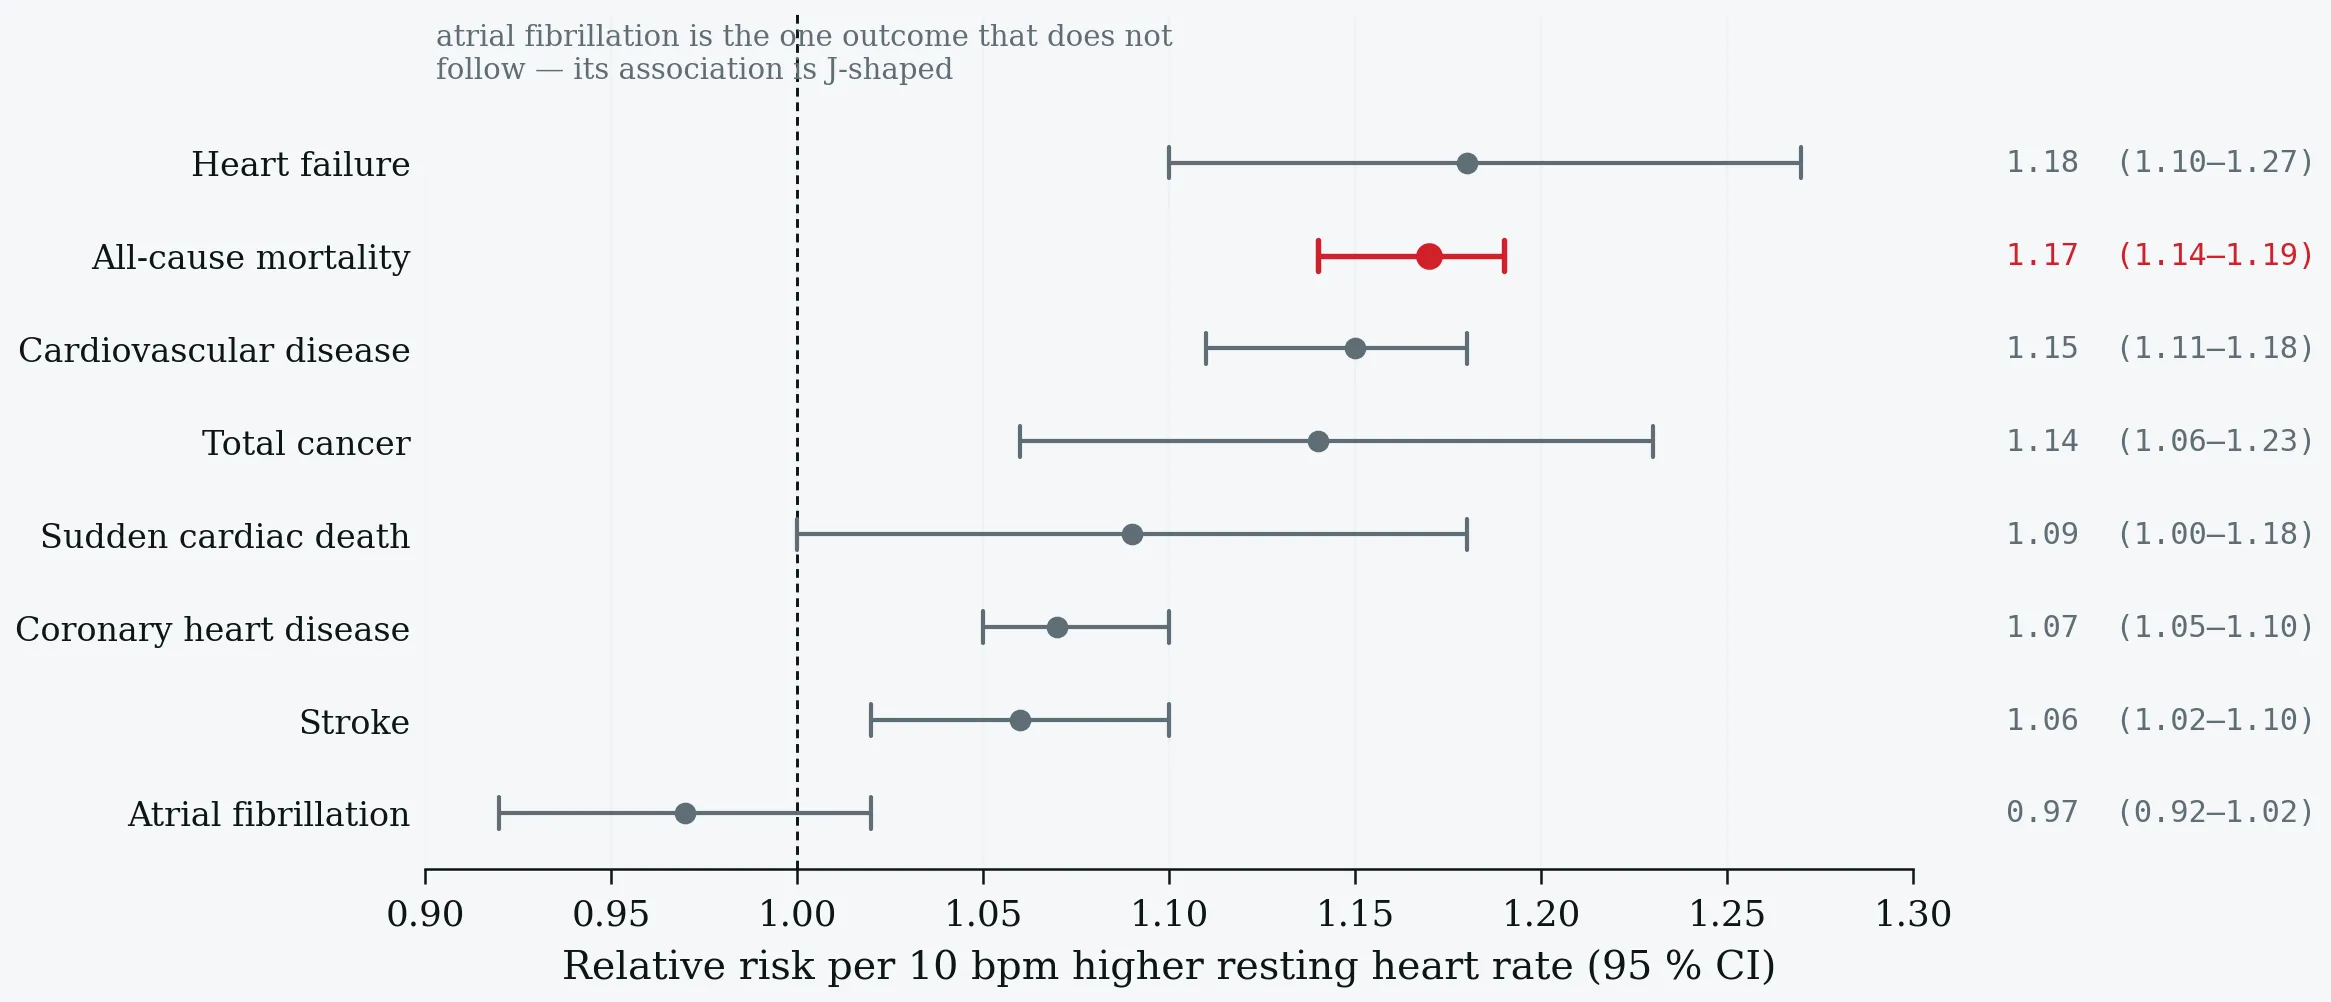
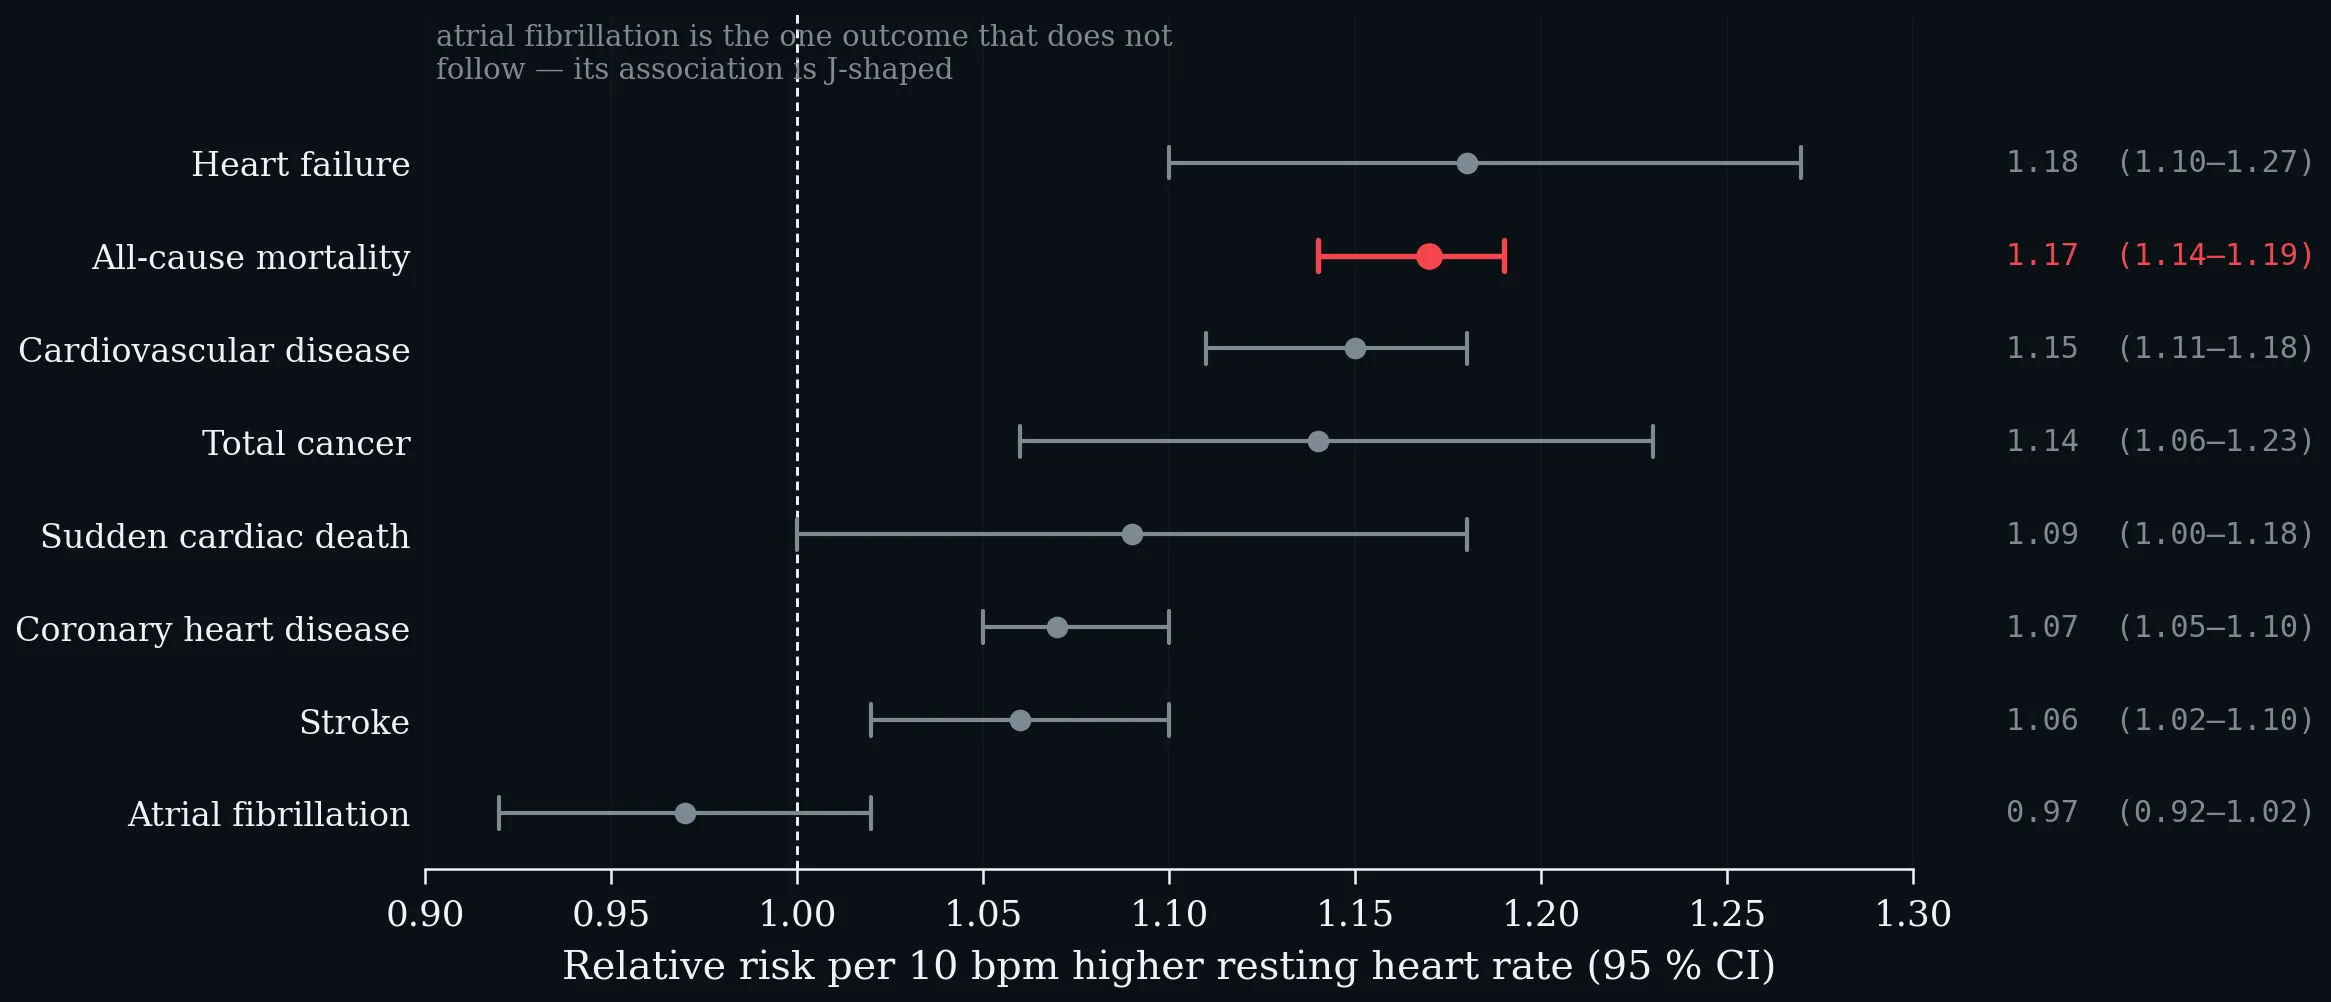
Relative risk per 10 bpm higher resting heart rate, by outcome, pooled from eighty-seven prospective studies (Aune et al. 2017). All-cause mortality is highlighted.
The Framingham Heart Study agrees at the level of the individual: in 4058 participants followed about two decades with adjustment for physical activity, each standard deviation (11 bpm) predicted all-cause mortality at HR 1.17 (1.11–1.24) and heart failure at 1.32 (1.18–1.48), with spline analyses showing no lower threshold (Ho et al. 2014).
1.3 Is It Just Fitness?
Partly — and the “partly” is the teaching point. Resting heart rate is a valid population-level fitness biomarker: in the Fenland Study (n = 10 865), physical activity explained 50% and adiposity 10% of the resting-heart-rate–fitness relationship (Gonzales et al. 2023). Training moves it, too: across 191 interventional studies and 12 952 participants, every exercise mode lowered resting heart rate, endurance training and yoga significantly in both sexes, and the drop was larger the higher the starting value (Reimers et al. 2018).
But the mortality gradient survives adjustment for measured fitness. In the Copenhagen Male Study — 2798 men, sixteen years, 1082 deaths — above 90 bpm versus at or below 50 bpm gave a hazard ratio of 3.06 (1.97–4.75), and risk rose 16% (10–22) per ten beats, independent of V̇O₂max and leisure-time activity (Jensen et al. 2013). The weakness should be stated openly: fitness was measured in 1971 and resting heart rate in 1985, and only 54 of 2798 men exceeded 90 bpm. The finding is supported here, and contested.
1.4 Mechanisms — Three Tiers of Evidence
A deliberate teaching device: sort the proposed mechanisms by the kind of evidence behind them.
1.4.1 Demonstrated
Shortened diastole reduces coronary flow when a severe stenosis is present, and selective bradycardic agents restore flow and function — an effect that disappears if pacing prevents the rate reduction (Heusch 2008). Heart rate is a direct determinant of myocardial oxygen demand. Heart-rate reduction lowers oxidative stress, improves endothelial function and prevents atherosclerosis in ApoE-deficient mice (Custodis et al. 2010).
1.4.2 Associated, Direction Unsettled
In 643 subjects aged 55–75 without apparent heart disease, higher heart rate and reduced heart-rate variability were independently related to white-cell count and CRP (Sajadieh et al. 2004). Common cause or consequence is unresolved.
1.4.3 Hypothesis — Label It as One
Across mammals there is an inverse semilogarithmic relation between heart rate and life expectancy, with lifetime beats roughly constant at 7.3 × 10⁸; humans are the outlier at roughly 3 × 10⁹. Levine’s own conclusion is the honest one: whether human life can be extended by cardiac slowing “remains moot” (Levine 1997).
1.5 Marker or Target?
Does lowering heart rate help? Four trials, one distinction — SHIFT (Swedberg et al. 2010), the beta-blocker dose meta-analysis (McAlister et al. 2009), BEAUTIFUL (Fox et al. 2008) and SIGNIFY (Fox et al. 2014).
| Trial | Population | Heart-rate effect | Primary outcome | Verdict |
|---|---|---|---|---|
| SHIFT 2010 (n = 6558) | HFrEF, LVEF ≤ 35%, resting HR ≥ 70 | −9.1 bpm | CV death or HF hospitalisation 0.82 (0.75–0.90) | Benefit |
| Beta-blocker meta-analysis 2009 (23 RCTs, 19 209 pts) | Heart failure | per −5 bpm | 18% lower mortality (6–29%); dose itself not associated | Benefit tracks rate, not dose |
| BEAUTIFUL 2008 (n = 10 917) | CAD, LVEF < 40% | −6 bpm | 1.00 (0.91–1.10), p = 0.94 | Prognostic, not therapeutic |
| SIGNIFY 2014 (n = 19 102) | Stable CAD, no heart failure | 70.6 → 60.7 bpm | 1.08 (0.96–1.20), p = 0.20; harm signal in activity-limiting angina | No benefit |
Does lowering heart rate help? Four trials, one distinction — SHIFT (Swedberg et al. 2010), the beta-blocker dose meta-analysis (McAlister et al. 2009), BEAUTIFUL (Fox et al. 2008) and SIGNIFY (Fox et al. 2014).
The instructive detail is inside BEAUTIFUL itself: in its placebo arm, a resting heart rate of 70 bpm or more predicted 34% more cardiovascular death and 53% more heart-failure hospitalisation (Fox et al. 2008). The same trial demonstrates both that the marker predicts and that lowering it does not automatically help. Genetics adds the other side: in a genome-wide analysis of up to 265 046 people, Mendelian randomisation gives an all-cause mortality hazard ratio of 1.20 (1.11–1.28) per genetically predicted five beats — evidence for a causal contribution rather than confounding by fitness or illness (Eppinga et al. 2016).
A reliable risk marker in every population studied; a validated treatment target only in heart failure with reduced ejection fraction.
One-Minute-Paper Topics
A One-Minute-Paper (OMP) is a short, focused prompt that students answer in ~60 seconds at the end of a session to consolidate learning, surface misconceptions, and provide formative feedback. When answering, be concise, specific, and use terminology from today’s session.
- A patient’s resting heart rate falls from 78 to 68 bpm after six months of training. Using Figure 1, quantify the expected change in all-cause mortality risk — and give two reasons why that arithmetic may not apply to this individual.
- SIGNIFY lowered heart rate by ten beats and showed no benefit; SHIFT lowered it by nine and showed a large one. Explain the difference in one sentence.
- Name one mechanism that is demonstrated and one that is associated only, and say how you know the difference.
- Use BEAUTIFUL’s placebo arm to distinguish a risk marker from a treatment target. Why is the placebo arm the decisive piece of evidence in that trial?
- Mendelian randomisation gives HR 1.20 per genetically predicted five beats. What does the genetic design control for that the Copenhagen and Framingham designs cannot?
- The beta-blocker meta-analysis found mortality benefit tracking heart-rate reduction but not drug dose. What does that dissociation argue about the mechanism of benefit?
Key References
- Aune D, Sen A, ó’Hartaigh B, Janszky I, Romundstad PR, Tonstad S, Vatten LJ. Resting heart rate and the risk of cardiovascular disease, total cancer, and all-cause mortality. Nutrition, Metabolism and Cardiovascular Diseases 27 (6), 2017: 504–517.
- Custodis F, Schirmer SH, Baumhäkel M, Heusch G, Böhm M, Laufs U. Vascular pathophysiology in response to increased heart rate. Journal of the American College of Cardiology 56 (24), 2010: 1973–1983.
- Eppinga RN, Hagemeijer Y, Burgess S, et al. Identification of genomic loci associated with resting heart rate and shared genetic predictors with all-cause mortality. Nature Genetics 48 (12), 2016: 1557–1563.
- Fox K, Ford I, Steg PG, Tendera M, Ferrari R; BEAUTIFUL Investigators. Ivabradine for patients with stable coronary artery disease and left-ventricular systolic dysfunction. The Lancet 372 (9641), 2008: 807–816.
- Fox K, Ford I, Steg PG, Tardif JC, Tendera M, Ferrari R; SIGNIFY Investigators. Ivabradine in stable coronary artery disease without clinical heart failure. New England Journal of Medicine 371 (12), 2014: 1091–1099.
- Gonzales TI, et al. Resting heart rate is a population-level biomarker of cardiorespiratory fitness: the Fenland Study. PLoS ONE 18 (5), 2023: e0285272.
- Heusch G. Heart rate in the pathophysiology of coronary blood flow and myocardial ischaemia. British Journal of Pharmacology 153 (8), 2008: 1589–1601.
- Ho JE, Larson MG, Ghorbani A, Cheng S, Coglianese EE, Vasan RS, Wang TJ. Long-term cardiovascular risks associated with an elevated heart rate: the Framingham Heart Study. Journal of the American Heart Association 3 (3), 2014: e000668.
- Jensen MT, Suadicani P, Hein HO, Gyntelberg F. Elevated resting heart rate, physical fitness and all-cause mortality: a 16-year follow-up in the Copenhagen Male Study. Heart 99 (12), 2013: 882–887.
- Levine HJ. Rest heart rate and life expectancy. Journal of the American College of Cardiology 30 (4), 1997: 1104–1106.
- McAlister FA, Wiebe N, Ezekowitz JA, Leung AA, Armstrong PW. Meta-analysis: beta-blocker dose, heart rate reduction, and death in patients with heart failure. Annals of Internal Medicine 150 (11), 2009: 784–794.
- Reimers AK, Knapp G, Reimers CD. Effects of exercise on the resting heart rate: a systematic review and meta-analysis of interventional studies. Journal of Clinical Medicine 7 (12), 2018: 503.
- Sajadieh A, Nielsen OW, Rasmussen V, Hein HO, Abedini S, Hansen JF. Increased heart rate and reduced heart-rate variability are associated with subclinical inflammation. European Heart Journal 25 (5), 2004: 363–370.
- Swedberg K, Komajda M, Böhm M, et al.; SHIFT Investigators. Ivabradine and outcomes in chronic heart failure (SHIFT): a randomised placebo-controlled study. The Lancet 376 (9744), 2010: 875–885.
- Zhang D, Shen X, Qi X. Resting heart rate and all-cause and cardiovascular mortality in the general population: a meta-analysis. CMAJ 188 (3), 2016: E53–E63.
2 From Light to Heart Rate — How a Wearable Produces the Number
Learning objectives:
- What photoplethysmography measures at the wrist, why green light, and what degrades the signal
- The processing chain from photodiode to displayed number, and why pulse rate variability is not heart rate variability
- What validations against ECG and polysomnography show, and why accuracy alone cannot judge a sleep tracker
§1 treated the heart rate as a number with epidemiology attached to it. Every one of those cohorts measured it electrically. The devices students wear do not measure it at all: they measure light, infer a pulse, and compute a rate. This chapter follows that chain, because almost every disagreement in §3 is generated somewhere inside it.
2.1 From Light to Pulse
Photoplethysmography illuminates tissue with an LED and measures, with a photodiode, how much light returns. The volume of arterial blood in the microvascular bed changes with each heartbeat; blood absorbs more light than the surrounding tissue; so the returning light is modulated at the cardiac frequency. That modulation is the AC component. It rides on a much larger, slowly varying DC baseline set by tissue, venous blood, respiration, sympathetic tone and skin temperature (Allen 2007).
The ratio matters more than either part: at the finger the AC component can reach a few per cent of the DC level, but at the wrist it is of the order of 0.1–1% (Tamura et al. 2014).
Reflectance photoplethysmography at the wrist. Green light is absorbed strongly by haemoglobin and returns from the dermal arterioles; infrared penetrates into the subcutis and samples venous as well as arterial blood. The pulsatile AC component is 0.1–1% of the total light returning. Schematic; depths are indicative, not to scale.
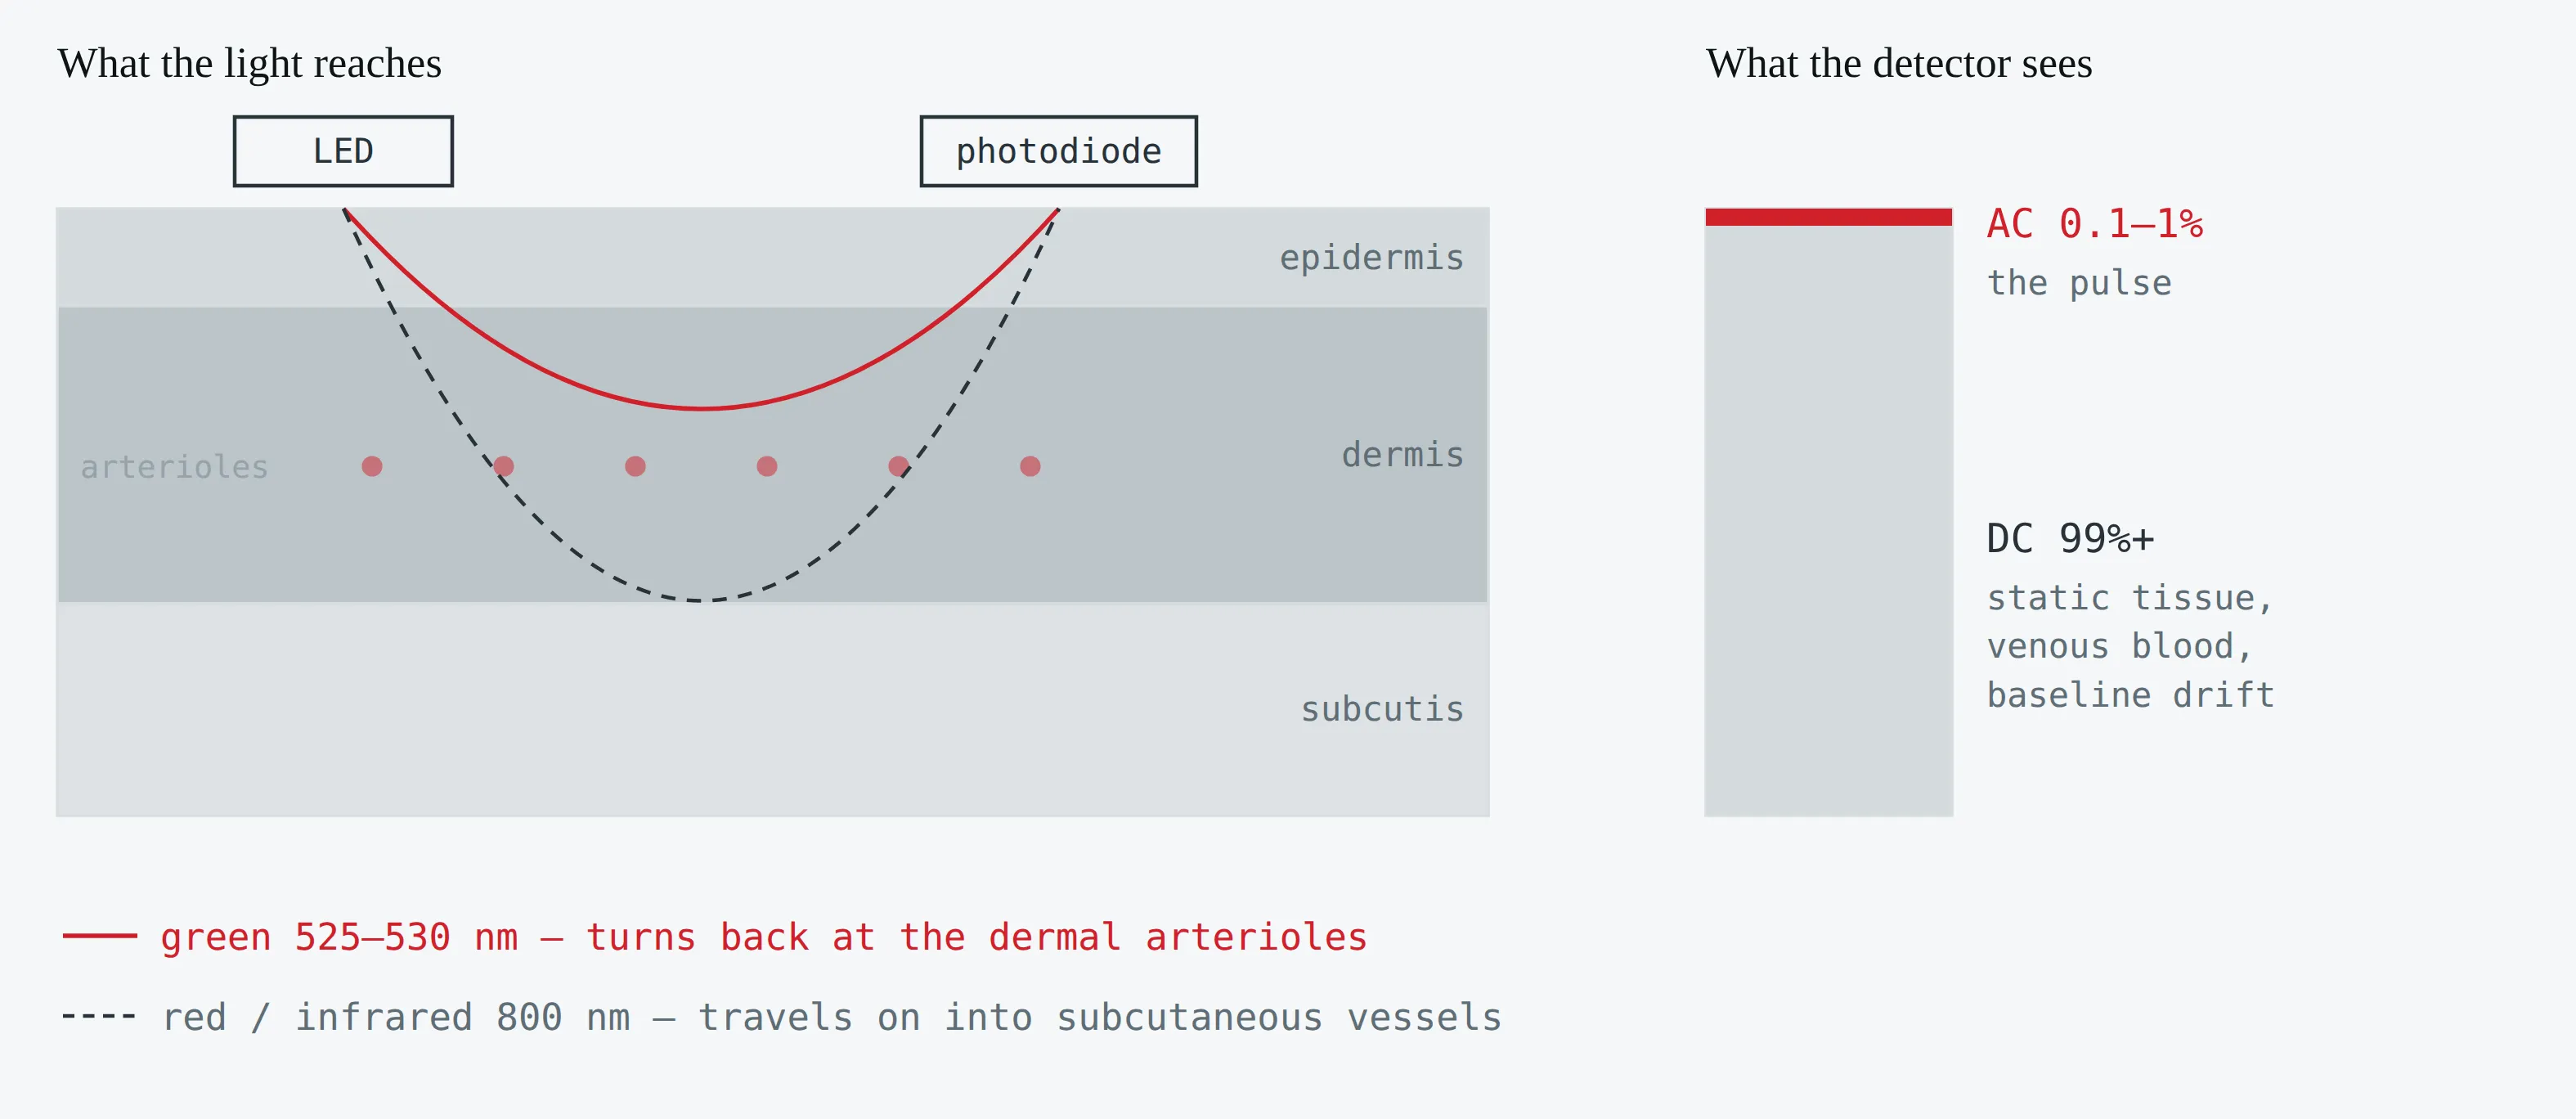
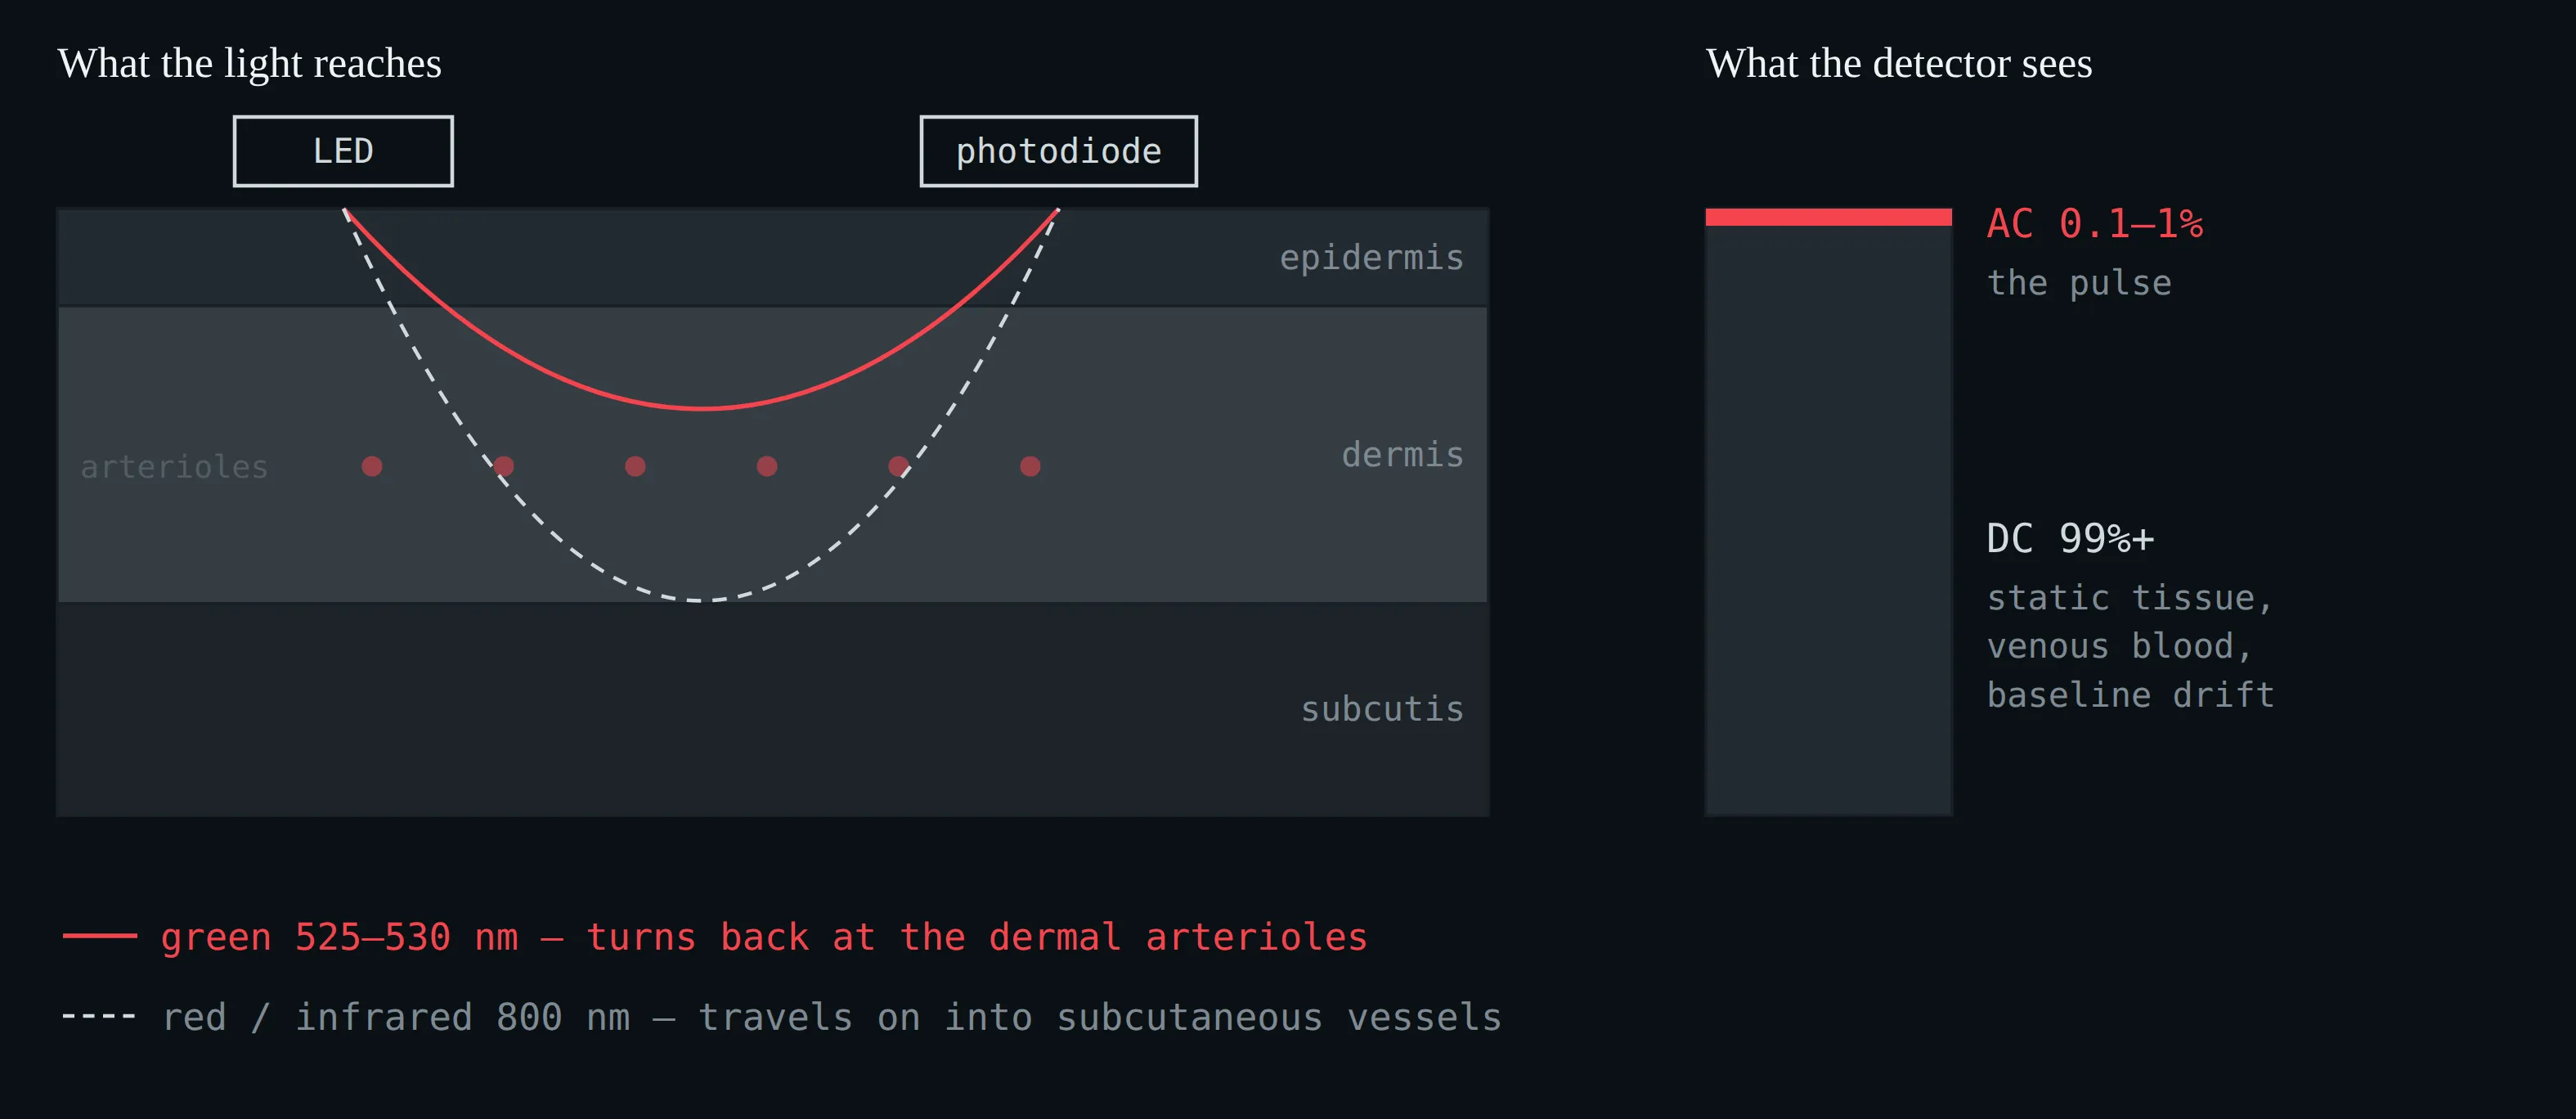
Reflectance photoplethysmography at the wrist. Green light is absorbed strongly by haemoglobin and returns from the dermal arterioles; infrared penetrates into the subcutis and samples venous as well as arterial blood. The pulsatile AC component is 0.1–1% of the total light returning. Schematic; depths are indicative, not to scale.
Site matters as much as wavelength. In 36 adults measured at six locations, the dorsal wrist — where every consumer watch sits — produced the lowest pulse amplitude of all sites tested, while the finger produced the highest: 95% of finger waveforms were analysable against 61% at the forehead (Hartmann et al. 2019). The watch is worn where the signal is worst, for reasons of convenience.
Given that, why green? Green light (≈525 nm) is strongly absorbed by haemoglobin and is back-scattered from the dermal arteriolar plexus, a compartment that is genuinely arterial (Moço et al. 2018). Infrared penetrates to the subcutis, where veins contribute — excellent for pulse oximetry, which needs two wavelengths and a transmission geometry, poor for a clean arterial pulse at the wrist. Green also survives movement better: measured against simultaneous ECG during hand motion, green lost −7.4 ± 3.6 dB of signal-to-noise against red’s −13.6 ± 4.2 dB, and agreed with the ECG to ±0.61 bpm against red’s ±3.20 bpm (Lee et al. 2013).
What degrades the optical path — the factors to know before interpreting one’s own wearable data.
| Factor | Effect | Source |
|---|---|---|
| Motion | Absolute error during activity ~30% higher than at rest; walking biases upward because the algorithm can lock onto step cadence | Bent et al. 2020 |
| Sensor position | Upper arm versus wrist: MAPE −11.4 points, ICC 0.59 → 0.92 | Vermunicht et al. 2025 |
| Contact pressure | Optimum around 35–48 mmHg; too loose and the sensor floats, too tight and the arterioles are occluded | May et al. 2021 |
| Tattooed skin | MAPE 22.9% at rest, with complete dropout in some participants | Navalta et al. 2025 |
| Arm hair | Tested directly; not significant (p = 0.29) | Vermunicht et al. 2025 |
| Skin tone | Optical modelling: up to 61% signal loss from epidermal melanin | Ajmal et al. 2021 |
What degrades the optical path — the factors to know before interpreting one’s own wearable data.
Skin tone deserves the careful version, because the literature is genuinely split. A 2023 systematic review found four studies reporting an effect, four reporting none and two mixed (Koerber et al. 2023). A 2025 study found errors of 3.5 versus 11.8 bpm by skin tone at >60% heart rate reserve (Hung et al. 2025). A 2026 analysis found the bias unaffected but 50–85% of all missing data coming from participants with darker skin (Mulholland et al. 2026) — missing data is itself a finding. The honest teaching position: the physics predicts an effect, the aggregate accuracy statistics often do not show one, and the dropout rate does.
2.2 From Pulse to Heart Rate
A modulated light signal is not a heart rate. Between the photodiode and the number on the screen sit roughly seven operations, and the manufacturer discloses almost none of them.
From raw photodiode current to displayed heart rate. Steps 1–3 are physics and broadly comparable across devices; steps 4–7 are proprietary and change with firmware.
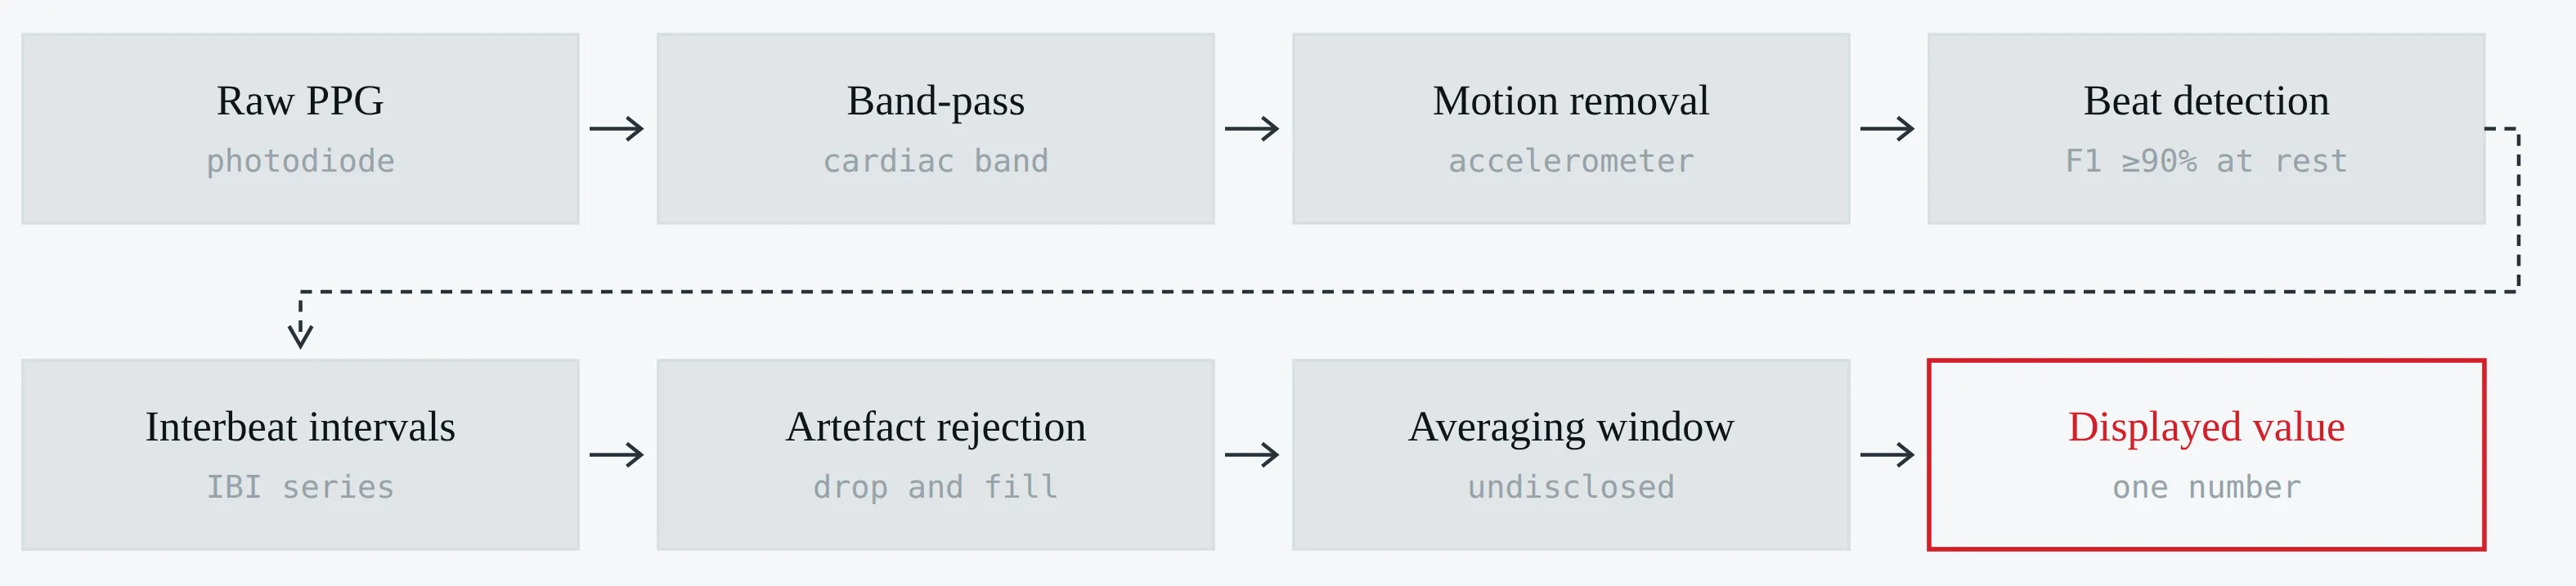
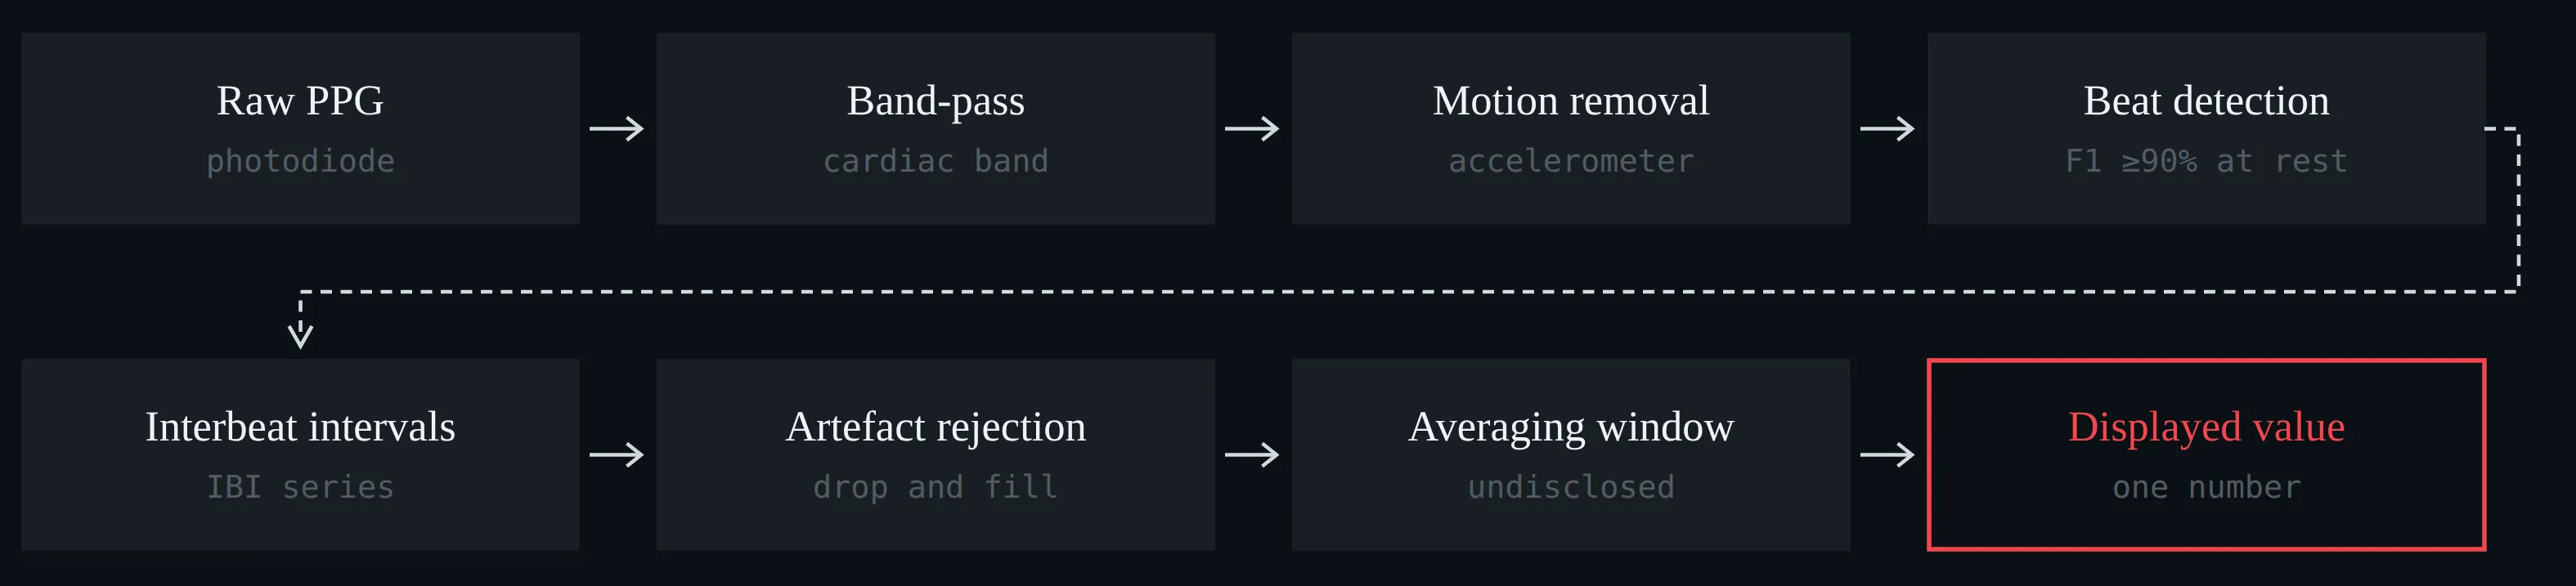
From raw photodiode current to displayed heart rate. Steps 1–3 are physics and broadly comparable across devices; steps 4–7 are proprietary and change with firmware.
Three of those steps deserve a closer look.
Sampling. Beat timing can only be as precise as the sample interval allows. At 25 Hz — a common low-power setting — a beat is located to the nearest 40 ms unless the device interpolates between samples; 50 Hz with cubic interpolation recovers timing close to a 1 kHz reference (Choi and Shin 2017). Whether a given watch does this is not published. Worse, the sampling rate is not the logging rate: one device may write a value every second, another every five, and the Apple Watch may log as rarely as every 10 minutes in ambient mode (Nelson et al. 2020). A sparse log is not evidence of a sparse measurement, and a dense log is not evidence of a good one.
Beat detection. This part is close to solved, at rest. Fifteen open-source detectors benchmarked on eight datasets against simultaneous ECG: eight reached F1 ≥ 90% on wearable recordings at rest, and 98–99% in healthy adults. During exercise the same detectors fell to 55–91%, and in atrial fibrillation to 92–97% (Charlton et al. 2022). The failure mode is not a slightly wrong number; it is a missed or invented beat, which is catastrophic for any interval-based measure.
Pulse timing is not R-wave timing. The ECG R wave marks ventricular depolarisation. The PPG foot marks the arrival of a pressure wave at the wrist, later by the pre-ejection period plus the pulse transit time — and both vary beat to beat with blood pressure, vascular tone and posture. The consequence is specific: the mean pulse rate equals the mean heart rate, so heart rate is safe, while the variability of the pulse interval carries this extra variance on top of the cardiac one.
Pulse rate variability is a proxy for heart rate variability, not a synonym for it. Mean rate transfers; beat-to-beat variability does not.
The quantitative version: a 2013 review of PRV versus HRV declined to pool a single agreement statistic at all, on the grounds that study conditions were too heterogeneous (Schäfer and Vagedes 2013). A 2024 analysis using a region of practical equivalence found 88.4% of SDNN estimates acceptable but only 21.4% of RMSSD (Dewig et al. 2024) — and RMSSD is the parasympathetic index every readiness score is built on. Missing beats compound it: in one validation about 10% of interbeat intervals were absent, including five gaps longer than 6.5 s, and whatever the device substitutes for them is undisclosed (Hernando et al. 2018).
The practical corollary for reading the literature is uncomfortable. Two published validations of nominally “the same device” may have tested different firmware running different algorithms, and neither paper will say so. Device validity is a property of a device-and-firmware-and-condition, not of a brand (Dial et al. 2025b).
2.3 Against the Electrocardiogram — WHOOP, Oura, Apple
One study is worth more than a narrative review here, because it put six devices on 53 people for a single night against a two-lead ECG recorded inside a polysomnogram — same participants, same nights, same reference, same analysis (Miller et al. 2022).
Nocturnal heart rate against two-lead ECG in 53 participants: bias and 95% limits of agreement, with mean absolute error and intraclass correlation alongside (Miller et al. 2022).
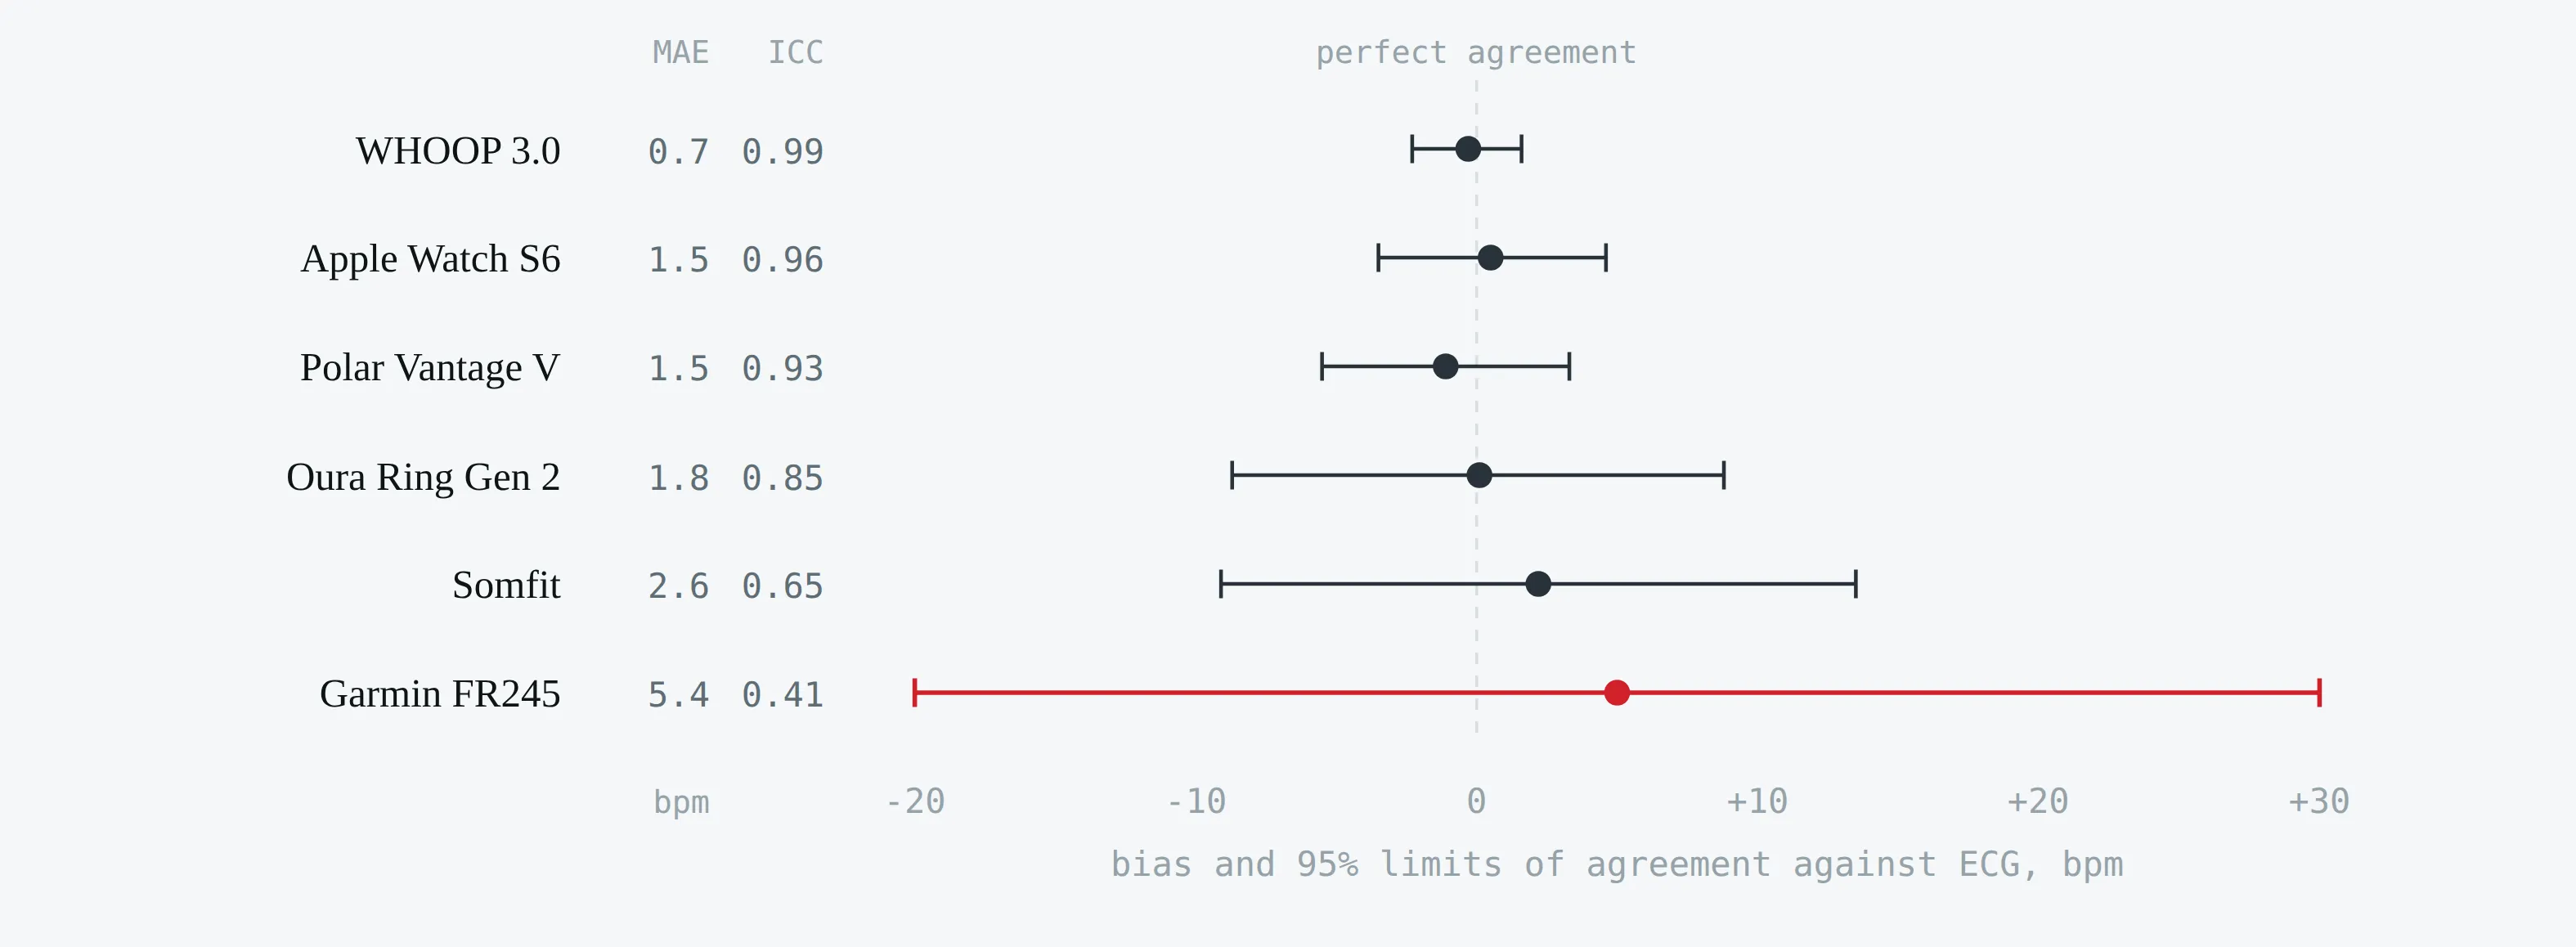
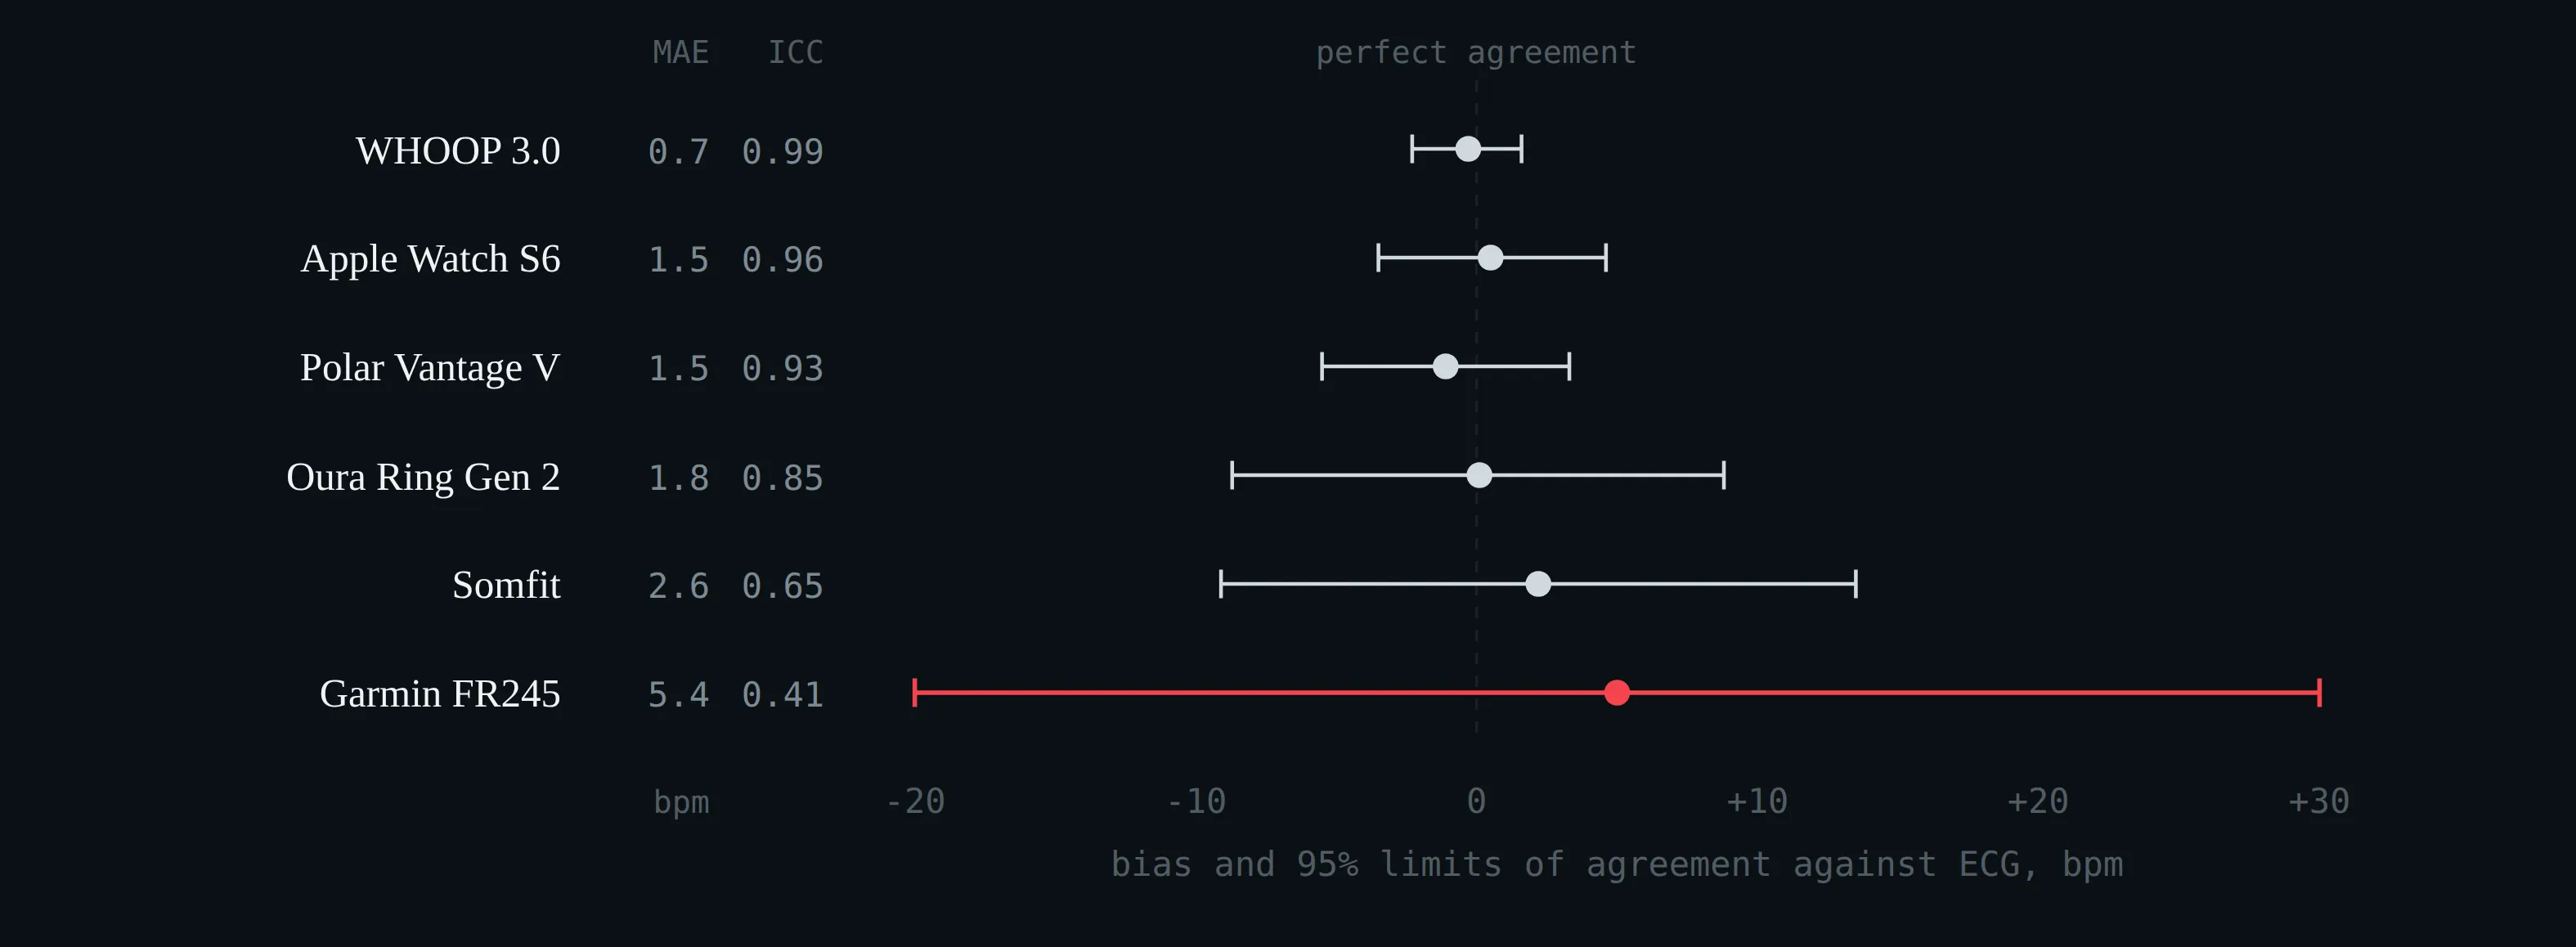
Nocturnal heart rate against two-lead ECG in 53 participants: bias and 95% limits of agreement, with mean absolute error and intraclass correlation alongside (Miller et al. 2022).
Nocturnal heart rate against two-lead ECG, n = 53 (Miller et al. 2022).
| Device | Bias (bpm) | 95% LoA | ICC | MAE (bpm) | RMSSD MAE (ms) |
|---|---|---|---|---|---|
| WHOOP 3.0 | −0.3 | −2.3 to +1.6 | 0.99 | 0.7 | 4.7 |
| Apple Watch S6 | +0.5 | −3.5 to +4.6 | 0.96 | 1.5 | 22.5 |
| Polar Vantage V | −1.1 | −5.5 to +3.3 | 0.93 | 1.5 | 18.8 |
| Oura Ring Gen 2 | +0.1 | −8.7 to +8.8 | 0.85 | 1.8 | 18.9 |
| Somfit | +2.2 | ±11.3 | 0.65 | 2.6 | 24.0 |
| Garmin Forerunner 245 | +5.0 | −20 to +30 | 0.41 | 5.4 | 33.1 |
Nocturnal heart rate against two-lead ECG, n = 53 (Miller et al. 2022).
The wider validation picture for WHOOP, Oura and Apple Watch.
| Device | Study, reference, n | Heart rate | Variability |
|---|---|---|---|
| WHOOP 3.0 | Bellenger 2021; ECG; n = 6, 4 nights each | ICC 1.00 | ICC 0.98 for RMSSD; very small sample |
| WHOOP 4.0 | Dial et al. 2025a; chest-strap ECG; 536 nights, n = 13 | Bias −1.41 bpm, MAPE 3.00%, CCC 0.91 | Reported; nights are not independent observations |
| Oura Gen 2 | Kinnunen 2020; ECG; n = 49 | r² 0.996, bias −0.63 bpm | Manufacturer-affiliated authorship |
| Oura Gen 2 | Cao 2022; Shimmer3 ECG; n = 35 | Good agreement for mean rate | LF and LF:HF error high; time-domain acceptable |
| Oura Gen 3 | Dial et al. 2025a; chest-strap ECG; 536 nights | Bias −0.88 bpm, MAPE 1.67%, CCC 0.97 | Reported |
| Apple Watch | Nelson and Allen 2019; 3-lead ambulatory ECG; n = 1, 102,740 beats over 24 h | MAPE 5.86% overall; 3.12% asleep, 3.02% running, 13.70% in daily activities | Not assessed |
| Apple Watch | Hernando et al. 2018; Polar H7 chest belt (not ECG); n = 20 | Acceptable for mean rate | ~10% of RR intervals missing; LF/HF underestimated |
| Apple Watch | Lambe et al. 2026; living meta-analysis, 38 HR studies, 1855 participants | Rest bias +0.21 bpm, LoA −8.14 to +8.56; third-generation sensors −3.68 to +2.59 | Not pooled |
The wider validation picture for WHOOP, Oura and Apple Watch.
Three conclusions follow.
- Nocturnal heart rate is a solved problem for these three devices. Errors of one to two beats are smaller than the day-to-day biological variation of the quantity itself, and smaller than the ten-beat contrasts §1 was built on.
- Nocturnal heart rate variability is not. A fivefold spread in RMSSD error across devices measured on the same wrists on the same night means that variability-derived scores — readiness, recovery, strain — are not comparable across brands and should not be pooled across them in a study.
- One night is not 24 hours. The same Apple Watch that is excellent asleep is four times worse during ordinary daytime activity. Validation at rest licenses claims about rest.
Heart rate and heart rate variability are validated separately, and a device that is excellent at one may be poor at the other. Ask which one the claim is about.
2.4 From Heart Rate to Sleep Stages
One more consequence of §2.2 deserves its own subsection, because it closes a loop that runs through the whole lecture. The four-stage sleep report a ring or a watch produces — awake, light, deep, REM — is computed largely from the cardiac signal just discussed. Motion cannot distinguish light sleep from deep sleep from REM; the autonomic signature can. Deep sleep is parasympathetically dominated, with the lowest and most regular heart rate of the night; REM is sympathetically activated in phasic bursts despite muscle atonia (median HR 51.6 bpm in N2, 51.5 in slow-wave sleep, 53.6 in REM; Herzig et al. 2018). Those differences are what the classifier reads.
The clearest demonstration is the manufacturer’s own. Oura’s algorithm paper — 106 people, 440 nights, three different polysomnography systems — reports four-stage accuracy sensor by sensor (Altini and Kinnunen 2021). One author is employed by the manufacturer and the other advises it; it is an algorithm-development paper, not an independent validation, which is exactly why the ablation is published at all.
What each input contributes to sleep staging, and where cardiac information alone tops out.
| Input | Sleep vs wake | Four stages | Source |
|---|---|---|---|
| Accelerometer only | 94% | 57% | Altini and Kinnunen 2021 (n = 106, 440 nights) |
| + skin temperature | 95% | 60% | Altini and Kinnunen 2021 |
| + heart-rate variability | 96% | 76% | Altini and Kinnunen 2021 |
| + circadian time | 96% | 79% | Altini and Kinnunen 2021 |
| Instantaneous heart rate alone, ECG | — | 77%, κ 0.66; deep-sleep recall 0.48 | Sridhar et al. 2020 (800 nights) |
| 132 HRV features, ECG | — | 77%, κ 0.61; N3 κ 0.53 | Radha et al. 2019 (541,214 epochs) |
| Optical pulse + accelerometer | κ 0.55 | 59%, κ 0.42 | Fonseca et al. 2017 (n = 51) |
What each input contributes to sleep staging, and where cardiac information alone tops out.
Adding heart-rate variability is worth sixteen percentage points of four-stage accuracy. It is worth two points for telling sleep from wake. And the ceiling is low even with a clinical ECG: on 800 nights with modern deep learning, four-stage κ reaches 0.66 and deep-sleep recall only 0.48. Deep sleep is the weakest class in every study in this table.
The stage labels are a function of the heart rate. So the resting heart rate a device reports — a statistic taken over a window its own classifier drew — is not an independent second measurement. It is the same signal, read twice.
2.5 Reading a Sleep-Accuracy Claim
This is a worked example of a manufacturer accuracy claim, and the most instructive one in this lecture, because the numbers are all correct. A vendor accuracy page states “90–96% agreement with polysomnography” and cites four peer-reviewed studies by name. Every figure quoted can be found in the paper it is attributed to. The teaching content is entirely in what is not quoted.
The base-rate trap. In bed, roughly 85–90% of 30-second epochs are sleep. A classifier that answers “asleep” to every epoch therefore scores sensitivity 100%, specificity 0%, and accuracy near 87%. Accuracy and sensitivity reward that drift; only specificity and Cohen’s κ punish it.
The proof is published: Chinoy et al. (2021) tested seven devices in 34 participants over three in-lab polysomnography nights.
Sleep sensitivity, wake specificity, accuracy and total-sleep-time bias against in-lab polysomnography (Chinoy et al. 2021).
| Device | Sleep sensitivity | Wake specificity | Accuracy | TST bias |
|---|---|---|---|---|
| Garmin Fenix 5S | 0.99 | 0.18 | 0.88 | +43.7 min (p < 0.001) |
| Garmin Vivosmart 3 | 0.99 | 0.19 | 0.88 | +46.8 min (p < 0.001) |
| Fitbit Alta HR | 0.95 | 0.54 | 0.90 | +2.6 min (n.s.) |
| Actiwatch 2 (research) | 0.97 | 0.39 | 0.89 | +23.9 min (p < 0.001) |
Sleep sensitivity, wake specificity, accuracy and total-sleep-time bias against in-lab polysomnography (Chinoy et al. 2021).
The Garmin and the Fitbit have statistically indistinguishable accuracy. One of them misses 82% of wake epochs and overestimates sleep by three quarters of an hour. Accuracy cannot separate them; specificity separates them instantly.
Sleep sensitivity and wake specificity for seven consumer devices against polysomnography (Chinoy et al. 2021; de Zambotti et al. 2019; Ong et al. 2024; Schyvens et al. 2025). The sensitivities are all alike; the specificities are not. Accuracy, the statistic usually quoted, is dominated by the sensitivity.
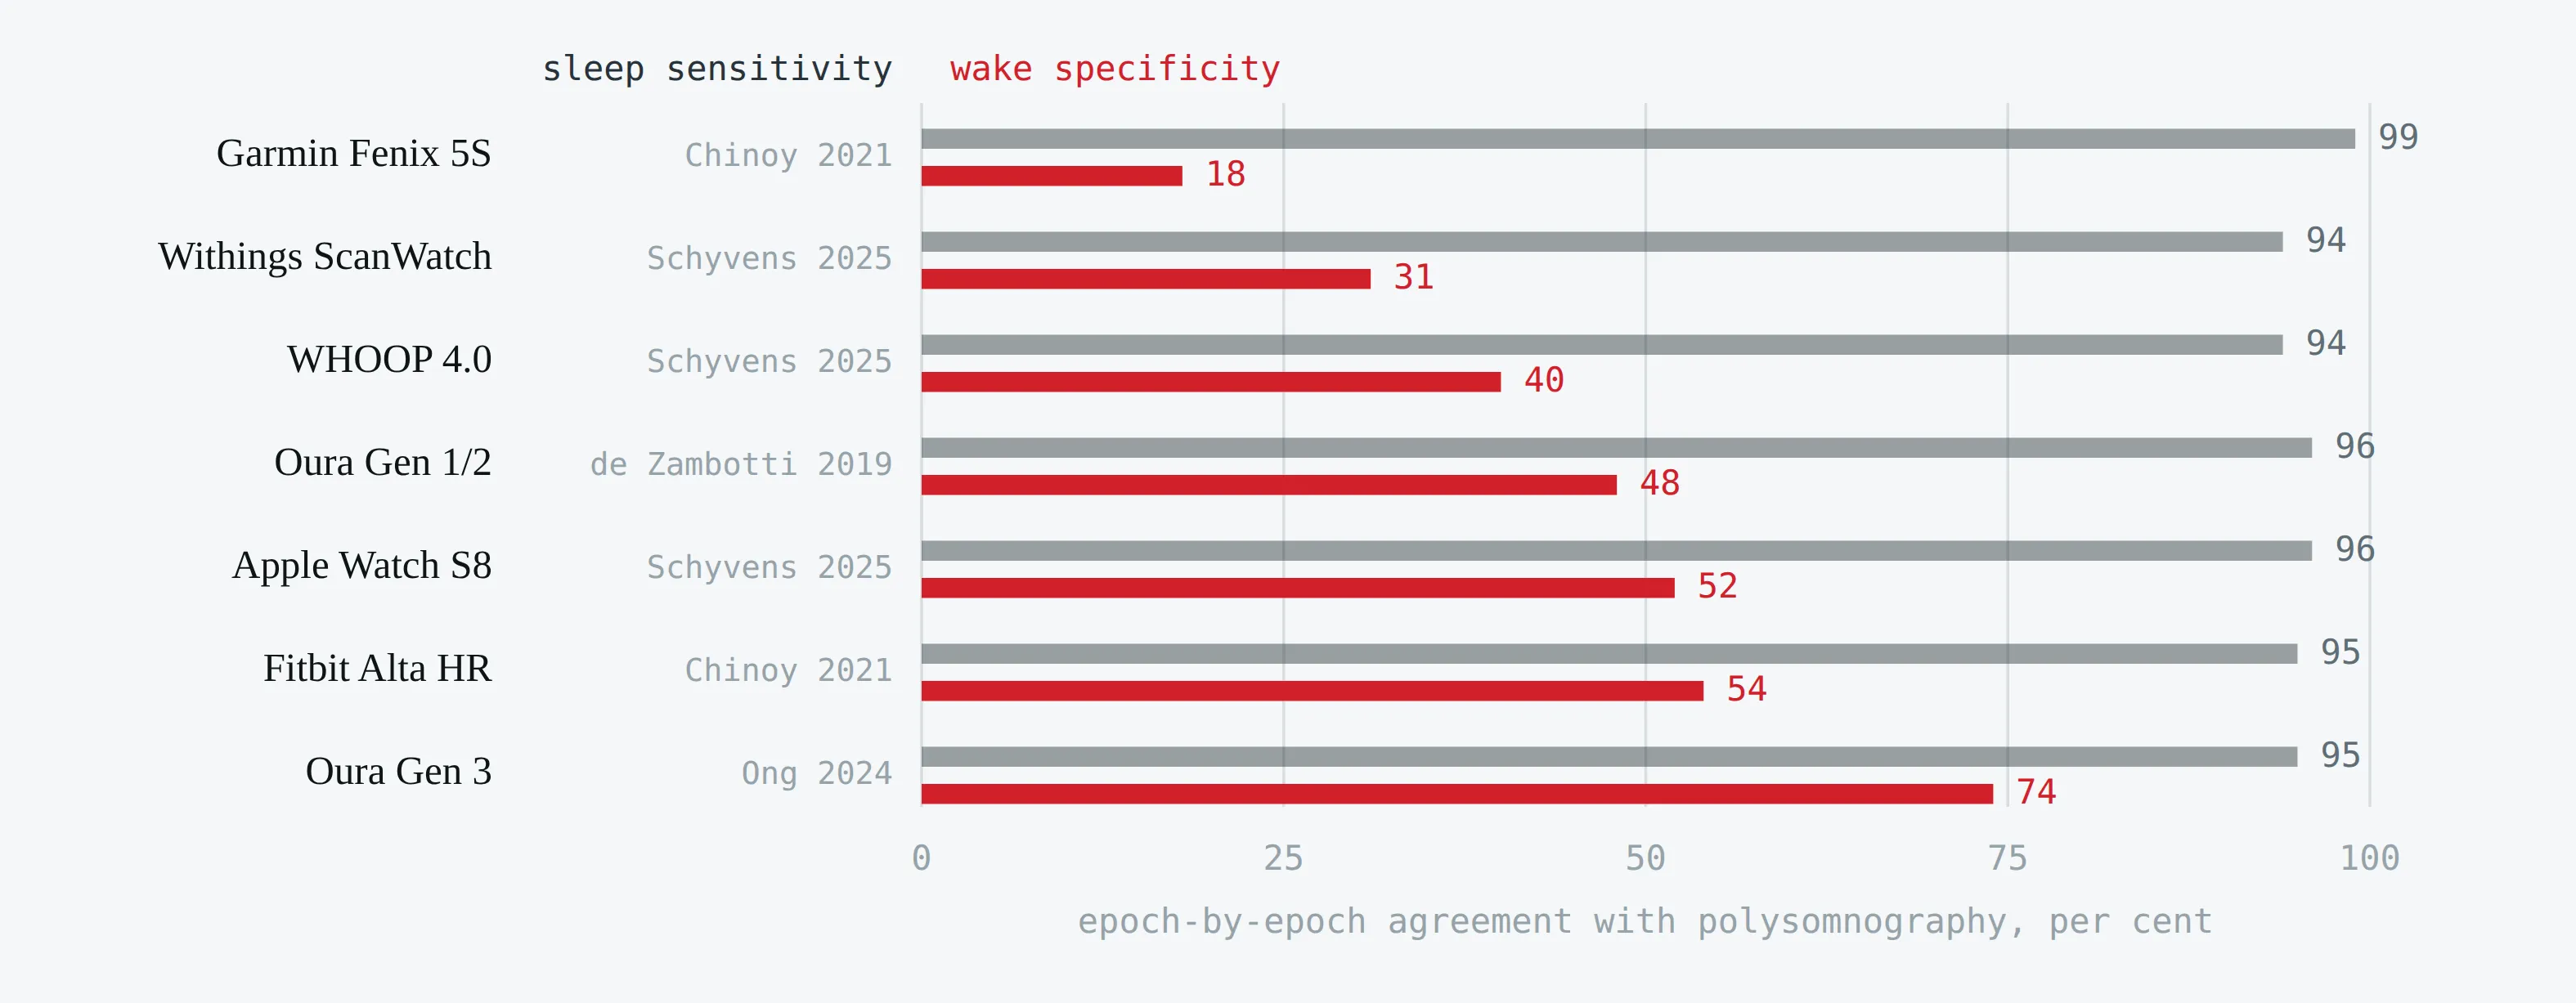
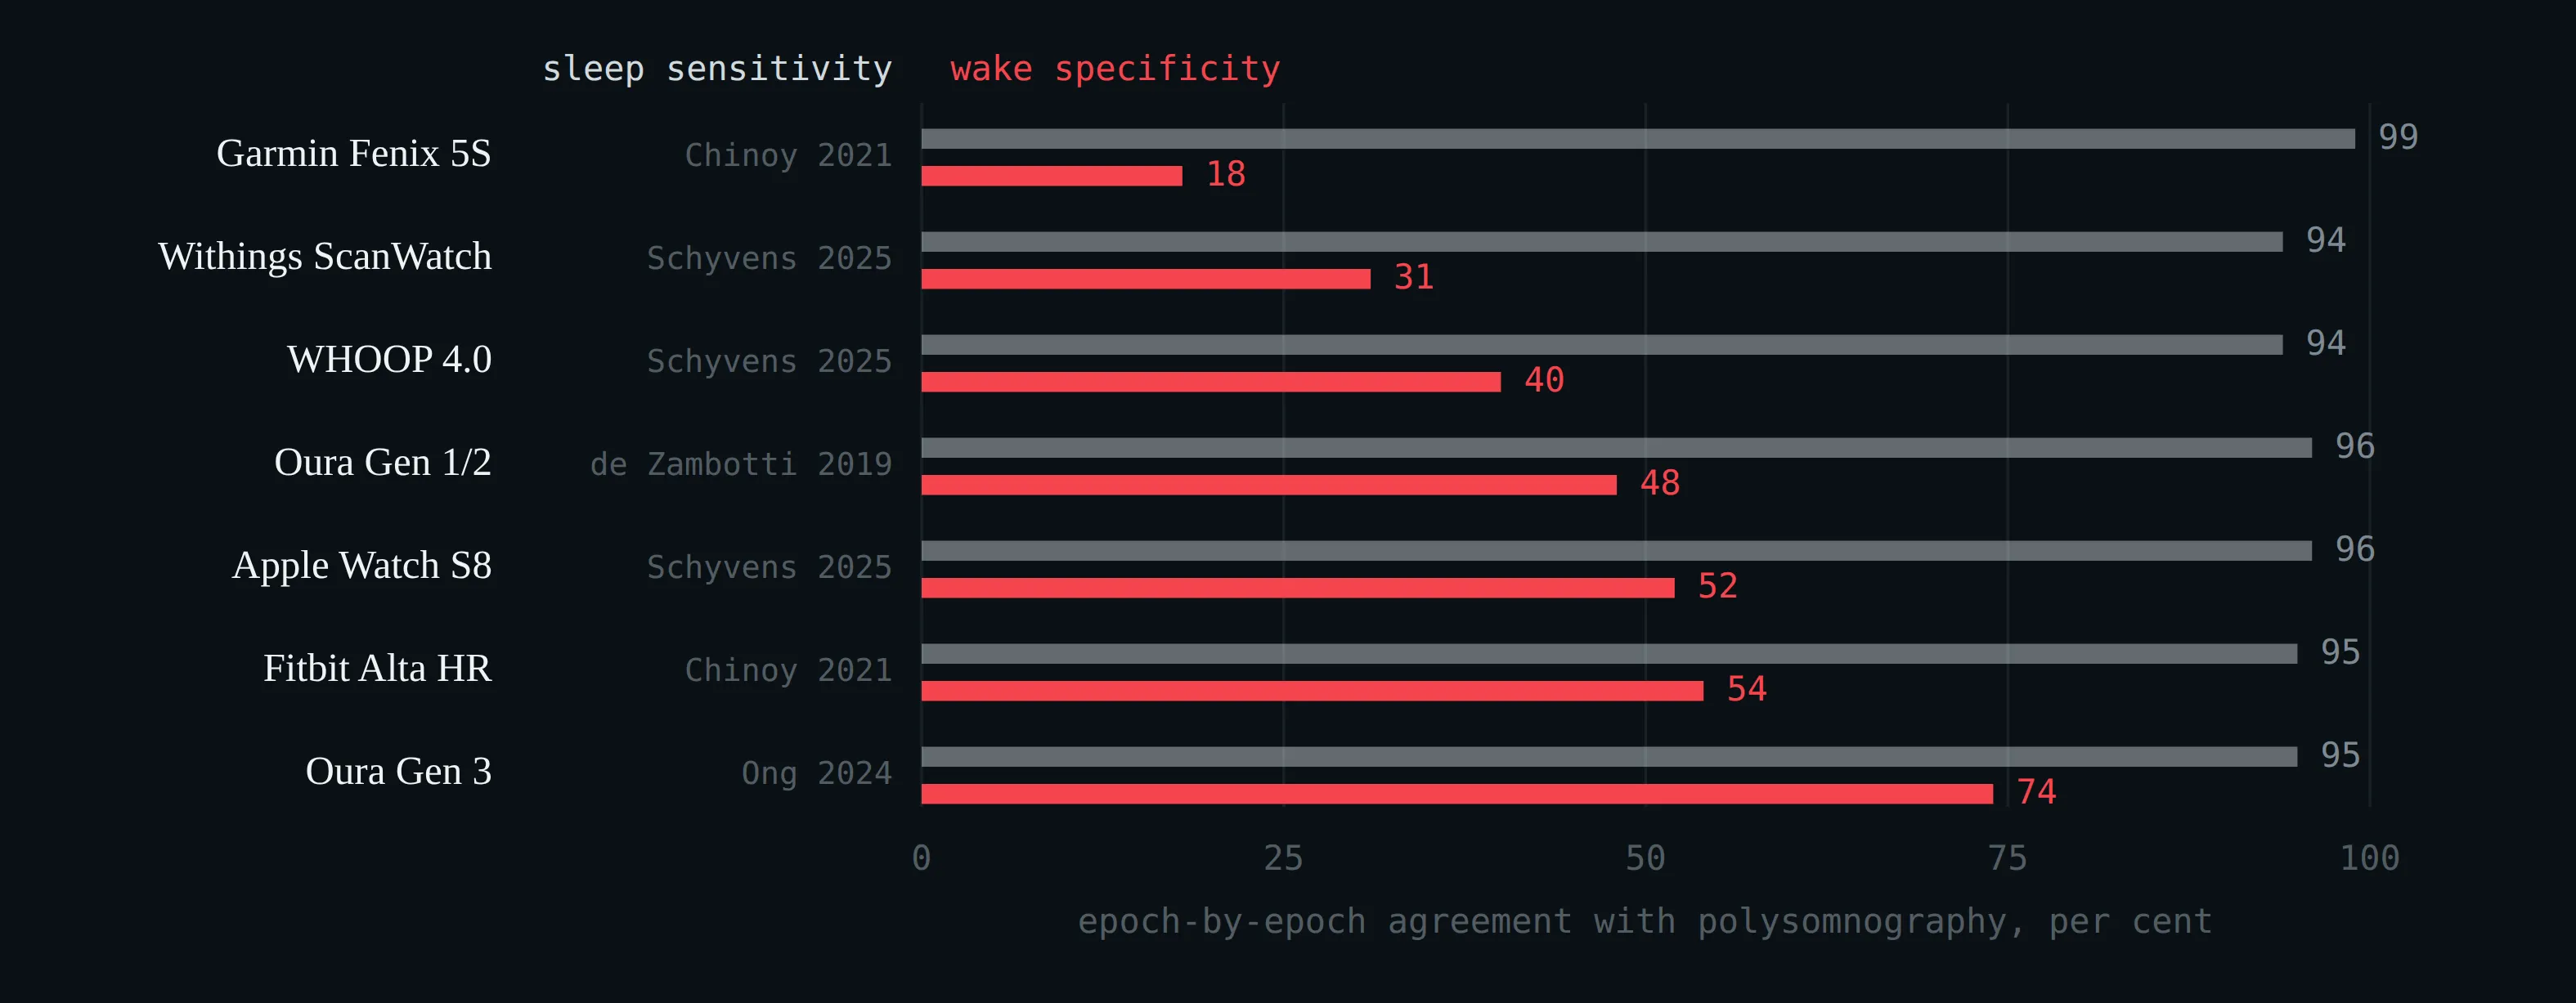
Sleep sensitivity and wake specificity for seven consumer devices against polysomnography (Chinoy et al. 2021; de Zambotti et al. 2019; Ong et al. 2024; Schyvens et al. 2025). The sensitivities are all alike; the specificities are not. Accuracy, the statistic usually quoted, is dominated by the sensitivity.
Across the wider literature, wake specificity for consumer devices runs from 0.18 to 0.74 — de Zambotti et al. (2019) found 48.1% for the Oura Ring, Ong et al. (2024) found 73.7% for the Gen 3, Schyvens et al. (2025) found 29–52% across six wrist devices.
And the κ that is missing. Four-stage Cohen’s κ across consumer devices runs 0.21–0.70, pooling at about 0.52–0.58 with a mean four-stage accuracy of 65% (Birrer et al. 2024). For scale, the human ceiling: in the AASM inter-scorer reliability programme — over 2,500 scorers, more than three million scoring decisions — trained technologists agreed with each other 82.6% of the time, and only 63.0% on N1 and 67.4% on N3 (Rosenberg and Van Hout 2013). A device at 76% four-stage agreement is therefore not far below human scorers on average; but the scorers disagree at transitions, while the device errs in whole blocks.
Watch, too, for PABAK in place of κ. PABAK removes the prevalence penalty — which is to say, it restores the number by assuming a fifty-fifty sleep/wake prevalence that sleep data does not have. A paper reporting PABAK 0.83 and no raw κ has not reported agreement; it has reported agreement under a counterfactual.
In minutes rather than coefficients: deep-sleep and REM estimates carry single-night errors of roughly 30 to 70 minutes, on quantities whose true nightly value is only 60–120 minutes (de Zambotti et al. 2019; Schyvens et al. 2025). A pooled meta-analysis of six Oura studies put the mean deep-sleep difference at +1.4 min, 95% CI −10 to +13 — near-zero bias, useless for a single night (Khan et al. 2025). This is the same bias-versus-limits-of-agreement lesson as §3.2, on a different quantity.
The four studies a vendor accuracy page cites, and who produced each one — plus the independent study it does not cite.
| Study | What it reports | Relationship to the manufacturer |
|---|---|---|
| Sensors 2021 (n = 106, 440 nights) | 79% four-stage, 96% two-stage | Written by a company employee and a company advisor |
| Sleep Health 2024 (n = 60, in-lab PSG) | 91.1% two-stage, κ 0.64; four-stage κ 0.55–0.70 | Data collection funded by the manufacturer |
| Sensors 2024 (n = 35, in-lab PSG) | 76.3% four-stage, 92% two-stage, κ 0.65; stage sensitivity 76.0–79.5% | Funded by the manufacturer; first author on its medical advisory board |
| Sleep Med 2024 (n = 96, 421,045 epochs) | Accuracy 91.7%, sensitivity 94.5%, specificity 73.6%, PABAK 0.83 | Funding statement not retrievable; drew a published comment and reply |
| Behav Sleep Med 2019 (n = 41, in-lab PSG) | Sensitivity 95.5%, specificity 48.1%, deep-sleep agreement 50.9% | Independent, NIH-funded — and not cited on the page |
The four studies a vendor accuracy page cites, and who produced each one — plus the independent study it does not cite.
Three of the four cited studies were paid for or written by the manufacturer. No wake specificity appears anywhere on the page; no Cohen’s κ appears anywhere on the page. Neither omission is a fabrication, and the ranking the page claims is defensible. But a student who takes “90–96% agreement” at face value has learned nothing about how well the device distinguishes wake from sleep — which is the only hard part of the problem, and, as §3.1 shows, the part that defines the window the resting heart rate is taken over.
Two things the field itself says. The American Academy of Sleep Medicine’s position statement is that “CSTs cannot be utilized for the diagnosis and/or treatment of sleep disorders at this time” (Khosla et al. 2018). A 2020 NIH-workshop summary is blunter: “There is currently not enough evidence to support the accuracy/validity of multisensor sleep trackers in staging sleep,” and the algorithms “are likely to change over time (e.g. firmware updates)” (Depner et al. 2020).
One-Minute-Paper Topics
A One-Minute-Paper (OMP) is a short, focused prompt that students answer in ~60 seconds at the end of a session to consolidate learning, surface misconceptions, and provide formative feedback. When answering, be concise, specific, and use terminology from today’s session.
- Explain in two sentences why a wrist device uses green light and a fingertip oximeter uses red and infrared.
- A student reports that their ring’s RMSSD dropped 20 ms overnight. Name two steps in the processing chain that could produce that change without any change in cardiac autonomic activity.
- From Table 3, WHOOP has the lowest heart rate error and the lowest RMSSD error. Give one reason this does not establish that WHOOP is the most accurate device for an athlete during training.
- Two devices report the same 88% accuracy against polysomnography. One reports 44 minutes more sleep than the other. Using the base-rate argument, explain how both statements can be true.
- A paper reports PABAK 0.83 and no Cohen’s κ. What question should you ask next, and why?
- Table 5 shows that adding heart-rate variability raises four-stage accuracy from 60% to 76%. Explain in one sentence why this makes a device’s sleep report and its resting-heart-rate report statistically dependent rather than independent.
Key References
- Bent B, Goldstein BA, Kibbe WA, Dunn JP. Investigating sources of inaccuracy in wearable optical heart rate sensors. npj Digital Medicine 3, 2020: 18.
- Dial MB, Hollander ME, Vatne EA, Emerson AM, Edwards NA, Hagen JA. Validation of nocturnal resting heart rate and heart rate variability in consumer wearables. Physiological Reports 13 (16), 2025a: e70527.
- Lambe R, Baldwin M, O’Grady B, Schumann M, Caulfield B, Doherty C. The accuracy of Apple Watch measurements: a living systematic review and meta-analysis. npj Digital Medicine 9, 2026: 63.
- Nelson BW, Low CA, Jacobson N, Areán P, Torous J, Allen NB. Guidelines for wrist-worn consumer wearable assessment of heart rate in biobehavioral research. npj Digital Medicine 3, 2020: 90.
3 Measuring Resting Heart Rate — Definitions, Devices, Baselines
Learning objectives:
- Why “resting heart rate” denotes different quantities in the clinic and on different wearables
- Photoplethysmography against ECG at rest and in motion, and six questions for any accuracy claim
- The individual baseline as the reference, and deviation from it as a screening channel rather than a test
3.1 Which Resting Heart Rate?
Over twenty-four hours in 433 healthy subjects, daytime inactive heart rate averaged 54.5 ± 8.0 bpm and night-time 50.5 ± 7.6 bpm — a difference of 3.9 ± 3.8 bpm. The daily minimum fell between 03:00 and 07:00 in 53% of subjects, and at least four minutes of rest were needed for a reliable inactive reading (Speed et al. 2023).
What each source actually reports when it says “resting heart rate” — clinic, Apple Watch, Oura, Fitbit, and the undisclosed remainder.
| Source | Definition | Status |
|---|---|---|
| Clinic | Seated or supine, single reading; within-person median SD 3–5 bpm across four standardised days | ECG or palpation |
| Apple Watch | The most inactive parts of the day, excluding sleep, scheduled bedtime and Sleep Focus | Documented (vendor white paper) |
| Oura | The lowest ten-minute average detected during the night — sleep window only | Documented (support page) |
| Fitbit | Daytime rest periods plus sleeping heart rate mapped via the Brage formulation | Company-affiliated preprint |
| WHOOP, Garmin, Polar | No published computational definition located | Undisclosed |
What each source actually reports when it says “resting heart rate” — clinic, Apple Watch, Oura, Fitbit, and the undisclosed remainder.
Apple deliberately excludes sleep; Oura uses only sleep. Two devices, one word, about four beats apart by construction — before any measurement error is added.
3.2 Photoplethysmography against ECG
A living systematic review and meta-analysis — eighty-two studies, 430 052 participants, heart rate meta-analysed across twenty-two — reports at rest a mean bias of +0.21 bpm with ninety-five per cent limits of agreement from −8.14 to +8.56 bpm (Lambe et al. 2026). Near-zero bias with eight beats of agreement is the whole story: group means are trustworthy, single readings are not.
Agreement between wrist photoplethysmography and ECG, at rest and during exercise (Lambe et al. 2026). The bar is the bias; the dashed limits contain 95% of differences.
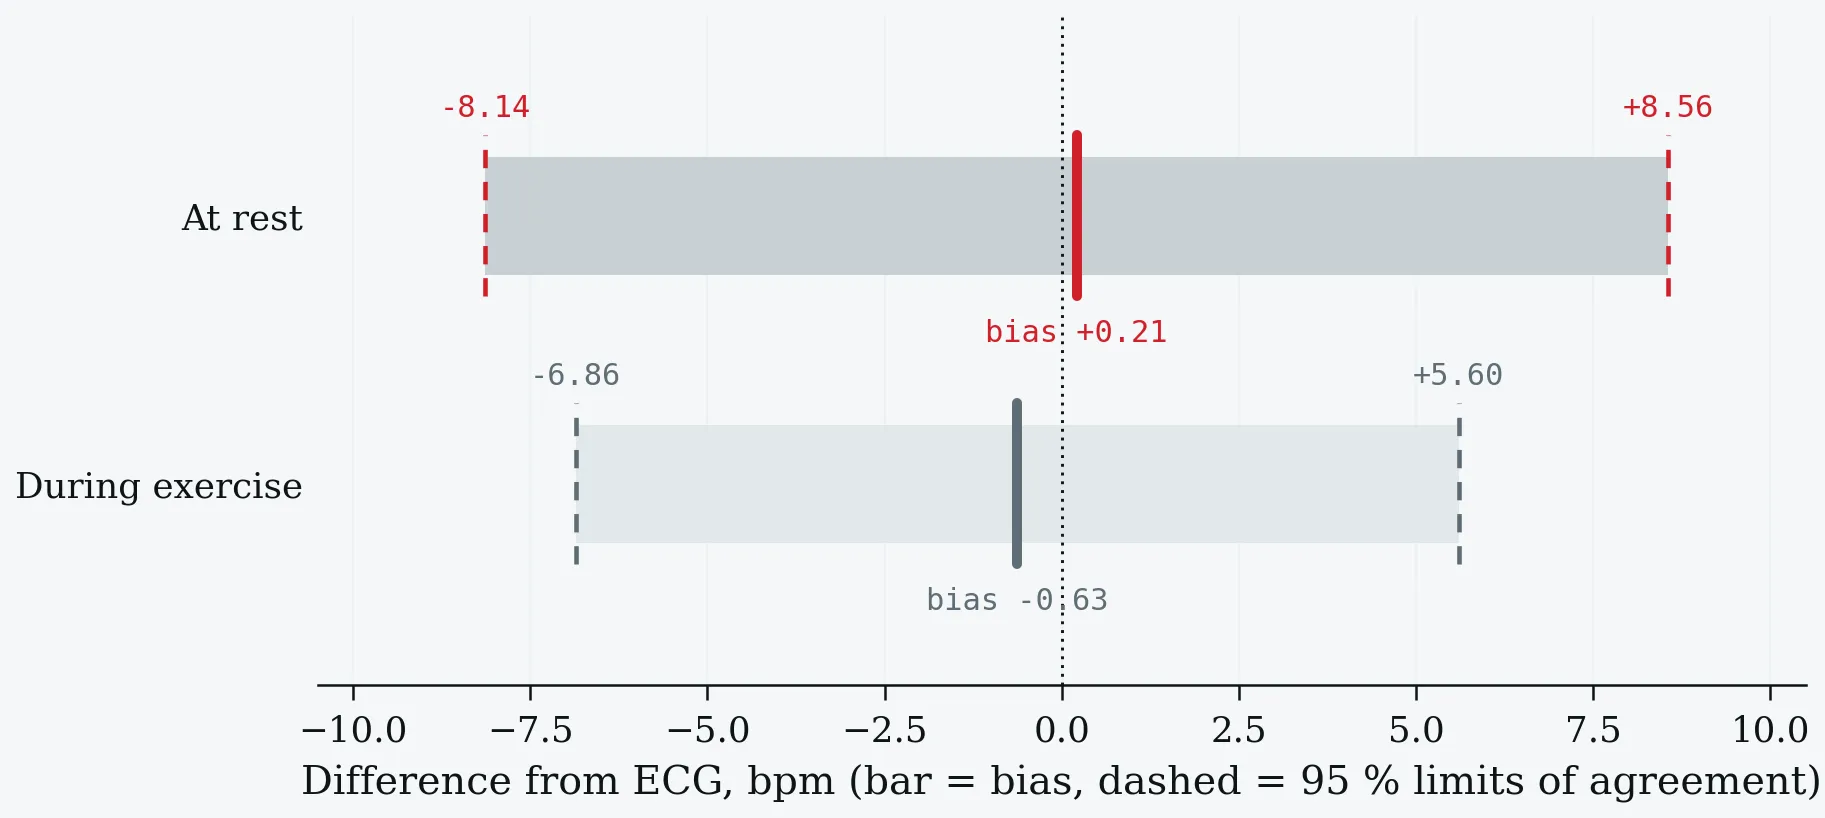
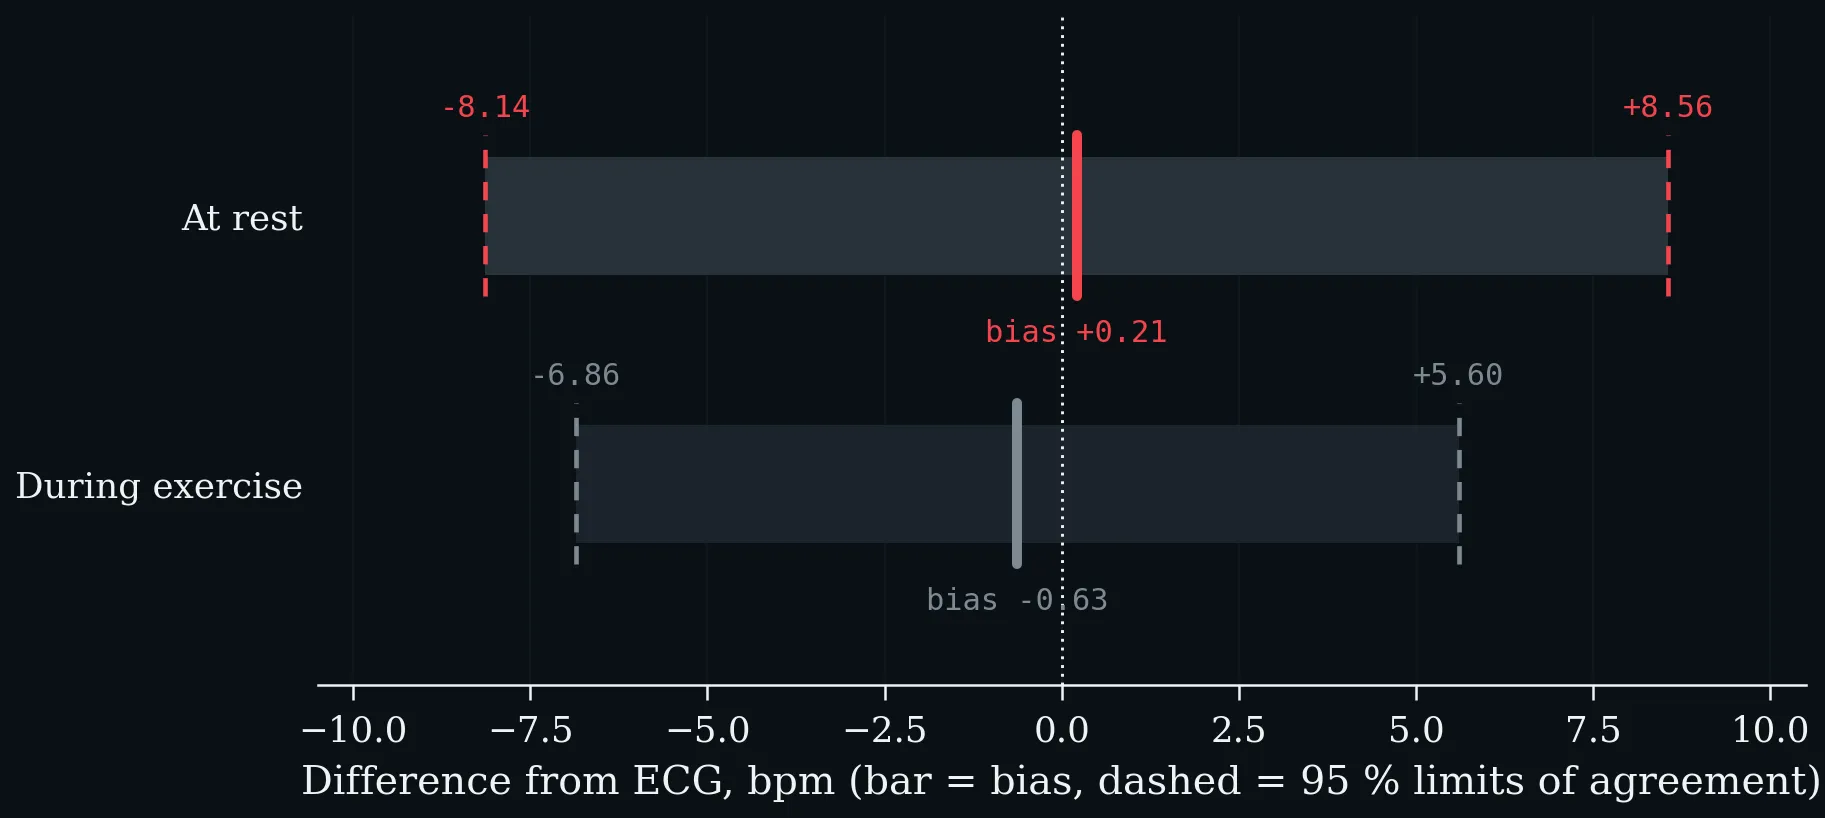
Agreement between wrist photoplethysmography and ECG, at rest and during exercise (Lambe et al. 2026). The bar is the bias; the dashed limits contain 95% of differences.
Motion costs about a third: against ECG in fifty-three participants spanning Fitzpatrick I–VI, absolute error during activity was on average 30% higher than at rest — Apple Watch 4 from 4.4 to 4.6 bpm, Xiaomi MiBand 3 from 10.2 to 13.8. Walking biases the estimate upward because the algorithm locks onto step cadence (Bent et al. 2020). The same study found no significant skin-tone effect, but only nine participants were Fitzpatrick VI, and the published response argues the null is underpowered (Colvonen 2021). Report skin type; do not report the null as settled. At night, against ECG across 536 nights: Oura Gen 3 MAPE 1.67%, Oura Ring 4 1.94%, Polar Grit X Pro 2.71%, WHOOP 4.0 3.00%; Garmin Fenix 6 was excluded because timestamps could not be aligned (Dial et al. 2025a).
3.3 Reading an Accuracy Claim — Six Questions
A worked example students can check for themselves. A manufacturer’s blog post states that its rings are “most accurate for HRV and resting heart rate” and points at that same 2025 validation study (Dial et al. 2025a) — which is genuinely independent, funded by the US Air Force Research Laboratory, and peer-reviewed. The ranking is reported correctly. The questions that remain are generic, and they are the transferable content of this section.
- Who ran it, and who is quoting it? Independent authorship and funding is the strong version. A manufacturer publicising an independent result is fine; producing it is a different weight of evidence.
- How many people, not how many nights? 536 nights came from thirteen participants, and nights from one person are not independent observations.
- Under which condition? Asleep, at rest, at night is the easiest condition photoplethysmography ever faces. Nothing transfers to daytime, to movement, or to arrhythmia.
- Against what reference? A chest-strap ECG is a good field reference — not a clinical twelve-lead, and not the office measurement from which the epidemiological thresholds of §1 were derived.
- Which metric was validated? Agreement on interbeat intervals is not agreement on the app’s displayed resting heart rate; undisclosed processing sits between them.
- Who was excluded, and why? An excluded device is not a losing device. Read the exclusion reason before reading it as a ranking.
3.4 The Individual Is the Reference Range
In 92 457 adults contributing 32.7 million daily measurements, mean resting heart rate was 65.5 ± 7.7 bpm across a range of 39.7 to 108.6 — with a mean within-person daily standard deviation of 3.03 bpm. Age, sex, body mass index and sleep together explain no more than a tenth of the between-person variance (Quer et al. 2020). There is, in other words, no useful normal value to compare an individual against; there is only that individual’s own series, which is far tighter than the cross-sectional spread.
Everyday influences on resting heart rate, against the within-person daily noise band (shaded): day versus night (Speed et al. 2023), menstrual cycle phase (Shilaih et al. 2017), alcohol (Grosicki et al. 2026) and season (Quer et al. 2020). Anything smaller than roughly five beats, on one night, is weather.
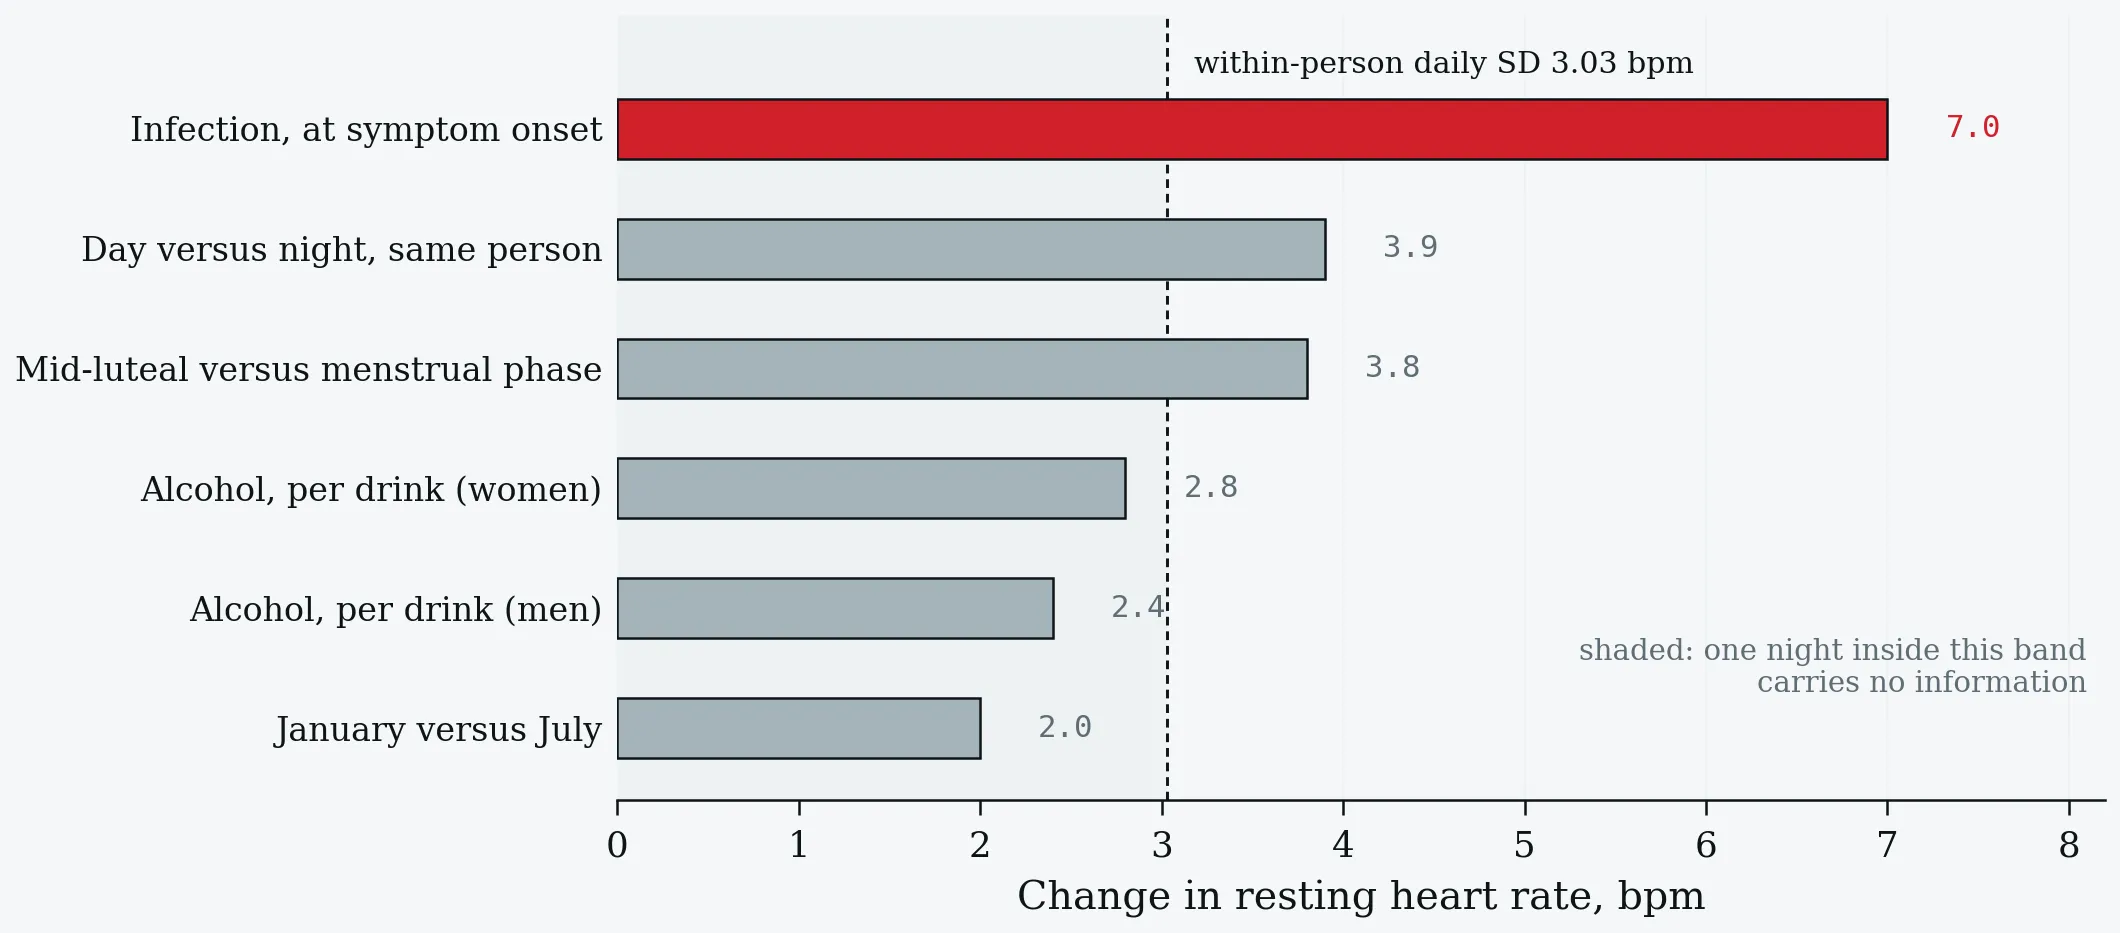
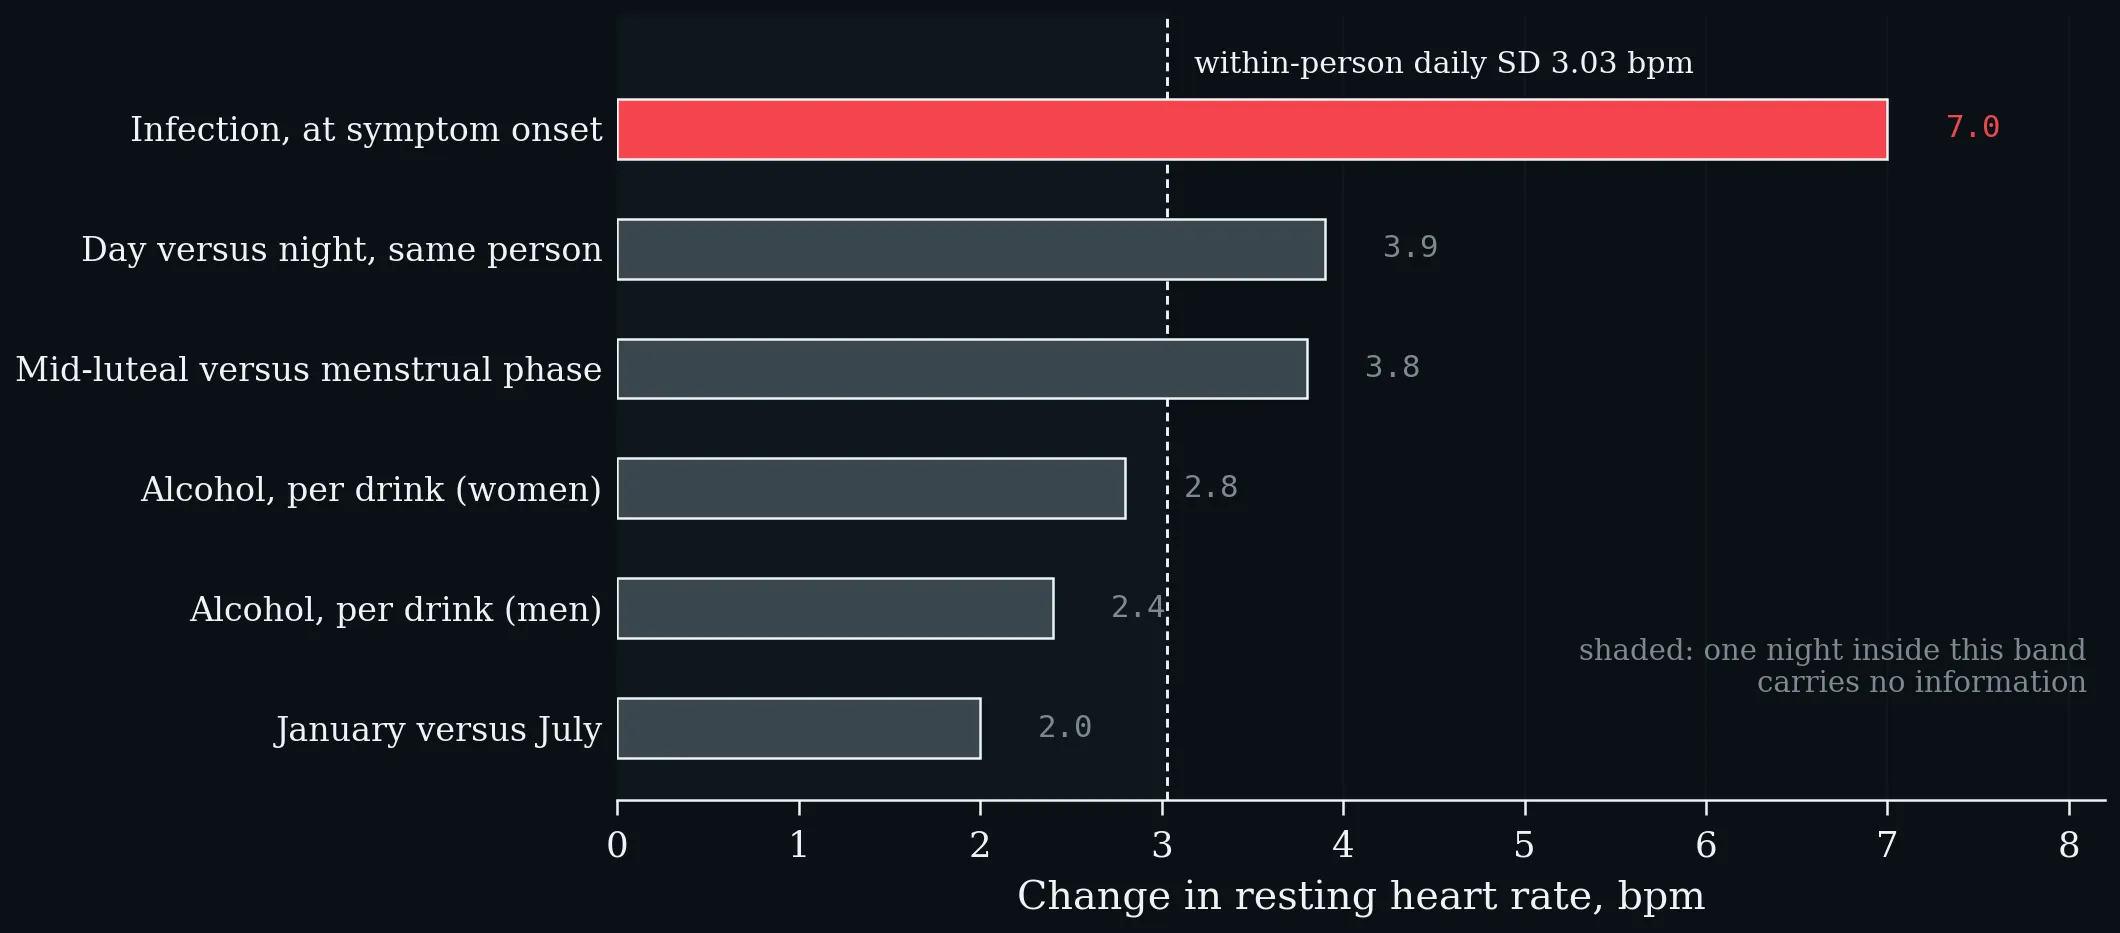
Everyday influences on resting heart rate, against the within-person daily noise band (shaded): day versus night (Speed et al. 2023), menstrual cycle phase (Shilaih et al. 2017), alcohol (Grosicki et al. 2026) and season (Quer et al. 2020). Anything smaller than roughly five beats, on one night, is weather.
A useful negative belongs here as well: as a training-load marker, resting heart rate has a smallest worthwhile change of about 2% with a signal-to-noise ratio of 0.7 — the noise exceeds the signal. Vagally mediated heart-rate variability tracks non-functional overreaching better (Buchheit 2014).
3.5 Deviation from Baseline — What It Detects
Of twenty-five COVID-19 cases with a known symptom date, twenty-two were flagged before or at onset, a median of four days early, using a twenty-eight-day sliding personal baseline that produced 0.29 false alarms per thirty healthy days (Mishra et al. 2020). At population scale, adding elevated resting heart rate and sleep from about 200 000 Fitbit users to influenza-like-illness models raised state-level correlation by 0.12 (Radin et al. 2020).
Discrimination in the DETECT study (Quer et al. 2021). Resting-heart-rate elevation alone performs at chance; its value is as one channel among several, not as a test.
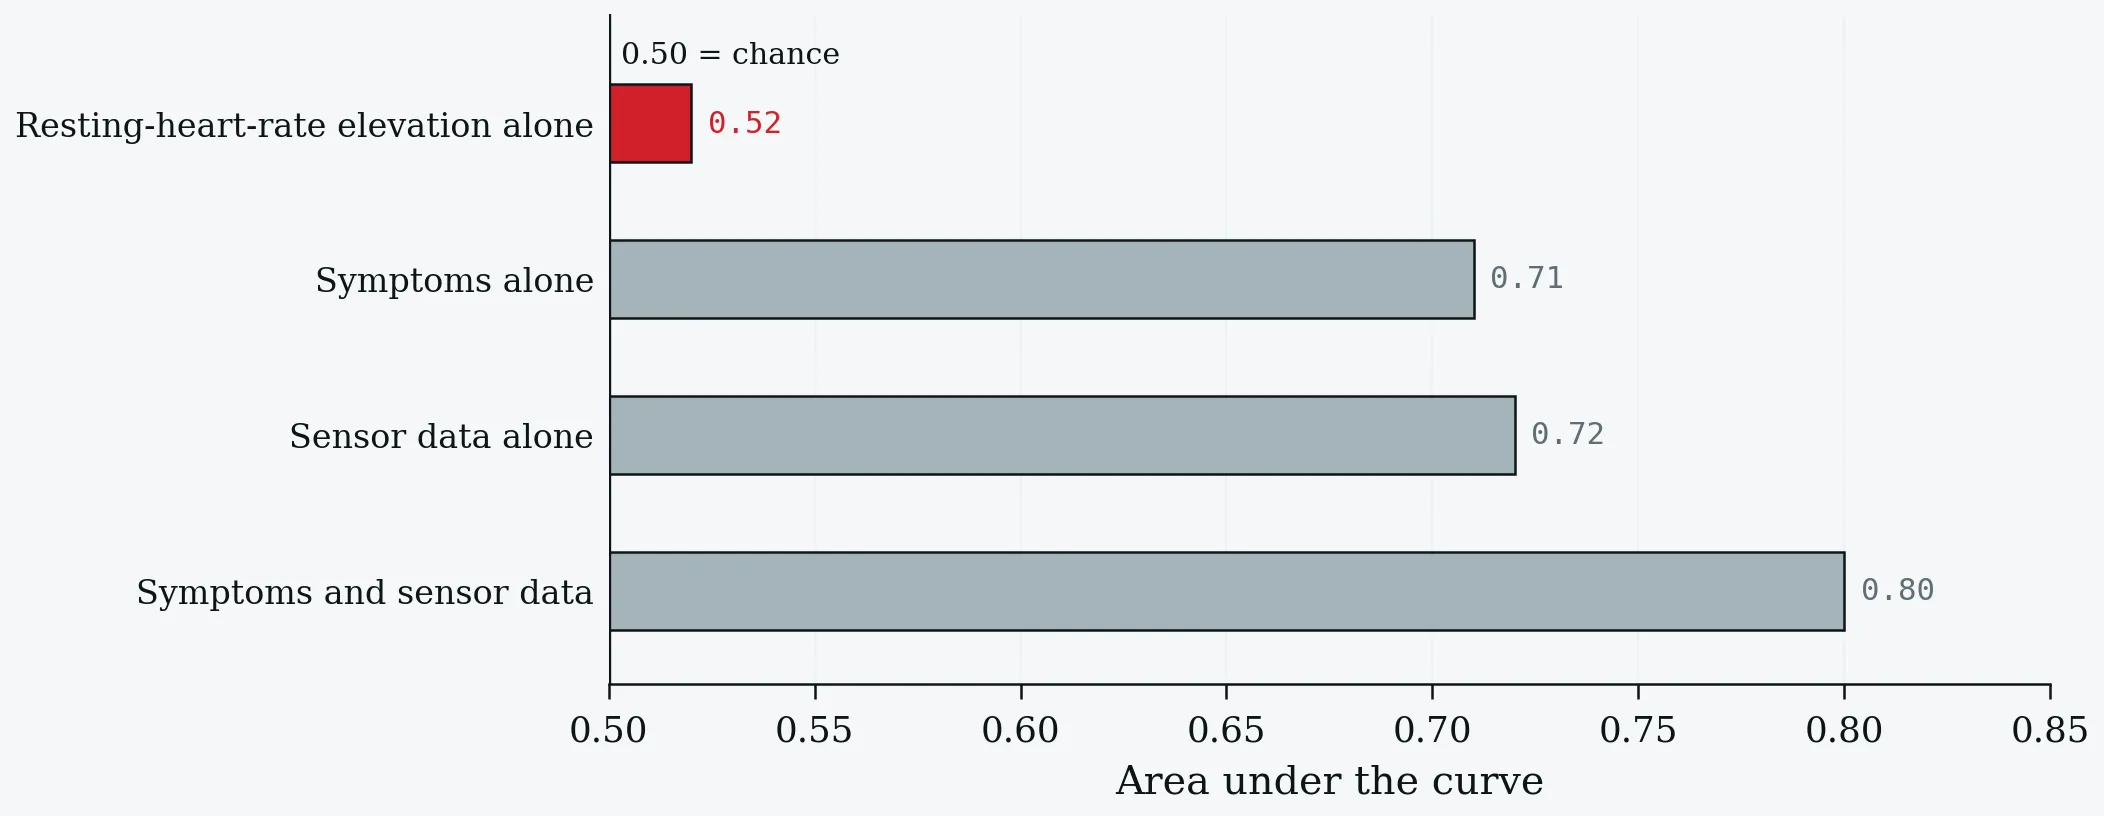
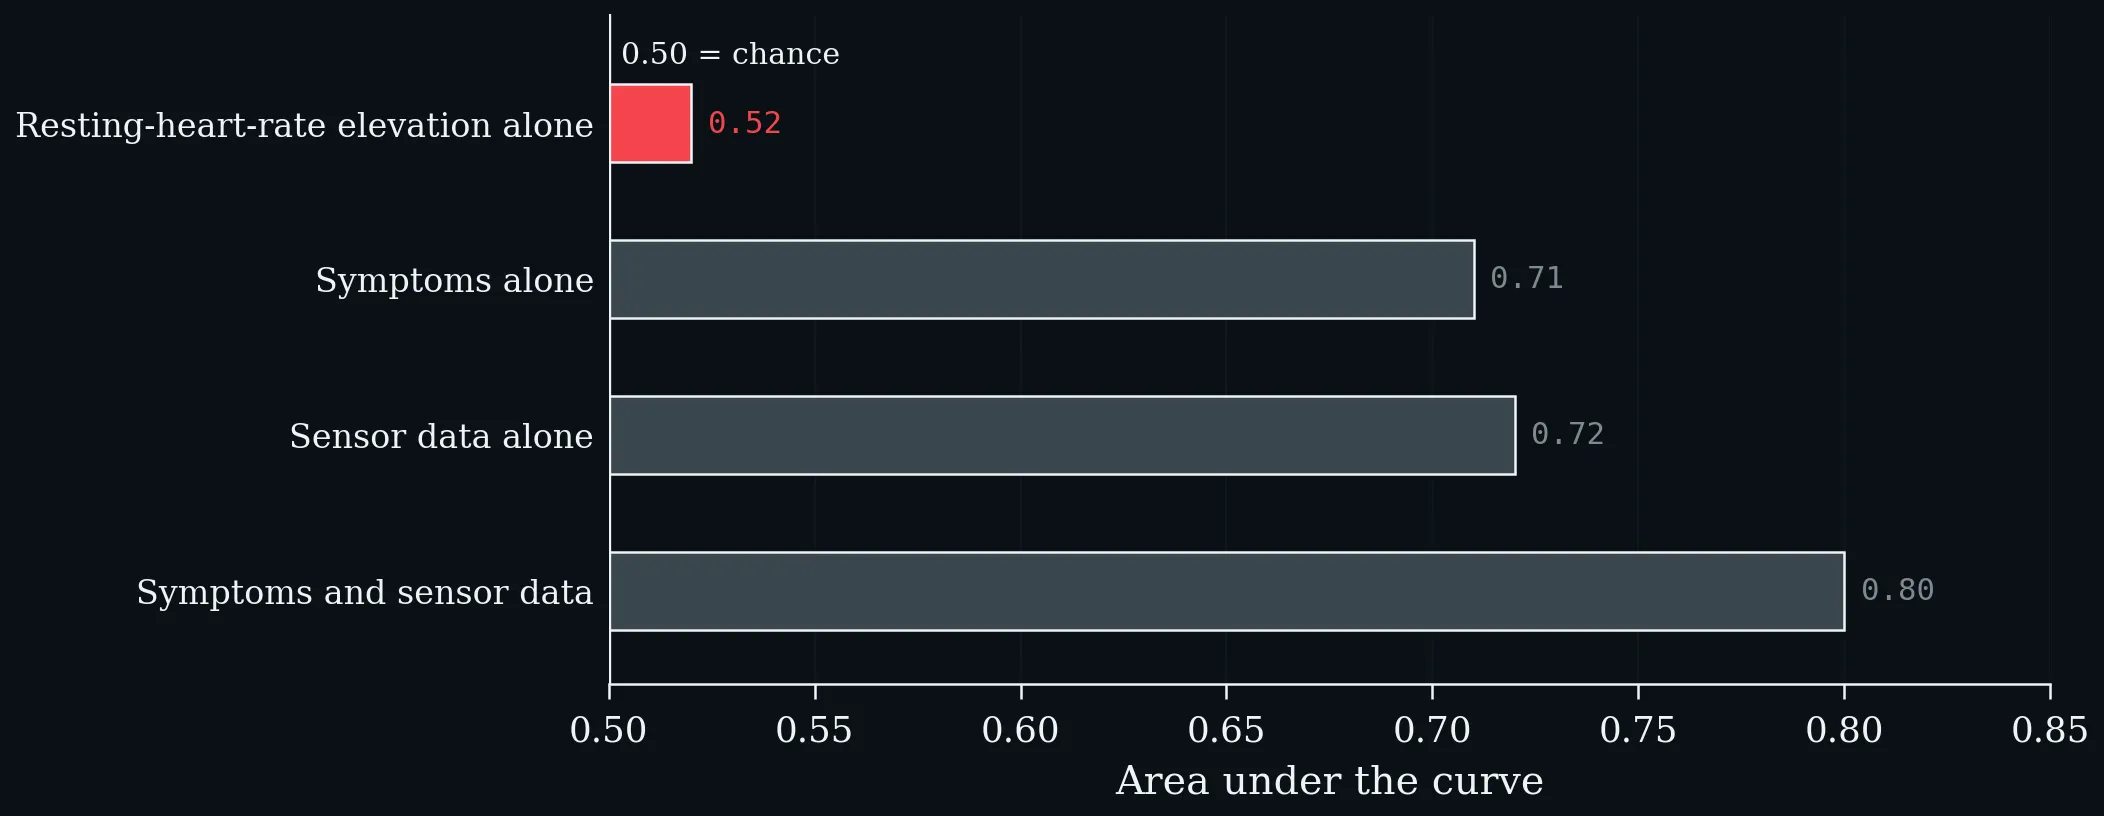
Discrimination in the DETECT study (Quer et al. 2021). Resting-heart-rate elevation alone performs at chance; its value is as one channel among several, not as a test.
Only 30.3% of symptomatic tested participants in that study ever exceeded two standard deviations above their own baseline median (Quer et al. 2021). Read the 0.52 and the 0.80 together: they are the most honest pair of numbers in this literature.
3.6 After Infection — the Slow Variable
Days to return to baseline after COVID-19 in 234 COVID-positive versus 641 symptomatic test-negative participants (Radin et al. 2021). Resting heart rate is the slowest of the three wearable metrics by a factor of more than two.
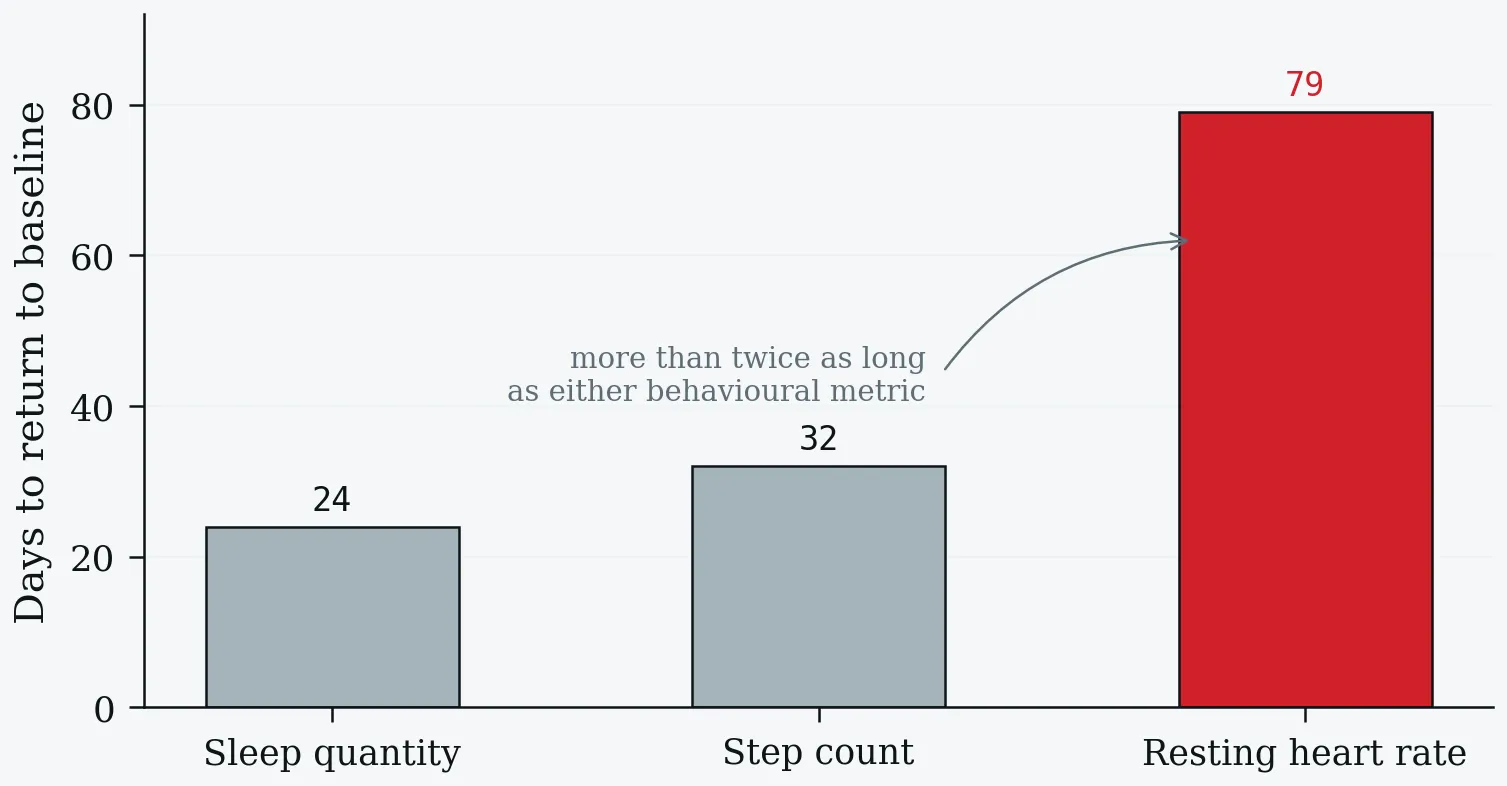
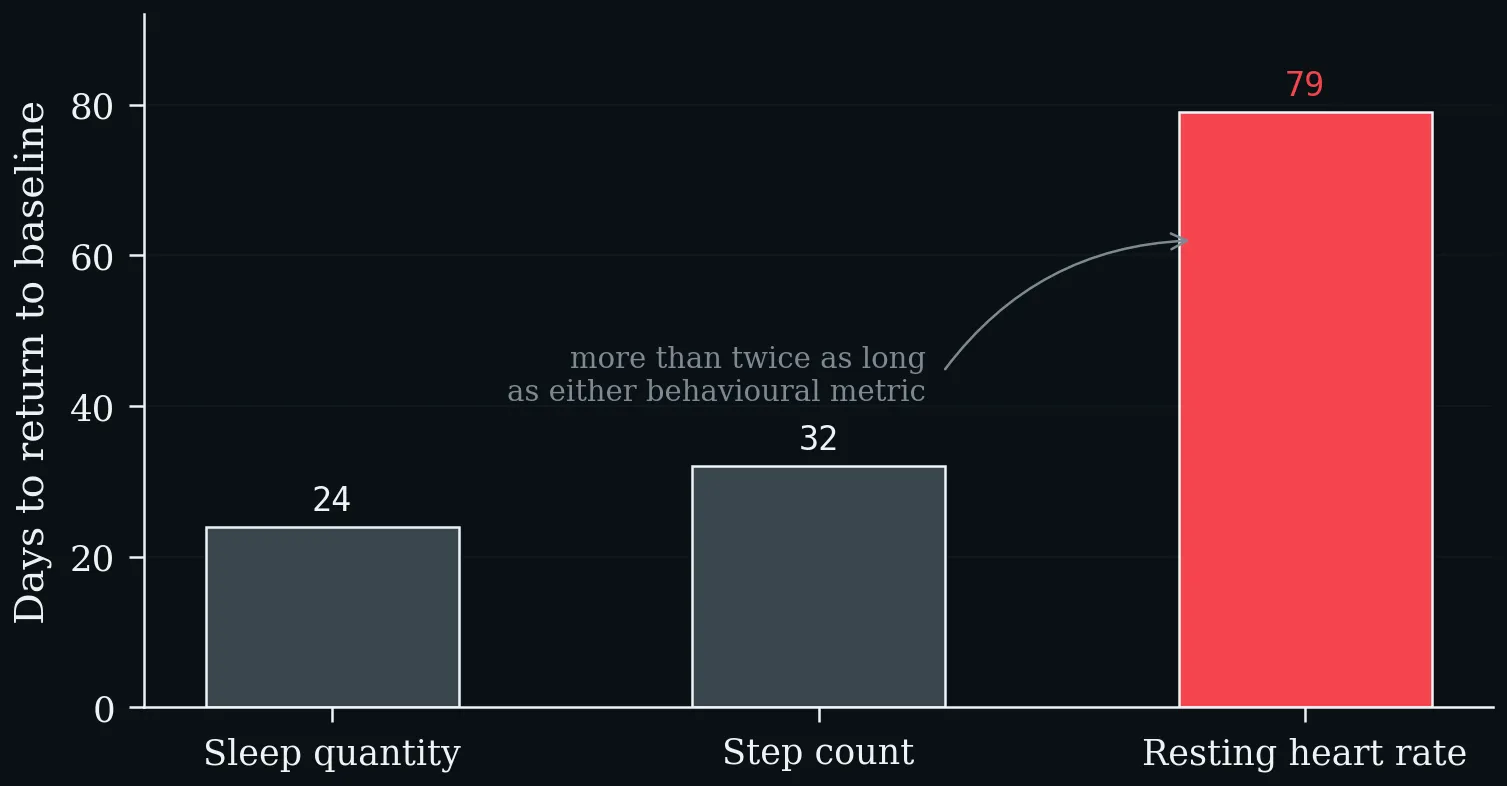
Days to return to baseline after COVID-19 in 234 COVID-positive versus 641 symptomatic test-negative participants (Radin et al. 2021). Resting heart rate is the slowest of the three wearable metrics by a factor of more than two.
The course is biphasic and long: a transient bradycardia around days nine to fifteen after symptom onset, then a prolonged relative tachycardia. And a minority does not come back at all — 13.7% held resting heart rate more than five beats above baseline beyond 133 days (Radin et al. 2021), while an independent Garmin and Oura cohort found 9.4% with persistent change, nightly heart rate about seven beats (some 13%) above baseline for months (Borhani et al. 2025).
The signature can precede the infection. In the Corona Data Donation cohort — a wearable dataset of 20 815, with a matched sub-cohort of 50 persistent-symptom cases against 150 symptom-free positives and 150 negatives — people who later reported persistent fatigue and shortness of breath already had a higher resting heart rate (by 2.37 and 1.49 bpm against the two control cohorts) and took 3030 and 2909 fewer steps per day at least three weeks before the positive test, with lower well-being and quality-of-life scores. Pre-infection resting heart rate carried a mean odds ratio of 1.31 in the predictive model, AUPRC 0.75 (Ledebur et al. 2025). Read the direction carefully: this is an association with pre-existing fitness and health, not evidence that a fast resting heart rate causes persistent symptoms.
In established chronic illness the emphasis shifts again, from the level to its stability. Among 4244 users of a symptom-tracking app living with Long COVID, ME/CFS or another energy-limiting condition, a sixty-second morning photoplethysmography reading predicted that evening’s crash — but it was the seven-day coefficient of variation of heart rate that carried the signal, with an odds ratio of 2.75 against 1.01 for the morning value itself. Adding morning biometrics to the previous day’s symptom report lifted discrimination to an area under the curve of 0.82–0.85 from 0.73–0.83: statistically clear, practically modest, and poor without a personal baseline (Aitken et al. 2026).
One-Minute-Paper Topics
A One-Minute-Paper (OMP) is a short, focused prompt that students answer in ~60 seconds at the end of a session to consolidate learning, surface misconceptions, and provide formative feedback. When answering, be concise, specific, and use terminology from today’s session.
- A student compares their Apple Watch resting heart rate with a friend’s Oura value and concludes the friend is fitter. Give two reasons why the comparison is not defensible.
- Limits of agreement at rest are −8.1 to +8.6 bpm, but the within-person daily SD is 3.0 bpm. Explain how both can be true, and what each number licenses you to say.
- Why does resting-heart-rate deviation detect infection four days early yet discriminate at 0.52? What does that tell you about screening versus diagnosis?
- Design a minimum protocol for using wearable resting heart rate in a student project: name five things you would report.
- Apply the six questions of §3.3 to the nocturnal validation study (536 nights, thirteen participants, chest-strap reference). Which two questions are most damaging to a consumer ranking, and why?
- Ledebur et al. (2025) found the pre-infection signature before the positive test. Write two sentences — one stating what this licenses, one stating what it does not.
- In the chronic-illness cohort, the seven-day coefficient of variation carried the signal (OR 2.75) and the morning value itself did not (OR 1.01). What does that contrast say about level versus variability as physiological constructs?
Key References
- Aitken A, Sawyer A, Iwasaki A, Krumholz HM, Preston R, Calcraft P, Leeming H, Tosto-Mancuso J, Proal A, Osborne MA, Putrino D. Digital physiological biomarkers predict within-person symptom changes in complex chronic illness. npj Digital Medicine 9, 2026: 257.
- Bent B, Goldstein BA, Kibbe WA, Dunn JP. Investigating sources of inaccuracy in wearable optical heart rate sensors. npj Digital Medicine 3, 2020: 18.
- Borhani S, Silva I, Damiano RJ, et al. Automatic detection of persistent physiological changes after COVID infection via wearable devices. Scientific Reports 15, 2025: 29443.
- Buchheit M. Monitoring training status with HR measures: do all roads lead to Rome? Frontiers in Physiology 5, 2014: 73.
- Colvonen PJ. Response to: Investigating sources of inaccuracy in wearable optical heart rate sensors. npj Digital Medicine 4, 2021: 38.
- Dial MB, Hollander ME, Vatne EA, Emerson AM, Edwards NA, Hagen JA. Validation of nocturnal resting heart rate and heart rate variability in consumer wearables. Physiological Reports 13 (16), 2025a: e70527.
- Grosicki GJ, Robinson AT, Joyner MJ, et al. Real-world effects of alcohol on heart rate, sleep, and physical activity by age and sex. PLOS Digital Health 5 (3), 2026: e0001284.
- Lambe R, Baldwin M, O’Grady B, Schumann M, Caulfield B, Doherty C. The accuracy of Apple Watch measurements: a living systematic review and meta-analysis. npj Digital Medicine 9, 2026: 63.
- Ledebur K, Wiedermann M, Puta C, Thurner S, Klimek P, Brockmann D. Wearable data reveals distinct characteristics of individuals with persistent symptoms after a SARS-CoV-2 infection. npj Digital Medicine 8, 2025: 167.
- Mishra T, Wang M, Metwally AA, et al. Pre-symptomatic detection of COVID-19 from smartwatch data. Nature Biomedical Engineering 4 (12), 2020: 1208–1220.
- Quer G, Gouda P, Galarnyk M, Topol EJ, Steinhubl SR. Inter- and intraindividual variability in daily resting heart rate. PLOS ONE 15 (2), 2020: e0227709.
- Quer G, Radin JM, Gadaleta M, et al. Wearable sensor data and self-reported symptoms for COVID-19 detection. Nature Medicine 27 (1), 2021: 73–77.
- Radin JM, Wineinger NE, Topol EJ, Steinhubl SR. Harnessing wearable device data to improve state-level real-time surveillance of influenza-like illness in the USA. The Lancet Digital Health 2 (2), 2020: e85–e93.
- Radin JM, Quer G, Ramos E, et al. Assessment of prolonged physiological and behavioral changes associated with COVID-19 infection. JAMA Network Open 4 (7), 2021: e2115959.
- Shilaih M, de Clerck V, Falco L, Kübler F, Leeners B. Pulse rate measurement during sleep using wearable sensors, and its correlation with the menstrual cycle phases. Scientific Reports 7, 2017: 1294.
- Speed C, Arneil T, Harle R, Wilson A, Karthikesalingam A, McConnell M, Phillips J. Measure by measure: resting heart rate across the 24-hour cycle. PLOS Digital Health 2 (4), 2023: e0000236.
4 Maximum Heart Rate — The Denominator Under Every Zone
Learning objectives:
- Maximal heart rate as a sinus-node property, and the criteria that make a test maximal
- The origin of 220 − age, the modern equations, and the size of the individual prediction error
- The eighty-five-per-cent rule and its false-negative mechanism
4.1 Definition and the Ageing Mechanism
The highest heart rate reached in an all-out effort, verified by a plateau despite rising workload. It is a property of the sinus node and its autonomic environment — not a measure of fitness and not a measure of motivation. It falls with age because intrinsic sinus-node rate declines, β-adrenergic responsiveness falls, and pacemaker tissue and calcium handling change: roughly 3–5% per decade in careful studies, against the 5–7% implied by the old rule of thumb.
4.2 What Makes a Test Maximal
Criteria for a verified maximal effort, as applied in the derivation studies of §4.4 and in the FRIEND registry.
| Criterion | Reported thresholds |
|---|---|
| Plateau in oxygen uptake | < 100 mL·min⁻¹ despite rising intensity (Tanaka et al. 2001); ≤ 2 mL·kg⁻¹·min⁻¹ (Nes et al. 2013) |
| Respiratory exchange ratio | ≥ 1.15 (Tanaka et al. 2001), > 1.05 (Nes et al. 2013), > 1.0 (Boettger et al. 2009), ≥ 1.00 (FRIEND registry; Kaminsky et al. 2015) |
| Perceived exertion | ≥ 18 on Borg 6–20 (Tanaka et al. 2001; Gellish et al. 2007); peak 18 ± 1 (Nes et al. 2013) |
| Blood lactate | ≥ 5 mmol·L⁻¹ at exhaustion (Boettger et al. 2009) |
| Protocol | Individualised so that exhaustion arrives in 8–12 minutes (Nes et al. 2013) |
Criteria for a verified maximal effort, as applied in the derivation studies of §4.4 and in the FRIEND registry.
If none of these criteria was met, what was recorded is a peak heart rate, and it should be called one.
A maximal field test can qualify. In fifty-nine intermittent-sport athletes the 30–15 Intermittent Fitness Test produced 193.8 ± 4.8 bpm against 192.1 ± 6.0 on a laboratory treadmill — no meaningful difference. The running speed it yields, however, is not interchangeable with that of continuous field tests: it ran about 20% above the University of Montreal track test and about 35% above the twenty-metre shuttle run (Buchheit 2008).
4.3 Where 220 − age Came From
The equation appears in reviews by Fox, Naughton and Haskell around 1971 (Fox et al. 1971). It was fitted by eye to data culled from roughly ten published studies — almost all male, most under fifty-five, tested under varying conditions with different criteria for a maximal effort, and probably including smokers and people with cardiovascular disease, all of which lower the achievable maximum independently of age. It was never intended as more than a rough formulation, and Fox himself speculated that the true rate of decline was smaller. It survived because it is arithmetic anyone can do, and because it was built into commercial exercise and stress-testing equipment.
It is still in use. A major wearable manufacturer’s current guidance on exercise heart-rate zones tells the reader to estimate maximum heart rate by subtracting age from 220, works a fifty-year-old example to 170 bpm, and anchors six zones — from ≤ 49% to 90–100% of maximum — to that number. The HUNT data put the average fifty-year-old at 179 bpm (Nes et al. 2013). Nine beats is most of a training zone.
4.4 The Modern Equations
Three modern equations and the rule of thumb, against measured means from two large reference cohorts (Nes et al. 2013; Kaminsky et al. 2015). All three cross 220 − age at about age forty.
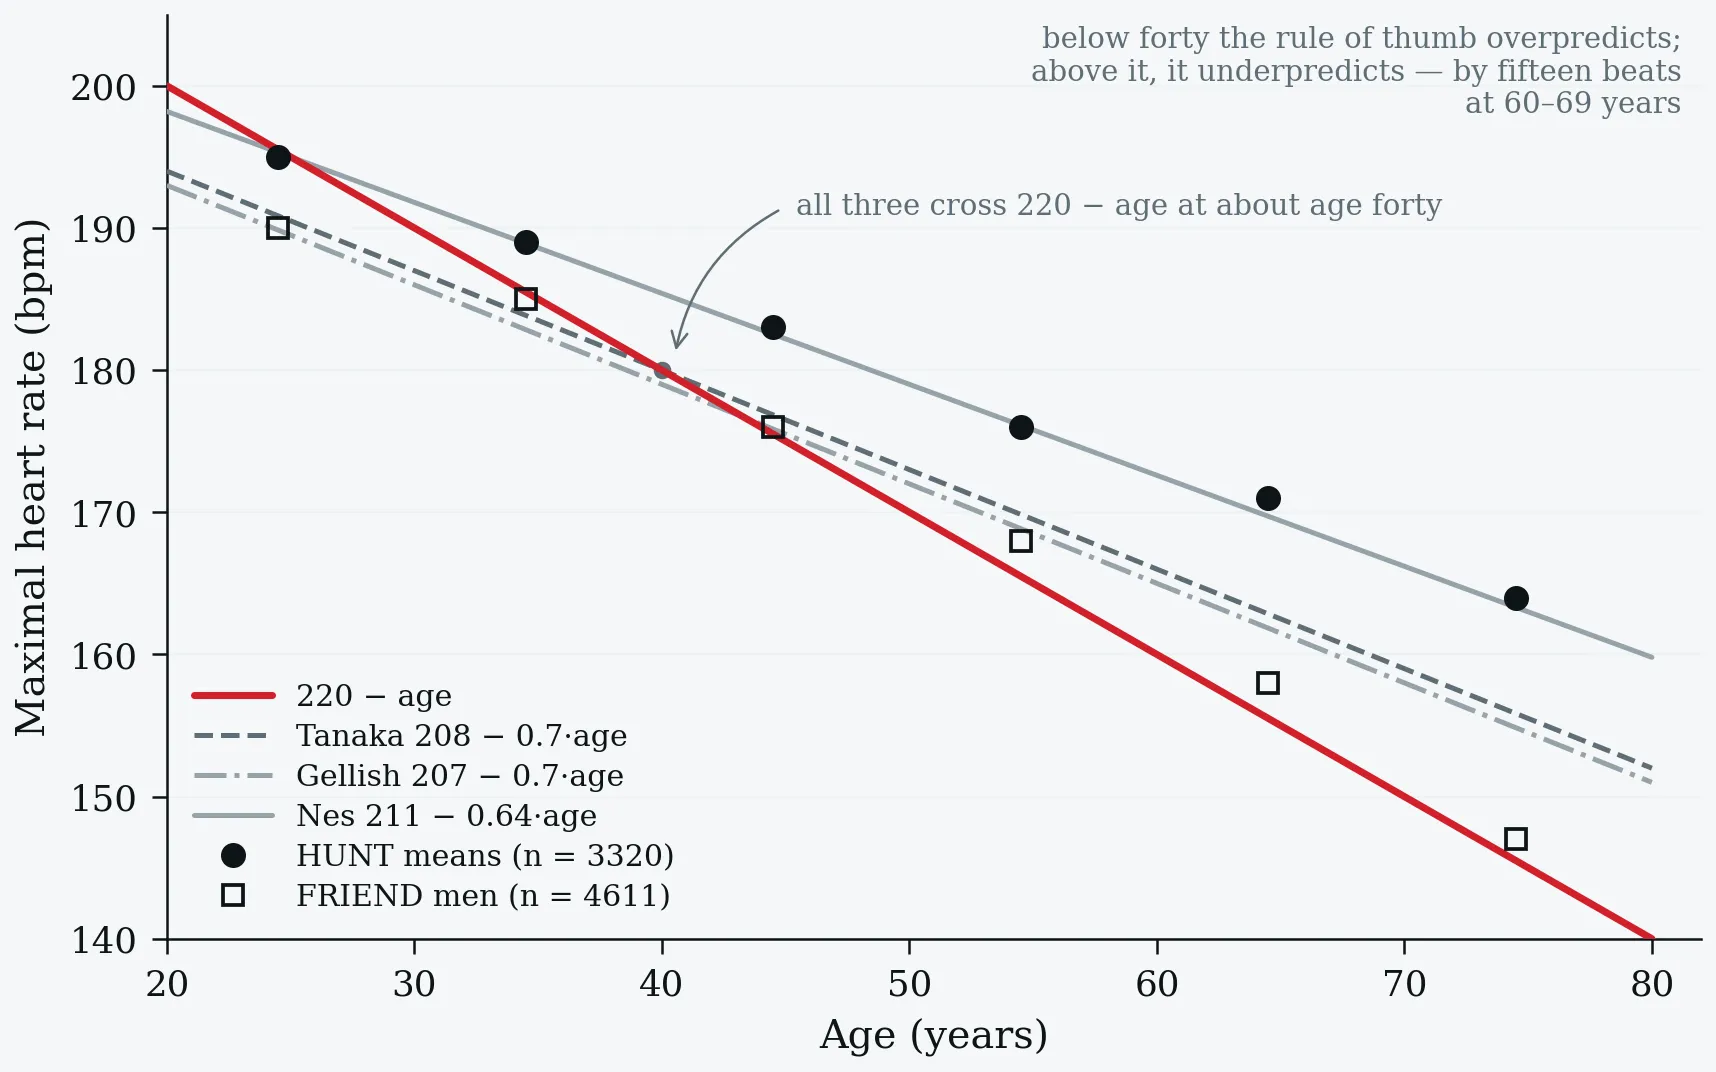
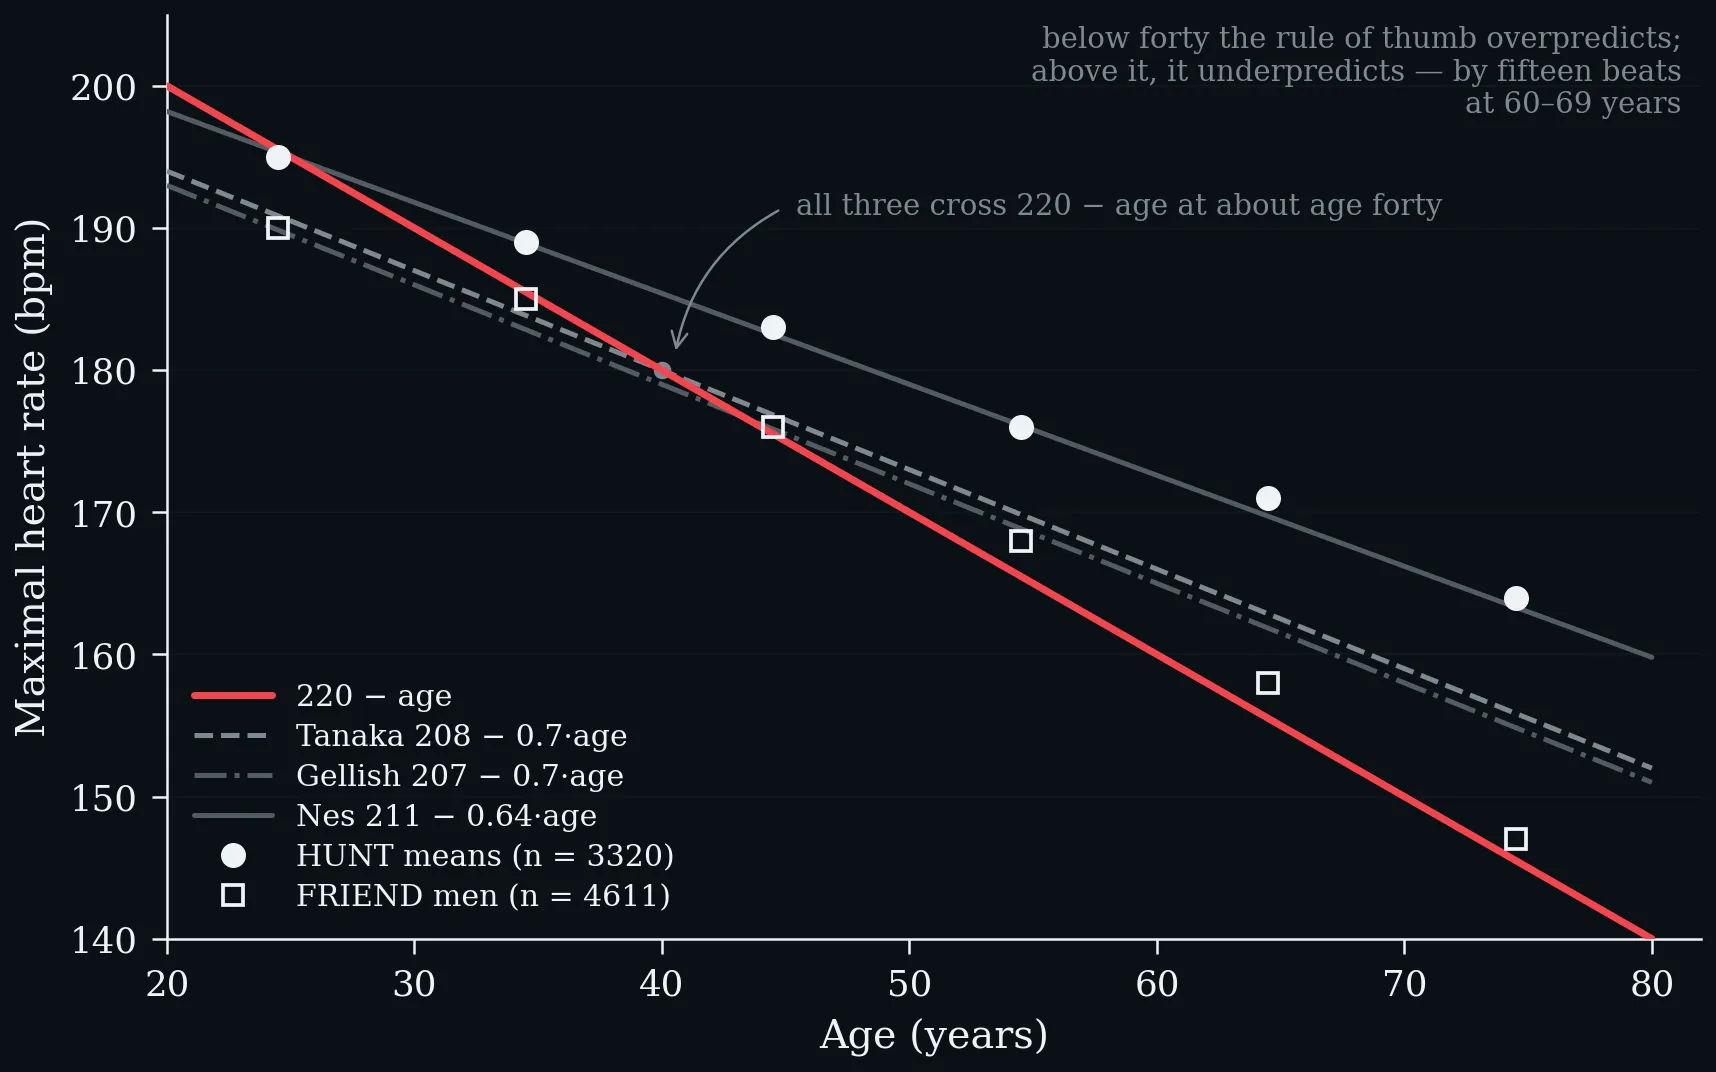
Three modern equations and the rule of thumb, against measured means from two large reference cohorts (Nes et al. 2013; Kaminsky et al. 2015). All three cross 220 − age at about age forty.
Age-prediction equations for maximal heart rate — population, design and reported precision (Fox et al. 1971; Tanaka et al. 2001; Gellish et al. 2007; Nes et al. 2013).
| Source | Year | Population | Design | Equation | Notes |
|---|---|---|---|---|---|
| Fox et al. | 1971 | Small heterogeneous sample | Heuristic linear fit | 220 − age | SD ≈ 10–12 bpm |
| Tanaka et al. | 2001 | 18 712 (meta) + 514 (lab) | Meta-analysis + cross-validation | 208 − 0.7 × age | r = −0.90; age explained ~80% of variance in group means |
| Gellish et al. | 2007 | 132 subjects, 908 tests | Longitudinal, mixed models | 207 − 0.7 × age | Repeated tests over twenty-five years |
| Nes et al. (HUNT) | 2013 | 3320 healthy adults | Population field study | 211 − 0.64 × age | SEE 10.8 bpm; R² = 0.36 |
Age-prediction equations for maximal heart rate — population, design and reported precision (Fox et al. 1971; Tanaka et al. 2001; Gellish et al. 2007; Nes et al. 2013).
Gellish’s design deserves a sentence of its own, because it answers a question the cross-sectional studies cannot. Every equation before 2007 compared different people of different ages, measured once — a design that confounds ageing with cohort, selection and survivorship. Gellish et al. (2007) followed 132 people through 908 maximal tests over twenty-five years and fitted a line per person. The slope that emerges from within individuals is the same 0.7 beats per year. Each participant’s very first test was discarded: it tends to elicit a lower maximum through apprehension and unfamiliarity — a learning effect in a measurement people treat as a constant.
4.5 The Individual Spread — and a Disagreement Between Cohorts
Nes et al. (2013) report a standard error of estimate of 10.8 bpm; Tanaka et al. (2001) found standard deviations of seven to eleven beats around the regression line; the US FRIEND registry, 7783 maximal treadmill tests from eight laboratories, reports standard deviations of eleven to twenty-one beats within single decades, widening with age (Kaminsky et al. 2015).
One fifty-year-old. The four competing formulas span nine beats; the band containing about 95% of fifty-year-olds spans forty-four.
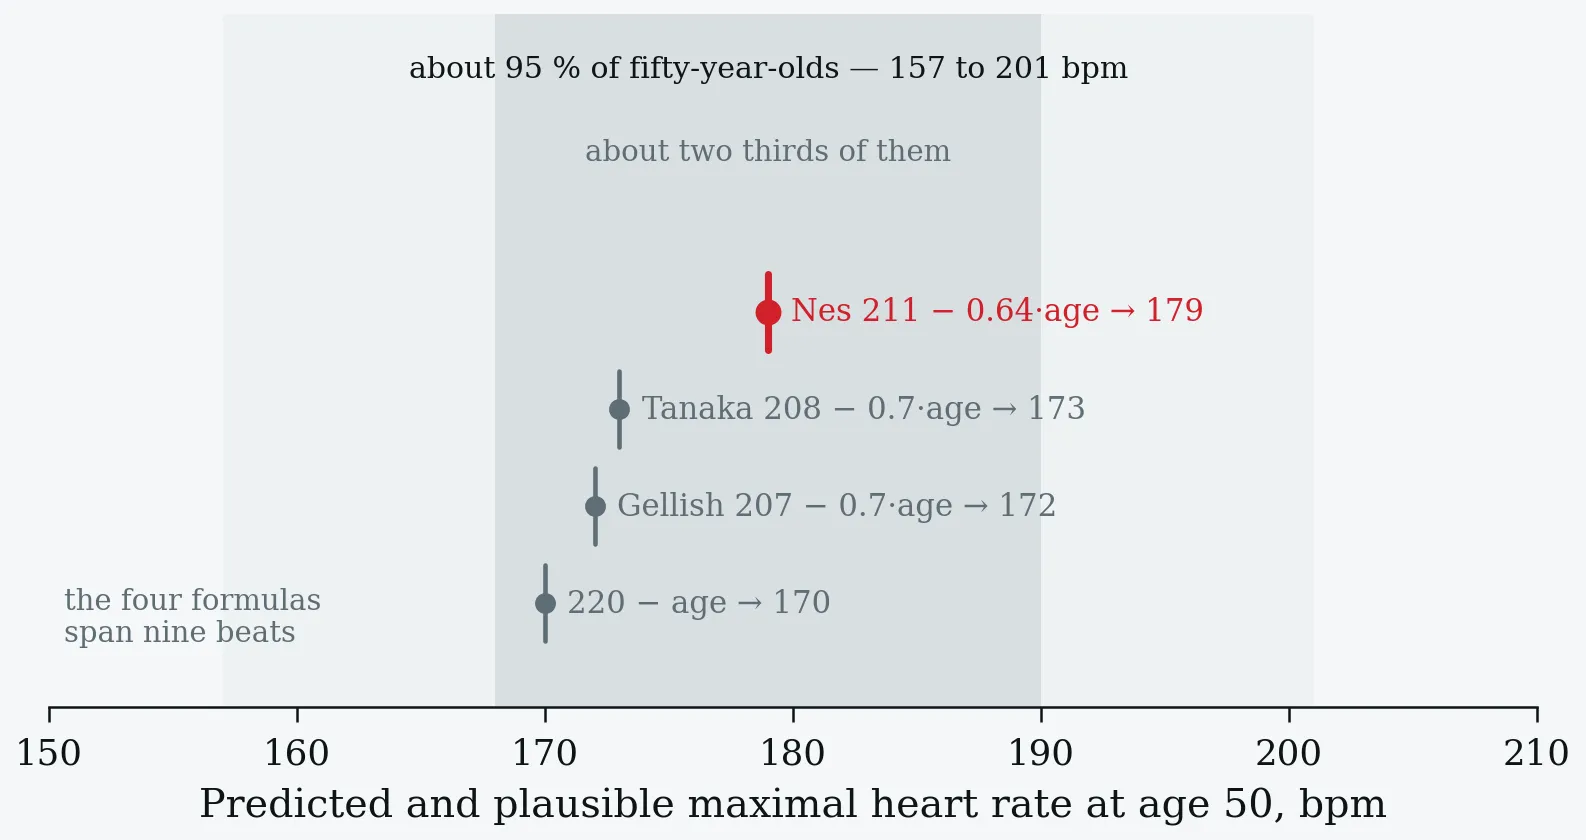
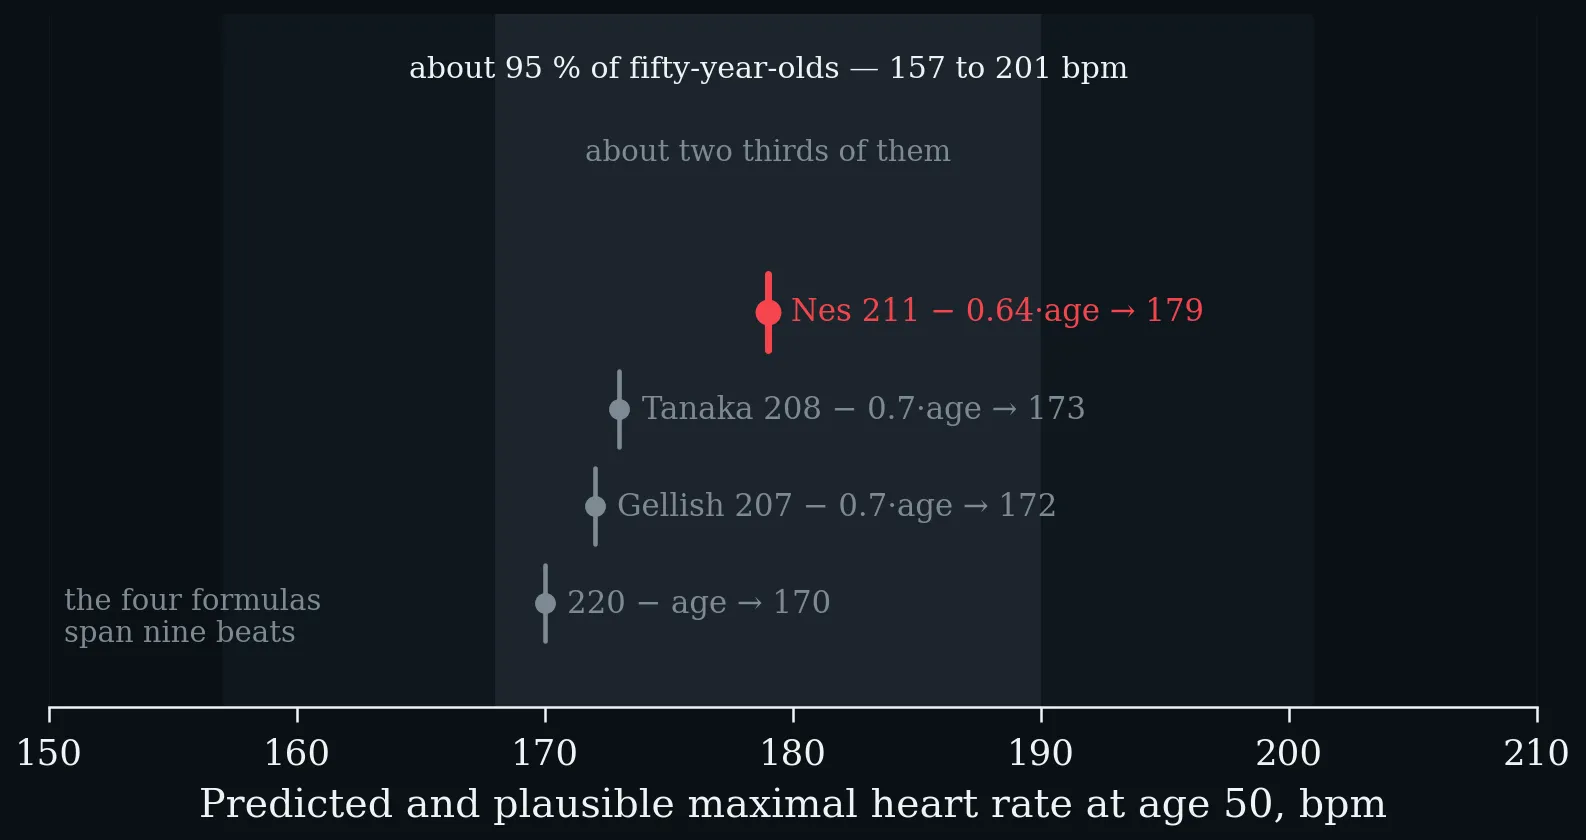
One fifty-year-old. The four competing formulas span nine beats; the band containing about 95% of fifty-year-olds spans forty-four.
Measured maximal heart rate by decade in two large reference cohorts, mean ± SD in bpm — HUNT (Nes et al. 2013) against the FRIEND registry (Kaminsky et al. 2015).
| Age group | HUNT (n = 3320) | FRIEND men (n = 4611) | FRIEND women (n = 3172) |
|---|---|---|---|
| 20–29 | 195 ± 9.9 | 190 ± 11 | 189 ± 12 |
| 30–39 | 189 ± 10.1 | 185 ± 11 | 184 ± 11 |
| 40–49 | 183 ± 10.9 | 176 ± 14 | 176 ± 14 |
| 50–59 | 176 ± 11.6 | 168 ± 14 | 167 ± 15 |
| 60–69 | 171 ± 12.3 | 158 ± 17 | 157 ± 17 |
| 70+ | 164 ± 12.4 | 147 ± 20 | 147 ± 21 |
Measured maximal heart rate by decade in two large reference cohorts, mean ± SD in bpm — HUNT (Nes et al. 2013) against the FRIEND registry (Kaminsky et al. 2015).
Discussion prompt. The two cohorts agree through midlife and diverge by seventeen beats in the oldest decade: a Norwegian population sample with an individualised protocol against a US clinical registry admitting a respiratory exchange ratio of 1.00. Which differences in design could produce this, and which equation would you use for a seventy-two-year-old?
4.6 What It Does Not Depend On
Not habitual activity: adding activity, sex, smoking and body mass index to the HUNT age model changed the explained variance by 0.007 (Nes et al. 2013), and Tanaka et al. (2001) found no difference between sedentary, active and endurance-trained groups. Not aerobic capacity: across sex-specific tertiles of peak oxygen uptake there was no age-adjusted difference in women and 2.4 beats between low and high fitness in men. Barely sex: women were 1.4 beats lower after adjustment in HUNT (Nes et al. 2013), and no different at all in Tanaka et al. (2001). But it does depend on the protocol, on the effort actually given, and on rate-limiting medication — an exclusion criterion in all three derivation studies.
A fit sixty-year-old does not have a higher ceiling than an unfit one. They reach a higher fraction of it, and recover from it faster — which is §5.
4.7 The Cost of a Wrong Ceiling: the Eighty-Five-Per-Cent Rule
Diagnostic exercise tests are commonly called nondiagnostic if the subject fails to reach 85% of age-predicted maximum without signs of ischaemia. The target is arithmetic from a formula, applied to an individual — and in HUNT, 76.6% of participants had a maximum above 220 − age. Using 85% of that predicted value, only 23.6% of the population would actually have reached 85% of their own true maximum (Nes et al. 2013).
Share of HUNT participants whose measured maximum exceeded 220 − age, by age band (Nes et al. 2013). The underprediction grows with age, reaching fifteen beats at 60–69 years.
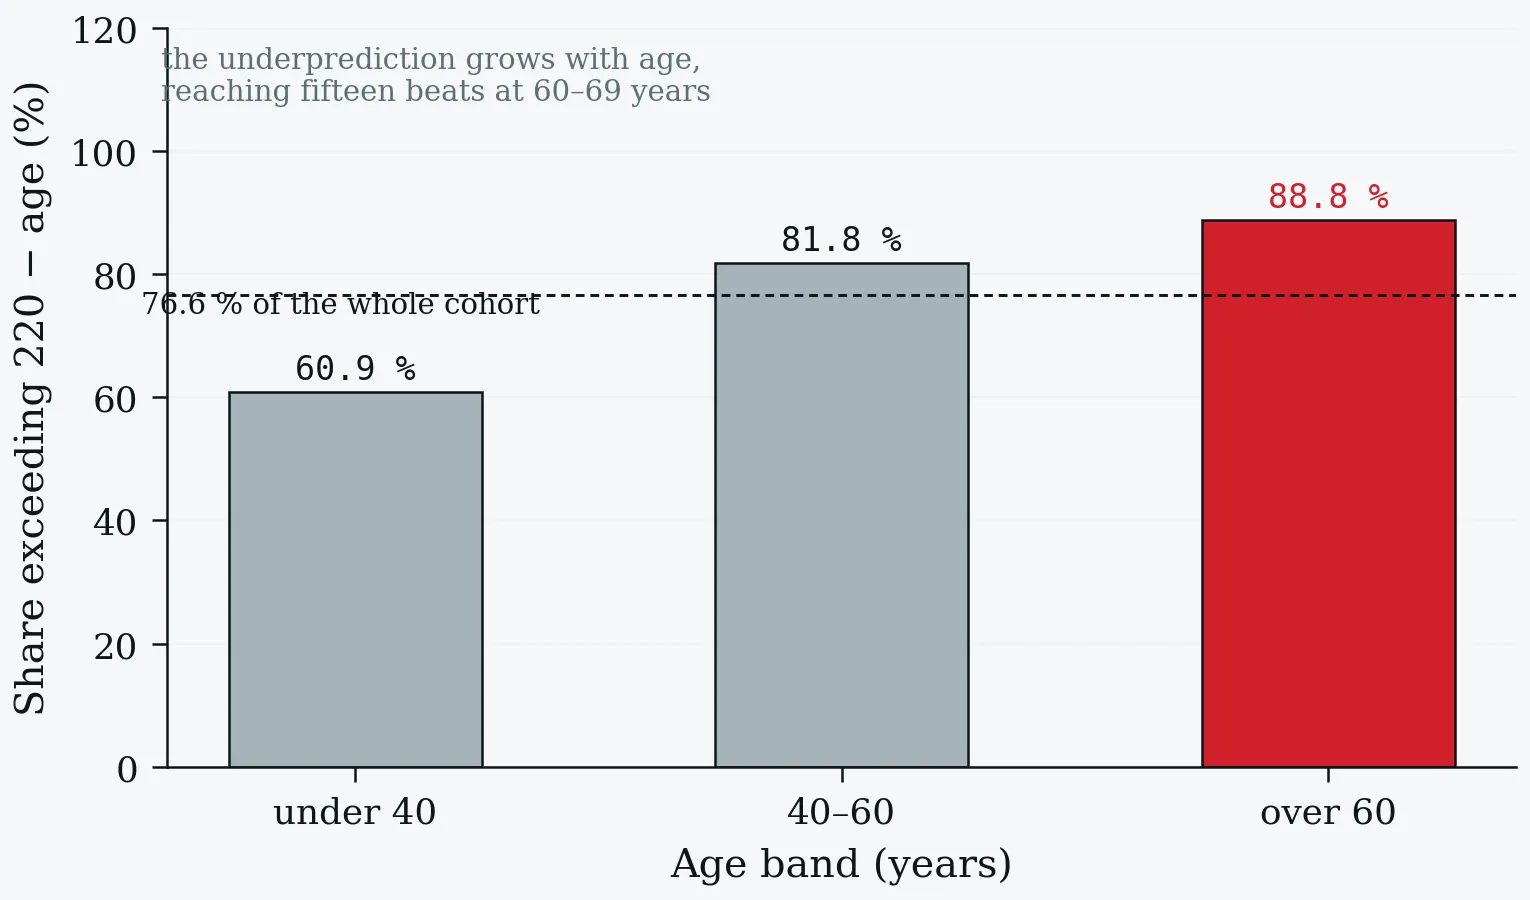
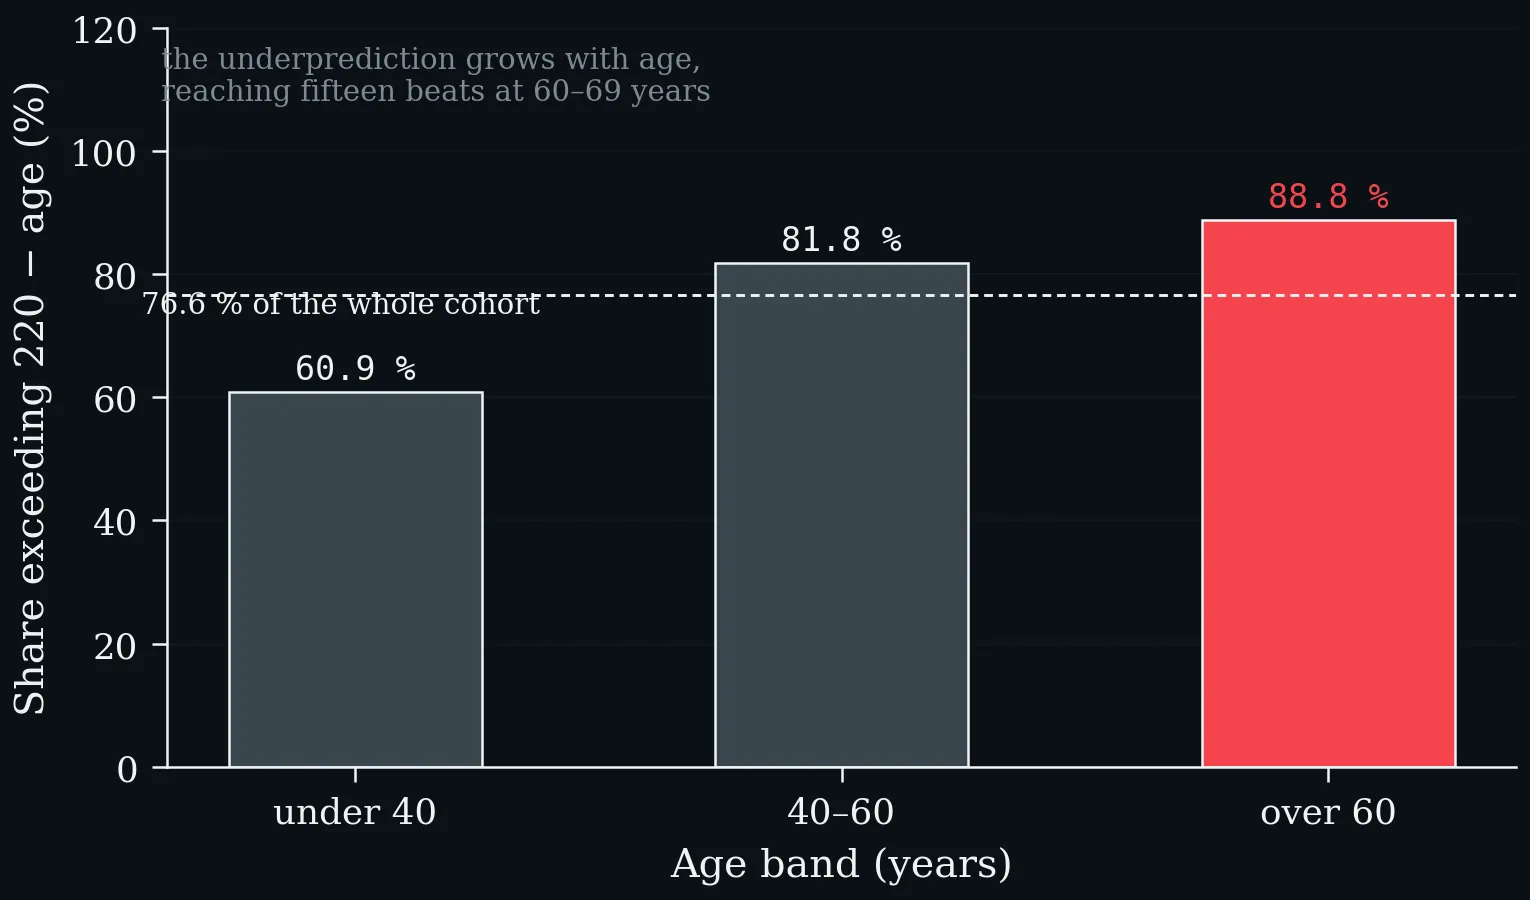
Share of HUNT participants whose measured maximum exceeded 220 − age, by age band (Nes et al. 2013). The underprediction grows with age, reaching fifteen beats at 60–69 years.
A test stopped at a target the person clears easily may never impose the workload that would reveal ischaemia — a false-negative mechanism that has nothing to do with the imaging or the ECG. And chronotropic incompetence, itself an independent predictor of mortality, is defined against predicted maximum too, so the same error contaminates the diagnosis in the other direction.
One-Minute-Paper Topics
A One-Minute-Paper (OMP) is a short, focused prompt that students answer in ~60 seconds at the end of a session to consolidate learning, surface misconceptions, and provide formative feedback. When answering, be concise, specific, and use terminology from today’s session.
- Compute predicted HRmax for a sixty-eight-year-old by all four equations in Table 10, and state the range within which you would expect 95% of sixty-eight-year-olds to fall.
- A stress test is terminated at 85% of 220 − age with no ischaemic changes and reported as negative. Explain the possible error and its direction.
- Why does a maximal field test give a defensible HRmax but not an interchangeable running speed?
- A student’s watch reports a “maximum heart rate” of 193 bpm recorded during a hard group run. Using Table 9, say what that number should be called and what would be needed to upgrade it.
- Gellish’s longitudinal design yields the same 0.7 beats per year as Tanaka’s cross-sectional meta-analysis. Why is that agreement informative, and which three confounders did the longitudinal design remove?
- HUNT’s SEE is 10.8 bpm and FRIEND’s within-decade SD reaches twenty-one beats in the oldest group. Explain what each statistic describes, and why a prescription written as “80% of predicted HRmax” inherits both.
- Adding activity, sex, smoking and BMI to the HUNT model changed explained variance by 0.007. Why is that a positive result for teaching, and what common coaching claim does it refute?
Key References
- Boettger S, Wetzig F, Puta C, Donath L, Müller H-J, Gabriel HHW, Bär K-J. Physical fitness and heart rate recovery are decreased in major depressive disorder. Psychosomatic Medicine 71 (5), 2009: 519–523.
- Buchheit M. The 30-15 Intermittent Fitness Test: accuracy for individualizing interval training of young intermittent sport players. Journal of Strength and Conditioning Research 22 (2), 2008: 365–374.
- Fox SM, Naughton JP, Haskell WL. Physical activity and the prevention of coronary heart disease. Annals of Clinical Research 3 (6), 1971: 404–432.
- Gellish RL, Goslin BR, Olson RE, McDonald A, Russi GD, Moudgil VK. Longitudinal modeling of the relationship between age and maximal heart rate. Medicine & Science in Sports & Exercise 39 (5), 2007: 822–829.
- Kaminsky LA, Arena R, Myers J. Reference standards for cardiorespiratory fitness measured with cardiopulmonary exercise testing: data from the Fitness Registry and the Importance of Exercise National Database. Mayo Clinic Proceedings 90 (11), 2015: 1515–1523.
- Nes BM, Janszky I, Wisløff U, Støylen A, Karlsen T. Age-predicted maximal heart rate in healthy subjects: The HUNT Fitness Study. Scandinavian Journal of Medicine & Science in Sports 23 (6), 2013: 697–704.
- Tanaka H, Monahan KD, Seals DR. Age-predicted maximal heart rate revisited. Journal of the American College of Cardiology 37 (1), 2001: 153–156.
5 Heart-Rate Recovery — The Minute After Exercise
Learning objectives:
- Heart-rate recovery as vagal reactivation, and why the abnormal cut-off belongs to the protocol
- The mortality association in referral cohorts and in the general population
- The threshold shape of the risk curve, in contrast to the linear gradient of resting heart rate
5.1 Definition and Physiology
Heart-rate recovery is the difference between heart rate at peak exercise and heart rate a fixed interval later — almost always one minute, sometimes two. One subtraction, from data every exercise test already produces. The first thirty seconds are dominated by vagal reactivation; sympathetic withdrawal takes over later. Recovery is fast in athletes, blunted in heart failure, and abolished by atropine, which is the evidence that the early fall is parasympathetic (Imai et al. 1994). §1 and §4 measured a level and a ceiling; this chapter measures a response.
5.2 The Protocol Owns the Cut-off
An active cool-down keeps venous return and metabolic demand up, so heart rate falls more slowly. Lying supine raises venous return and provokes a bradycardic response, so it falls faster. The autonomic system did not change; the posture did.
Two protocols, two thresholds, one conclusion — walking recovery (Cole et al. 1999) against immediate supine recovery (Watanabe et al. 2001).
| Cole 1999 | Watanabe 2001 | |
|---|---|---|
| Recovery period | 2 min walking (2.4 km/h, 2.5% grade) | Supine, immediately |
| Median HRR₁ | 17 bpm (IQR 12–23) | 30 bpm (IQR 22–37) |
| Abnormal below | 12 bpm | 18 bpm |
| Share flagged abnormal | 26% | 15% |
| Mortality, abnormal vs normal | 19% vs 5% | 9% vs 2% |
| Adjusted hazard | 2.0 (1.5–2.7) | 2.09 (1.49–2.82) |
Two protocols, two thresholds, one conclusion — walking recovery (Cole et al. 1999) against immediate supine recovery (Watanabe et al. 2001).
Both cut-offs were chosen by maximising a log-rank statistic in the same data, which overstates the association relative to an independent dataset — both papers say so (Cole et al. 1999; Watanabe et al. 2001). One minute or two makes little difference: the pooled analysis found no substantial change in the observed associations. The reporting gap is the more troubling finding. Of the nine cohorts pooled in that meta-analysis, none specified the recovery position and only one stated whether a cool-down was used (Qiu et al. 2017).
5.3 Cole 1999 — the Original Finding
2428 consecutive adults referred for exercise testing, mean age 57 ± 12, 63% men, six years of follow-up, 213 deaths — of whom 120, more than half, had an abnormal recovery. The unadjusted relative risk of death was 4.0 (3.0–5.2); after adjustment for age, sex, medications, perfusion defects, risk factors, resting heart rate, heart-rate rise and workload, 2.0 (1.5–2.7). It held in every prespecified subgroup (Cole et al. 1999).
And it is a poor test: sensitivity 56%, specificity 77%, positive predictive value 19%, negative predictive value 95%. At the stricter eight-beat cut-off, sensitivity falls to 33% and specificity rises to 90%. A risk marker, not a diagnostic — the same distinction as §1.5, in a different guise.
5.4 Watanabe 2001 — Replication under a Different Protocol
5438 consecutive patients referred for stress echocardiography, lying down immediately after peak so that the images could be taken. Its purpose was to test whether recovery still predicted once left-ventricular systolic function was accounted for. It did — and the two were additive: patients abnormal on both had markedly worse survival than either alone (Watanabe et al. 2001).
5.5 The General Population
Pooled hazard ratios from nine prospective general-population cohorts: 34 267 participants for cardiovascular events, 41 600 for mortality (Qiu et al. 2017).
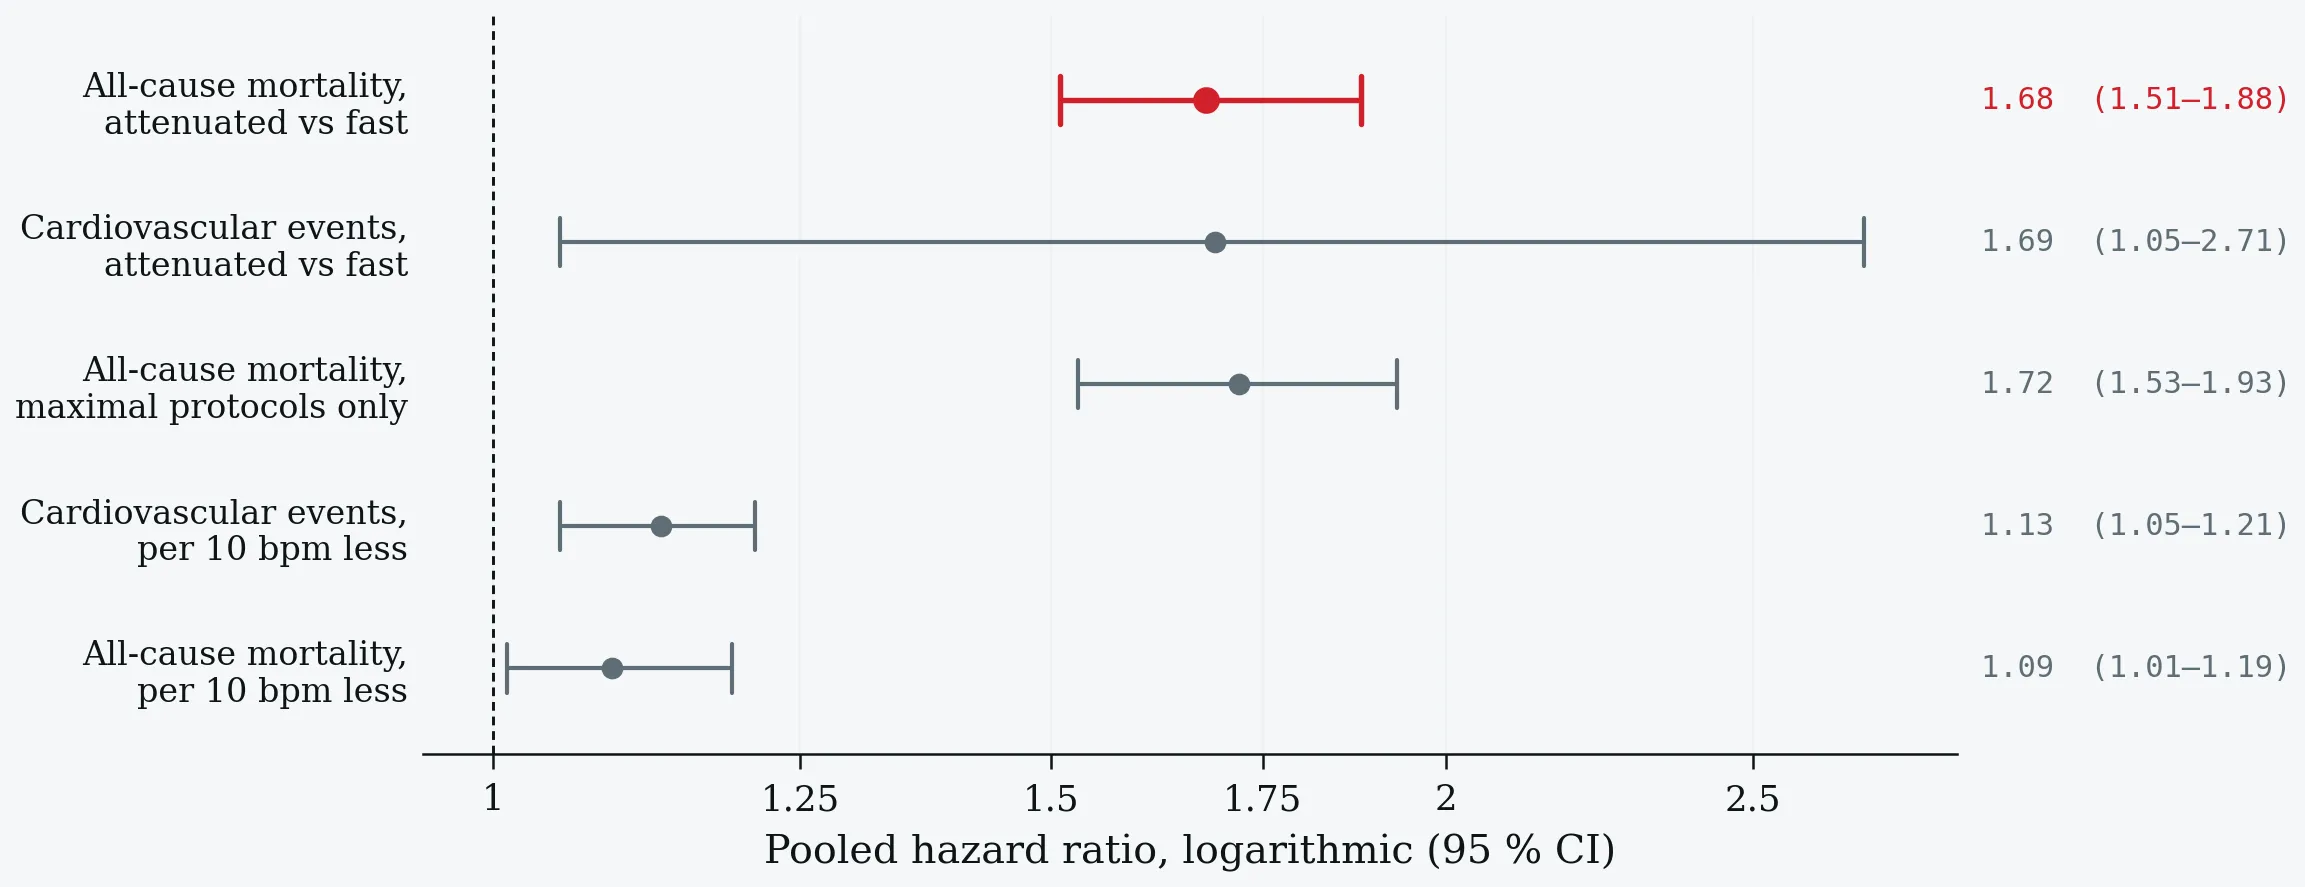
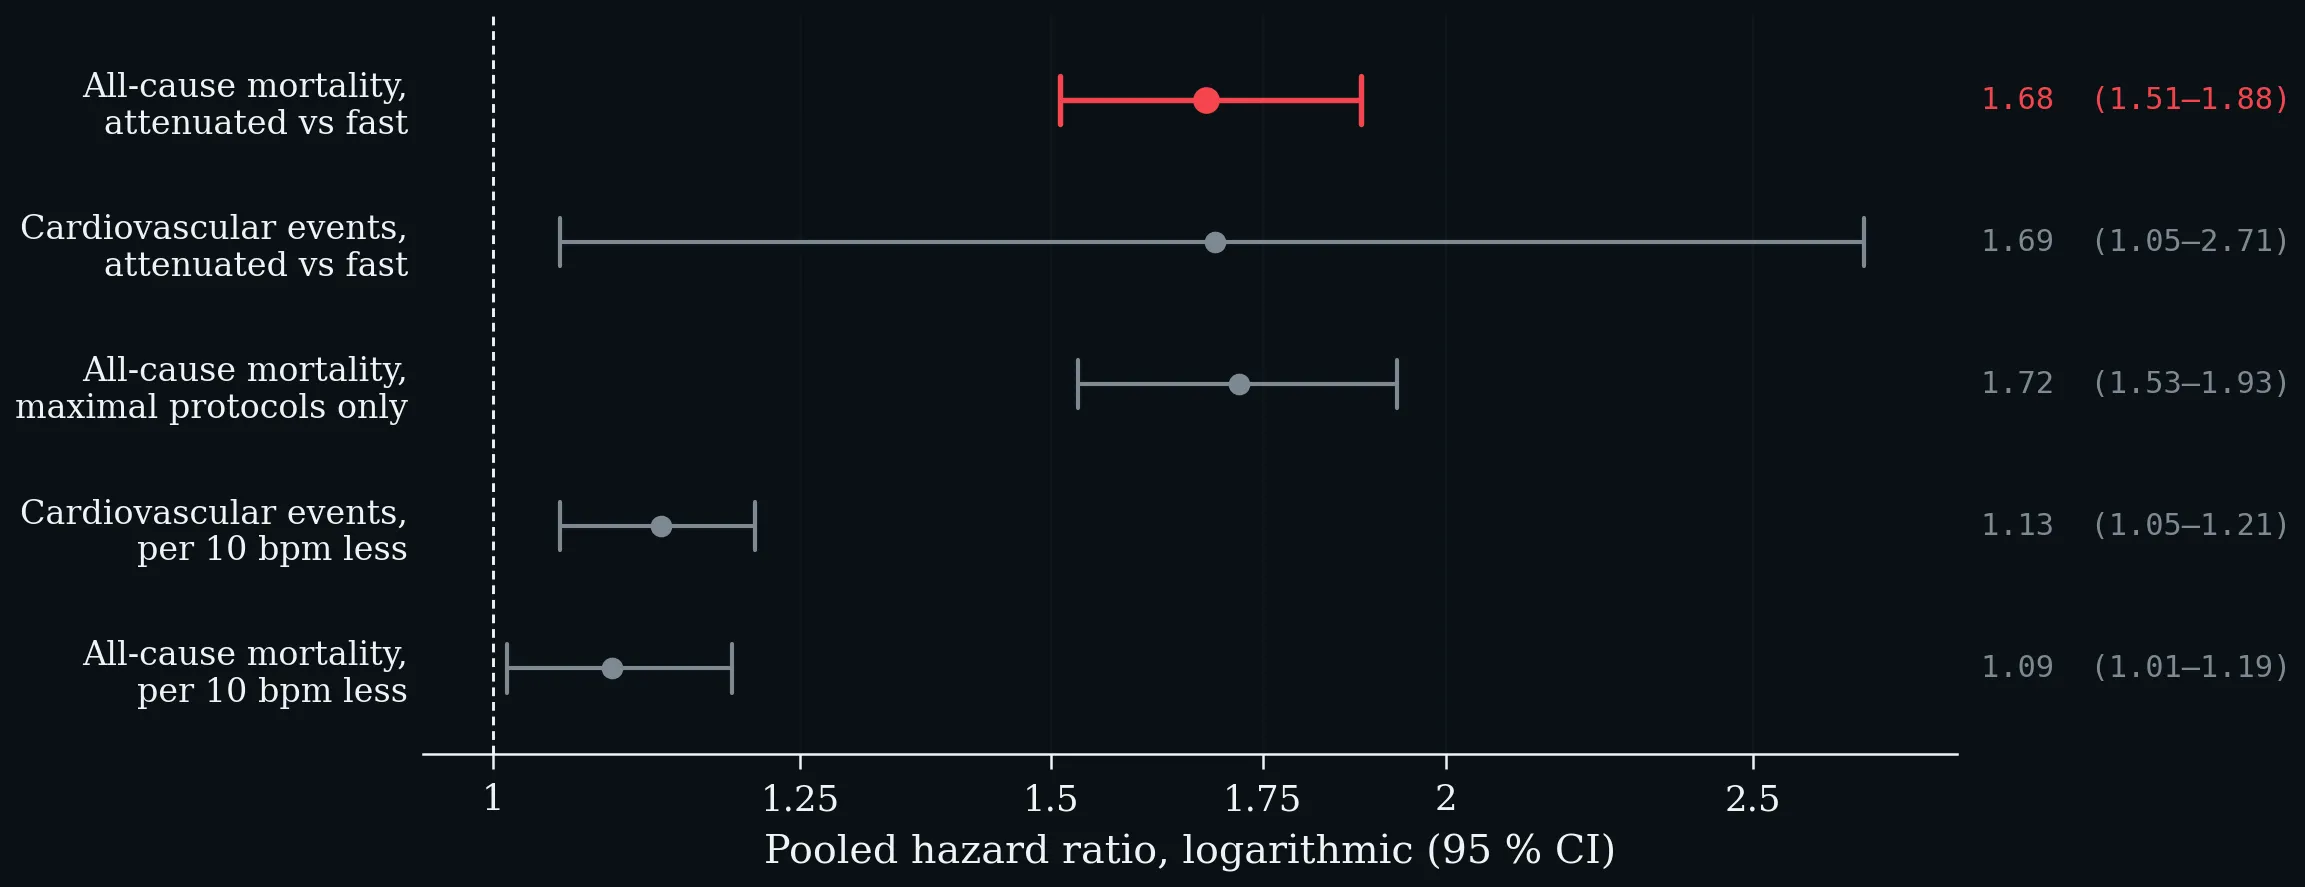
Pooled hazard ratios from nine prospective general-population cohorts: 34 267 participants for cardiovascular events, 41 600 for mortality (Qiu et al. 2017).
The associations held after adjustment for smoking, aerobic capacity and metabolic factors — obesity, diabetes, hypertension, dyslipidaemia. One methodological finding is worth carrying into practice: only studies using maximal exercise protocols yielded significant results for all-cause mortality. Heterogeneity was substantial for cardiovascular events and near zero for mortality (Qiu et al. 2017).
5.6 The Shape of the Risk — a Threshold, not a Gradient
Risk rises sharply below roughly ten to fifteen beats and flattens above fifteen to twenty. Schematic: the shape and the cut-points are as reported, not digitised.
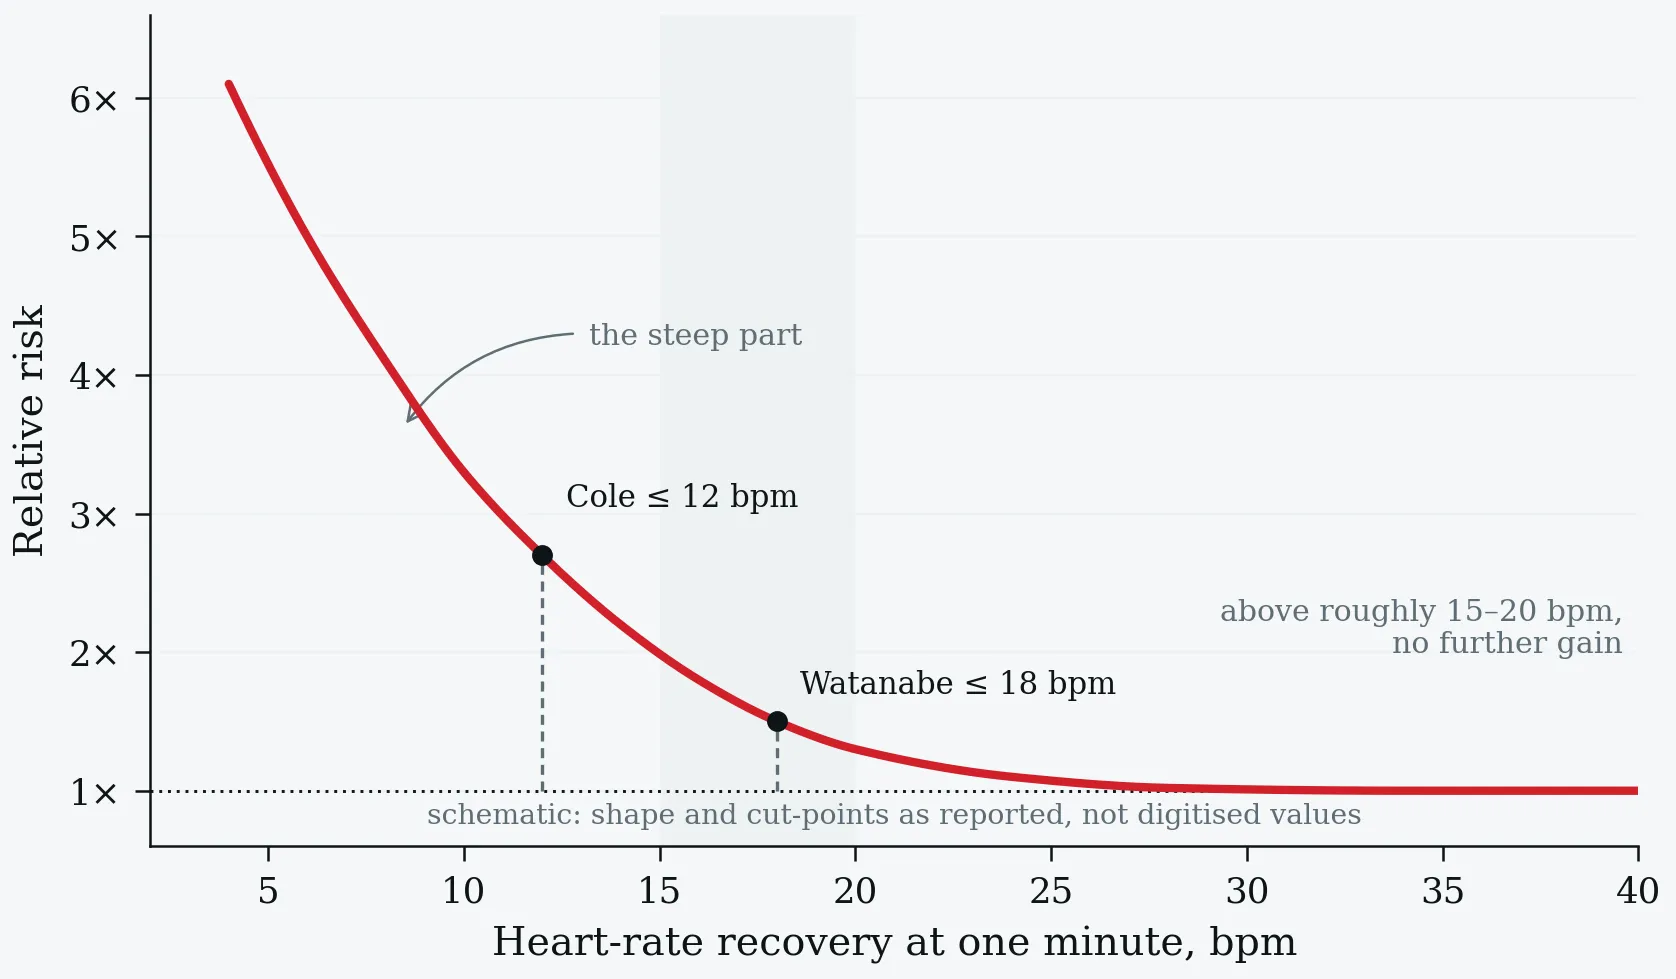
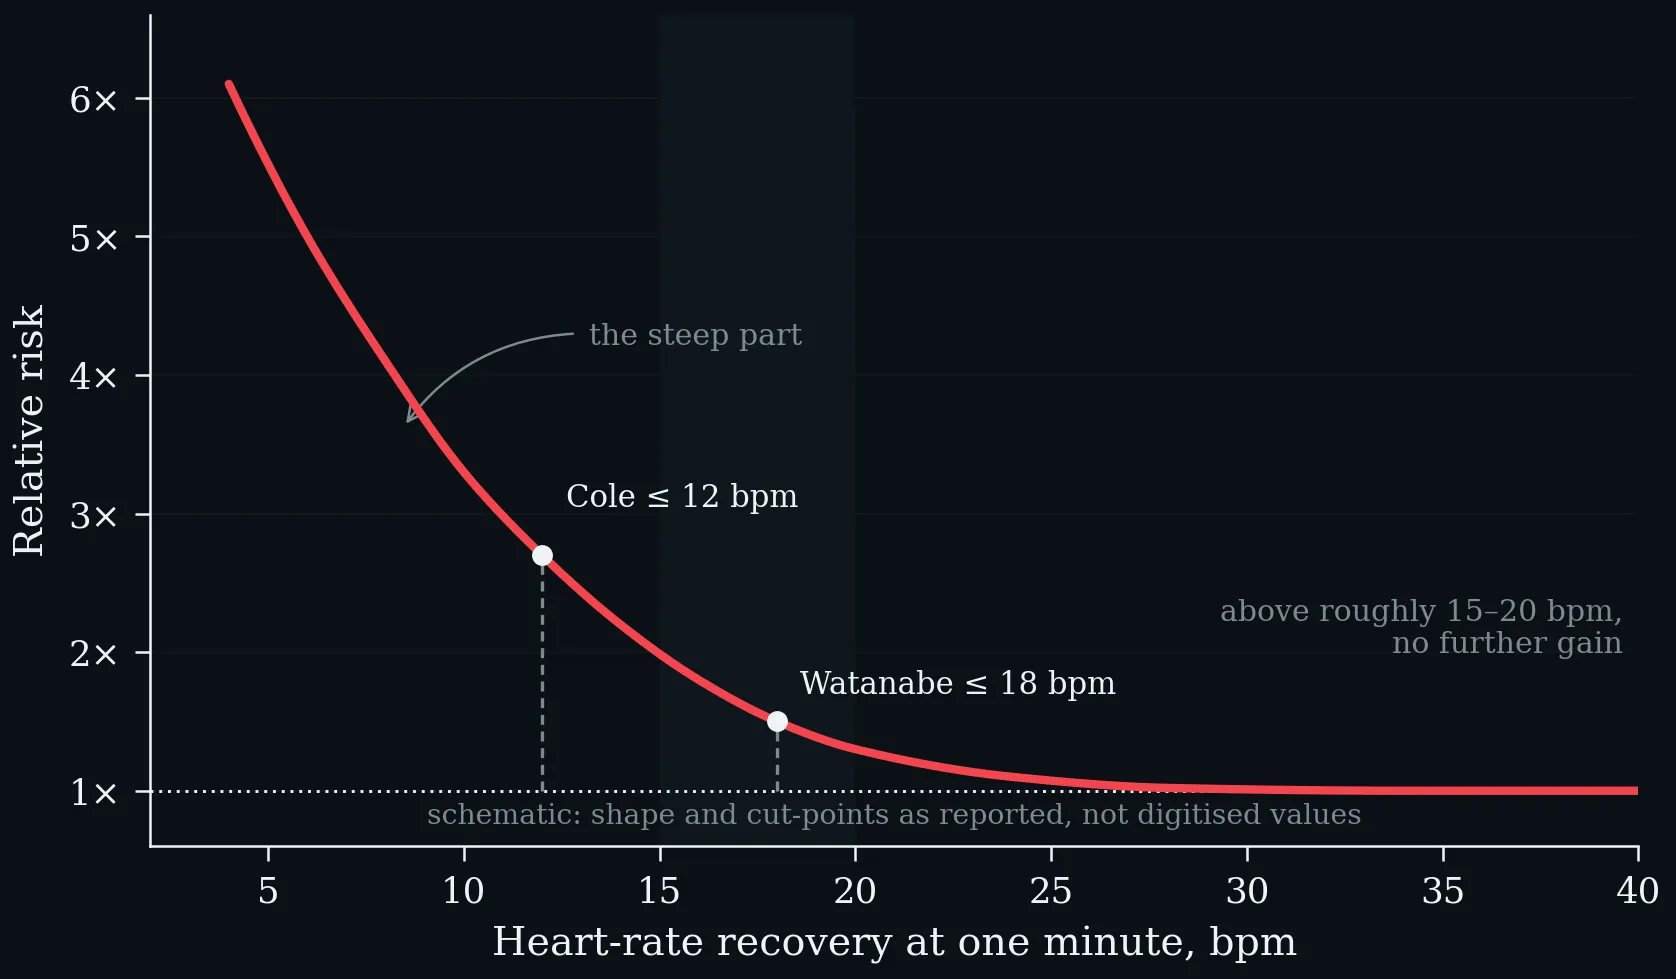
Risk rises sharply below roughly ten to fifteen beats and flattens above fifteen to twenty. Schematic: the shape and the cut-points are as reported, not digitised.
Contrast this with §1.2. Resting heart rate showed a linear gradient with no floor down to 45 bpm; recovery shows a threshold. Two heart-rate variables, two different risk geometries — and a practical consequence: a patient improving from eight to fourteen beats has moved through the steep part of the curve, while one improving from twenty-five to thirty-one has not moved through anything.
5.7 Fitness and Training
Among Cole’s patients with normal perfusion imaging, exercise capacity was 7.9 against 9.8 MET in men with abnormal versus normal recovery, and 6.0 against 7.4 MET in women (Cole et al. 1999). Yet the mortality association survived adjustment for exercise capacity in both referral cohorts and for aerobic capacity in the pooled analysis (Cole et al. 1999; Watanabe et al. 2001; Qiu et al. 2017) — the same pattern as resting heart rate in §1.3. In the field, recovery is a repeated measurement rather than a single number: the 30–15 Intermittent Fitness Test yields a recovery index from the fifteen-second pauses between runs, correlating with maximal running speed at r = 0.47, weaker than oxygen uptake (0.68) or countermovement jump (0.65) (Buchheit 2008).
5.8 Beyond Cardiology — Major Depressive Disorder
Twenty-two patients with major depressive disorder and twenty-two controls matched for sex, age, body mass index and weekly physical activity performed stepwise cycle ergometry to exhaustion with spirometry and lactate diagnostics. Heart-rate recovery was significantly reduced in the patients (p < 0.032), alongside lower individual anaerobic threshold (p < 0.001), peak oxygen uptake (p < 0.01) and peak workload (p < 0.003) (Boettger et al. 2009). Effort was comparable: maximum heart rate 176.2 ± 17.1 against 182.2 ± 12.6 bpm, lactate 8.6 ± 2.7 against 9.2 ± 2.2 mmol·L⁻¹, Borg 17.3 against 18.1. Because the groups were matched on physical activity, the fitness difference is not simply an activity difference, and the recovery deficit points at autonomic dysregulation as part of the disorder rather than a consequence of inactivity alone. A single exhaustive bout improved mood in the patients but not the controls, and the improvement correlated with peak lactate.
What it does not show: twenty-two patients, most on antidepressant medication, no prospective outcome. It establishes a difference, not a mechanism and not a prognosis — and the authors say exactly this.
5.9 Doing It Properly
- Reach a real maximum first. Recovery is measured from peak; a submaximal peak makes the subtraction meaningless.
- Fix the posture and the cool-down. This single choice moves the median from seventeen to thirty beats and the threshold from twelve to eighteen.
- Fix the interval and keep it. One minute is the convention and has the most evidence; switching mid-series destroys the comparison.
- Record what could blunt it. Beta-blockers, calcium-channel blockers, vasodilators.
- Use it as a change, not a label. Within a person, the direction of travel carries more than the absolute value.
- Say what you did. Peak, interval, posture, cool-down, medication.
5.10 Take Home — The Three Numbers Together
Resting heart rate is a state, maximal heart rate a structural ceiling that ages predictably and varies enormously between people, and recovery a response. They answer different questions and should not be traded for one another. Two of the three are routinely estimated when they could be measured — the maximum from a 1971 heuristic, the resting value from a proprietary wearable definition — and both estimates carry errors of about ten beats while being used as denominators. Recovery, meanwhile, is the cheapest autonomic measurement in medicine and is thrown away by most exercise tests that produce it.
Every one of these numbers is weak evidence about a person compared with a reference range, and strong evidence about a change in that person against themselves. Measure the ceiling when the decision depends on it, define the level before you compare it, and never discard the minute after exercise.
One-Minute-Paper Topics
A One-Minute-Paper (OMP) is a short, focused prompt that students answer in ~60 seconds at the end of a session to consolidate learning, surface misconceptions, and provide formative feedback. When answering, be concise, specific, and use terminology from today’s session.
- Cole’s median recovery was 17 bpm and Watanabe’s 30 bpm, in comparable referral populations. Explain the whole difference without invoking the autonomic nervous system.
- Why are the first thirty seconds the informative part of the curve? Name the evidence that the early fall is parasympathetic.
- A colleague reports “HRR 14 bpm — normal” for a patient who lay down immediately after peak. Evaluate that conclusion.
- Both Cole’s 12 bpm and Watanabe’s 18 bpm were chosen by maximising a log-rank statistic in the same data. What bias does that introduce, and what would an honest validation require?
- Resting heart rate shows a linear gradient with no floor; recovery shows a threshold. Using Figure 14, explain the clinical consequence for two patients improving by six beats from different starting points.
- In the depression study, groups were matched on weekly physical activity. Why was that design choice essential to the interpretation, and what does the study still not establish?
- Across the whole lecture: a fifty-year-old recreational athlete brings a wearable resting heart rate, a predicted HRmax and a recovery value from last week’s interval session. Rank the three numbers by how much you would trust them, and say which one you would measure properly first.
Key References
- Boettger S, Wetzig F, Puta C, Donath L, Müller H-J, Gabriel HHW, Bär K-J. Physical fitness and heart rate recovery are decreased in major depressive disorder. Psychosomatic Medicine 71 (5), 2009: 519–523.
- Buchheit M. The 30-15 Intermittent Fitness Test: accuracy for individualizing interval training of young intermittent sport players. Journal of Strength and Conditioning Research 22 (2), 2008: 365–374.
- Cole CR, Blackstone EH, Pashkow FJ, Snader CE, Lauer MS. Heart-rate recovery immediately after exercise as a predictor of mortality. New England Journal of Medicine 341 (18), 1999: 1351–1357.
- Imai K, Sato H, Hori M, et al. Vagally mediated heart rate recovery after exercise is accelerated in athletes but blunted in patients with chronic heart failure. Journal of the American College of Cardiology 24 (6), 1994: 1529–1535.
- Qiu S, Cai X, Sun Z, Li L, Zuegel M, Steinacker JM, Schumann U. Heart rate recovery and risk of cardiovascular events and all-cause mortality: a meta-analysis of prospective cohort studies. Journal of the American Heart Association 6 (5), 2017: e005505.
- Watanabe J, Thamilarasan M, Blackstone EH, Thomas JD, Lauer MS. Heart rate recovery immediately after treadmill exercise and left ventricular systolic dysfunction as predictors of mortality. Circulation 104 (16), 2001: 1911–1916.
References
- Aitken A, Sawyer A, Iwasaki A, Krumholz HM, Preston R, Calcraft P, Leeming H, Tosto-Mancuso J, Proal A, Osborne MA, Putrino D. Digital physiological biomarkers predict within-person symptom changes in complex chronic illness. npj Digital Medicine 9, 2026: 257.
- Aune D, Sen A, ó’Hartaigh B, Janszky I, Romundstad PR, Tonstad S, Vatten LJ. Resting heart rate and the risk of cardiovascular disease, total cancer, and all-cause mortality. Nutrition, Metabolism and Cardiovascular Diseases 27 (6), 2017: 504–517.
- Bent B, Goldstein BA, Kibbe WA, Dunn JP. Investigating sources of inaccuracy in wearable optical heart rate sensors. npj Digital Medicine 3, 2020: 18.
- Boettger S, Wetzig F, Puta C, Donath L, Müller H-J, Gabriel HHW, Bär K-J. Physical fitness and heart rate recovery are decreased in major depressive disorder. Psychosomatic Medicine 71 (5), 2009: 519–523.
- Borhani S, Silva I, Damiano RJ, et al. Automatic detection of persistent physiological changes after COVID infection via wearable devices. Scientific Reports 15, 2025: 29443.
- Buchheit M. The 30-15 Intermittent Fitness Test: accuracy for individualizing interval training of young intermittent sport players. Journal of Strength and Conditioning Research 22 (2), 2008: 365–374.
- Buchheit M. Monitoring training status with HR measures: do all roads lead to Rome? Frontiers in Physiology 5, 2014: 73.
- Cole CR, Blackstone EH, Pashkow FJ, Snader CE, Lauer MS. Heart-rate recovery immediately after exercise as a predictor of mortality. New England Journal of Medicine 341 (18), 1999: 1351–1357.
- Colvonen PJ. Response to: Investigating sources of inaccuracy in wearable optical heart rate sensors. npj Digital Medicine 4, 2021: 38.
- Custodis F, Schirmer SH, Baumhäkel M, Heusch G, Böhm M, Laufs U. Vascular pathophysiology in response to increased heart rate. Journal of the American College of Cardiology 56 (24), 2010: 1973–1983.
- Dial MB, Hollander ME, Vatne EA, Emerson AM, Edwards NA, Hagen JA. Validation of nocturnal resting heart rate and heart rate variability in consumer wearables. Physiological Reports 13 (16), 2025a: e70527.
- Eppinga RN, Hagemeijer Y, Burgess S, et al. Identification of genomic loci associated with resting heart rate and shared genetic predictors with all-cause mortality. Nature Genetics 48 (12), 2016: 1557–1563.
- Fox K, Ford I, Steg PG, Tendera M, Ferrari R; BEAUTIFUL Investigators. Ivabradine for patients with stable coronary artery disease and left-ventricular systolic dysfunction. The Lancet 372 (9641), 2008: 807–816.
- Fox K, Ford I, Steg PG, Tardif JC, Tendera M, Ferrari R; SIGNIFY Investigators. Ivabradine in stable coronary artery disease without clinical heart failure. New England Journal of Medicine 371 (12), 2014: 1091–1099.
- Fox SM, Naughton JP, Haskell WL. Physical activity and the prevention of coronary heart disease. Annals of Clinical Research 3 (6), 1971: 404–432.
- Gellish RL, Goslin BR, Olson RE, McDonald A, Russi GD, Moudgil VK. Longitudinal modeling of the relationship between age and maximal heart rate. Medicine & Science in Sports & Exercise 39 (5), 2007: 822–829.
- Gonzales TI, et al. Resting heart rate is a population-level biomarker of cardiorespiratory fitness: the Fenland Study. PLoS ONE 18 (5), 2023: e0285272.
- Grosicki GJ, Robinson AT, Joyner MJ, et al. Real-world effects of alcohol on heart rate, sleep, and physical activity by age and sex. PLOS Digital Health 5 (3), 2026: e0001284.
- Heusch G. Heart rate in the pathophysiology of coronary blood flow and myocardial ischaemia. British Journal of Pharmacology 153 (8), 2008: 1589–1601.
- Ho JE, Larson MG, Ghorbani A, Cheng S, Coglianese EE, Vasan RS, Wang TJ. Long-term cardiovascular risks associated with an elevated heart rate: the Framingham Heart Study. Journal of the American Heart Association 3 (3), 2014: e000668.
- Imai K, Sato H, Hori M, et al. Vagally mediated heart rate recovery after exercise is accelerated in athletes but blunted in patients with chronic heart failure. Journal of the American College of Cardiology 24 (6), 1994: 1529–1535.
- Jensen MT, Suadicani P, Hein HO, Gyntelberg F. Elevated resting heart rate, physical fitness and all-cause mortality: a 16-year follow-up in the Copenhagen Male Study. Heart 99 (12), 2013: 882–887.
- Kaminsky LA, Arena R, Myers J. Reference standards for cardiorespiratory fitness measured with cardiopulmonary exercise testing: data from the Fitness Registry and the Importance of Exercise National Database. Mayo Clinic Proceedings 90 (11), 2015: 1515–1523.
- Lambe R, Baldwin M, O’Grady B, Schumann M, Caulfield B, Doherty C. The accuracy of Apple Watch measurements: a living systematic review and meta-analysis. npj Digital Medicine 9, 2026: 63.
- Ledebur K, Wiedermann M, Puta C, Thurner S, Klimek P, Brockmann D. Wearable data reveals distinct characteristics of individuals with persistent symptoms after a SARS-CoV-2 infection. npj Digital Medicine 8, 2025: 167.
- Levine HJ. Rest heart rate and life expectancy. Journal of the American College of Cardiology 30 (4), 1997: 1104–1106.
- McAlister FA, Wiebe N, Ezekowitz JA, Leung AA, Armstrong PW. Meta-analysis: beta-blocker dose, heart rate reduction, and death in patients with heart failure. Annals of Internal Medicine 150 (11), 2009: 784–794.
- Mishra T, Wang M, Metwally AA, et al. Pre-symptomatic detection of COVID-19 from smartwatch data. Nature Biomedical Engineering 4 (12), 2020: 1208–1220.
- Nelson BW, Low CA, Jacobson N, Areán P, Torous J, Allen NB. Guidelines for wrist-worn consumer wearable assessment of heart rate in biobehavioral research. npj Digital Medicine 3, 2020: 90.
- Nes BM, Janszky I, Wisløff U, Støylen A, Karlsen T. Age-predicted maximal heart rate in healthy subjects: The HUNT Fitness Study. Scandinavian Journal of Medicine & Science in Sports 23 (6), 2013: 697–704.
- Qiu S, Cai X, Sun Z, Li L, Zuegel M, Steinacker JM, Schumann U. Heart rate recovery and risk of cardiovascular events and all-cause mortality: a meta-analysis of prospective cohort studies. Journal of the American Heart Association 6 (5), 2017: e005505.
- Quer G, Gouda P, Galarnyk M, Topol EJ, Steinhubl SR. Inter- and intraindividual variability in daily resting heart rate. PLOS ONE 15 (2), 2020: e0227709.
- Quer G, Radin JM, Gadaleta M, et al. Wearable sensor data and self-reported symptoms for COVID-19 detection. Nature Medicine 27 (1), 2021: 73–77.
- Radin JM, Wineinger NE, Topol EJ, Steinhubl SR. Harnessing wearable device data to improve state-level real-time surveillance of influenza-like illness in the USA. The Lancet Digital Health 2 (2), 2020: e85–e93.
- Radin JM, Quer G, Ramos E, et al. Assessment of prolonged physiological and behavioral changes associated with COVID-19 infection. JAMA Network Open 4 (7), 2021: e2115959.
- Reimers AK, Knapp G, Reimers CD. Effects of exercise on the resting heart rate: a systematic review and meta-analysis of interventional studies. Journal of Clinical Medicine 7 (12), 2018: 503.
- Sajadieh A, Nielsen OW, Rasmussen V, Hein HO, Abedini S, Hansen JF. Increased heart rate and reduced heart-rate variability are associated with subclinical inflammation. European Heart Journal 25 (5), 2004: 363–370.
- Shilaih M, de Clerck V, Falco L, Kübler F, Leeners B. Pulse rate measurement during sleep using wearable sensors, and its correlation with the menstrual cycle phases. Scientific Reports 7, 2017: 1294.
- Speed C, Arneil T, Harle R, Wilson A, Karthikesalingam A, McConnell M, Phillips J. Measure by measure: resting heart rate across the 24-hour cycle. PLOS Digital Health 2 (4), 2023: e0000236.
- Swedberg K, Komajda M, Böhm M, et al.; SHIFT Investigators. Ivabradine and outcomes in chronic heart failure (SHIFT): a randomised placebo-controlled study. The Lancet 376 (9744), 2010: 875–885.
- Tanaka H, Monahan KD, Seals DR. Age-predicted maximal heart rate revisited. Journal of the American College of Cardiology 37 (1), 2001: 153–156.
- Watanabe J, Thamilarasan M, Blackstone EH, Thomas JD, Lauer MS. Heart rate recovery immediately after treadmill exercise and left ventricular systolic dysfunction as predictors of mortality. Circulation 104 (16), 2001: 1911–1916.
- Zhang D, Shen X, Qi X. Resting heart rate and all-cause and cardiovascular mortality in the general population: a meta-analysis. CMAJ 188 (3), 2016: E53–E63.