Cardiorespiratory Fitness measured in metabolic equivalent task
Table of Contents
- How Fitness Is Measured — and the Conflation Problem
- The Evidence — Cardiorespiratory Fitness and Mortality
- The VO₂ Max Verdict and Practical Recommendations
1 How Fitness Is Measured — and the Conflation Problem
Learning objectives:
- The conflation of VO₂ max with cardiorespiratory fitness (CRF), and why it matters clinically
- CRF: definition, graded-exercise/MET measurement, and its status as a clinical vital sign
- Direct laboratory VO₂ max versus wearable estimation, and the accuracy gap between them
1.1 Introduction and Clinical Context
Clinical takeaway. Cardiorespiratory fitness (CRF), measured in metabolic equivalents of task (METs) on a treadmill or bicycle ergometer, is the evidence-based metric underpinning more than 99 % of the outcome literature linking physical fitness to all-cause and cardiovascular mortality. VO₂ max — especially as estimated by consumer wearables — is poorly validated, frequently inaccurate, and conflated with CRF in popular health narratives. METs are free, universally accessible, and clinically superior for most healthy adults.
Wearable fitness devices increasingly report VO₂ max values to consumers, prompting anxiety and clinical inquiries when those values decline. Topol (2026) describes two recent patients who contacted him concerned about a falling VO₂ max displayed by their smartwatches — a scenario that illustrates a far broader problem: the widespread conflation of VO₂ max (maximal oxygen uptake) with cardiorespiratory fitness (CRF), two related but methodologically and evidentially distinct constructs.
This lecture distils that critical analysis into an evidence-based framework covering: (1) how each metric is defined and measured; (2) the strength and size of the supporting outcome datasets; (3) the origin and consequences of conflation in popular media; and (4) practical recommendations grounded in peer-reviewed evidence. The figures throughout are reconstructed from published data; they are not reproductions of the original article graphics.
1.2 Cardiorespiratory Fitness (CRF)
CRF reflects the integrated capacity of the cardiovascular, pulmonary, and musculoskeletal systems to sustain aerobic exercise (Ross et al. 2016). It is assessed via graded exercise testing and expressed as metabolic equivalents of task (METs), where 1 MET equals the resting metabolic rate. CRF can be assessed on any treadmill or ergometer without a specialist, whereas VO₂ max requires a calibrated metabolic cart, an exhaled-gas mask, and trained staff. The MET intensity bands and the heart-rate estimate MET ≈ 0.05 × HR_bpm + 2 are treated in Lecture 3, §2.8.
The American Heart Association classifies CRF as a clinical vital sign (Ross et al. 2016).
1.3 VO₂ Max — Direct Laboratory Measurement
Maximal oxygen uptake (VO₂ max) is the ceiling of aerobic power, determined via direct gas exchange during a ramp-protocol exercise test to volitional exhaustion (Topol 2026). Requirements: calibrated metabolic cart, tight mask, and trained exercise physiologist. Cost: ~$150 per test. Result expressed in mL O₂ · kg⁻¹ · min⁻¹. These requirements make routine clinical screening impractical.
1.4 VO₂ Max — Wearable Estimation
Consumer smartwatches impute VO₂ max from population-based algorithms (heart rate + GPS/accelerometry), not gas exchange (Tedesco et al. 2025). Accuracy is poor: mean absolute percentage error (MAPE) is typically 7–16 %.
Because wearables estimate rather than measure VO₂ max, their values carry directional biases and extrinsic confounders that make them unreliable for clinical or lifestyle decisions.
One-Minute-Paper Topics
A One-Minute-Paper (OMP) is a short, focused prompt that students answer in ~60 seconds at the end of a session to consolidate learning, surface misconceptions, and provide formative feedback. When answering, be concise, specific, and use terminology from today’s session.
- The lecture’s core argument is that METs-based CRF — not VO₂max — is the evidence-based metric for linking fitness to mortality outcomes. Summarise this argument in three sentences suitable for a patient consultation.
- Define CRF in terms of the integrated capacity it reflects. How is it measured clinically, how is it expressed, and why does the American Heart Association classify it as a “clinical vital sign”?
- What equipment, personnel, and procedural conditions are needed for a valid direct VO₂max measurement? Why do these requirements make routine clinical screening impractical?
- Consumer smartwatches estimate VO₂max from HR and GPS/accelerometry rather than direct gas exchange. What is MAPE (mean absolute percentage error), and what is the typical MAPE range for wearable VO₂max estimates (7–16%)? What are the clinical consequences of this inaccuracy?
- Using the formula MET ≈ 0.05 × HR_bpm + 2, estimate the MET value for a heart rate of 120 bpm and 160 bpm. To which intensity categories (light, moderate, vigorous) do these values correspond?
- Outline three specific reasons why consumer-wearable VO₂max estimates should not be used for clinical or lifestyle decision-making. Relate your answer to both technical and epistemological limitations.
- The American Heart Association proposed CRF as a clinical vital sign. What are the implications for routine care? Should every GP appointment include a fitness assessment, and how could this be implemented practically?
Key References
- Ross R, Blair SN, Arena R, et al. Importance of assessing cardiorespiratory fitness in clinical practice: a case for fitness as a clinical vital sign — a scientific statement from the American Heart Association. Circulation 134 (24), 2016: e653–e699.
- Tedesco S, Sica M, Ancillao A, et al. Accuracy of consumer-grade wearables for VO₂ max estimation: a systematic review. Electronics 14 (15), 2025: 3081.
- Topol E. The flawed VO₂ max craze: conflation with cardiorespiratory fitness. Ground Truths (Substack), 23 February 2026.
2 The Evidence — Cardiorespiratory Fitness and Mortality
Learning objectives:
- The Kodama (2009) meta-analysis: each 1-MET increment and mortality risk
- The Cleveland Clinic cohort: the 1.41 hazard ratio, the >5-fold gradient, and the sex difference
- The Veterans Affairs cohort and the graded, no-ceiling dose–response between fitness and survival
2.1 Meta-Analysis: 33 Studies, 102,980 Participants (JAMA 2009)
Cardiorespiratory fitness and mortality risk. Each 1-MET increment in exercise capacity is associated with a 14–15 % reduction in all-cause mortality, plotted here relative to the 7.9-MET reference. Shaded band = 95 % CI. Meta-analysis of 33 studies (n = 102,980; Kodama et al. 2009).
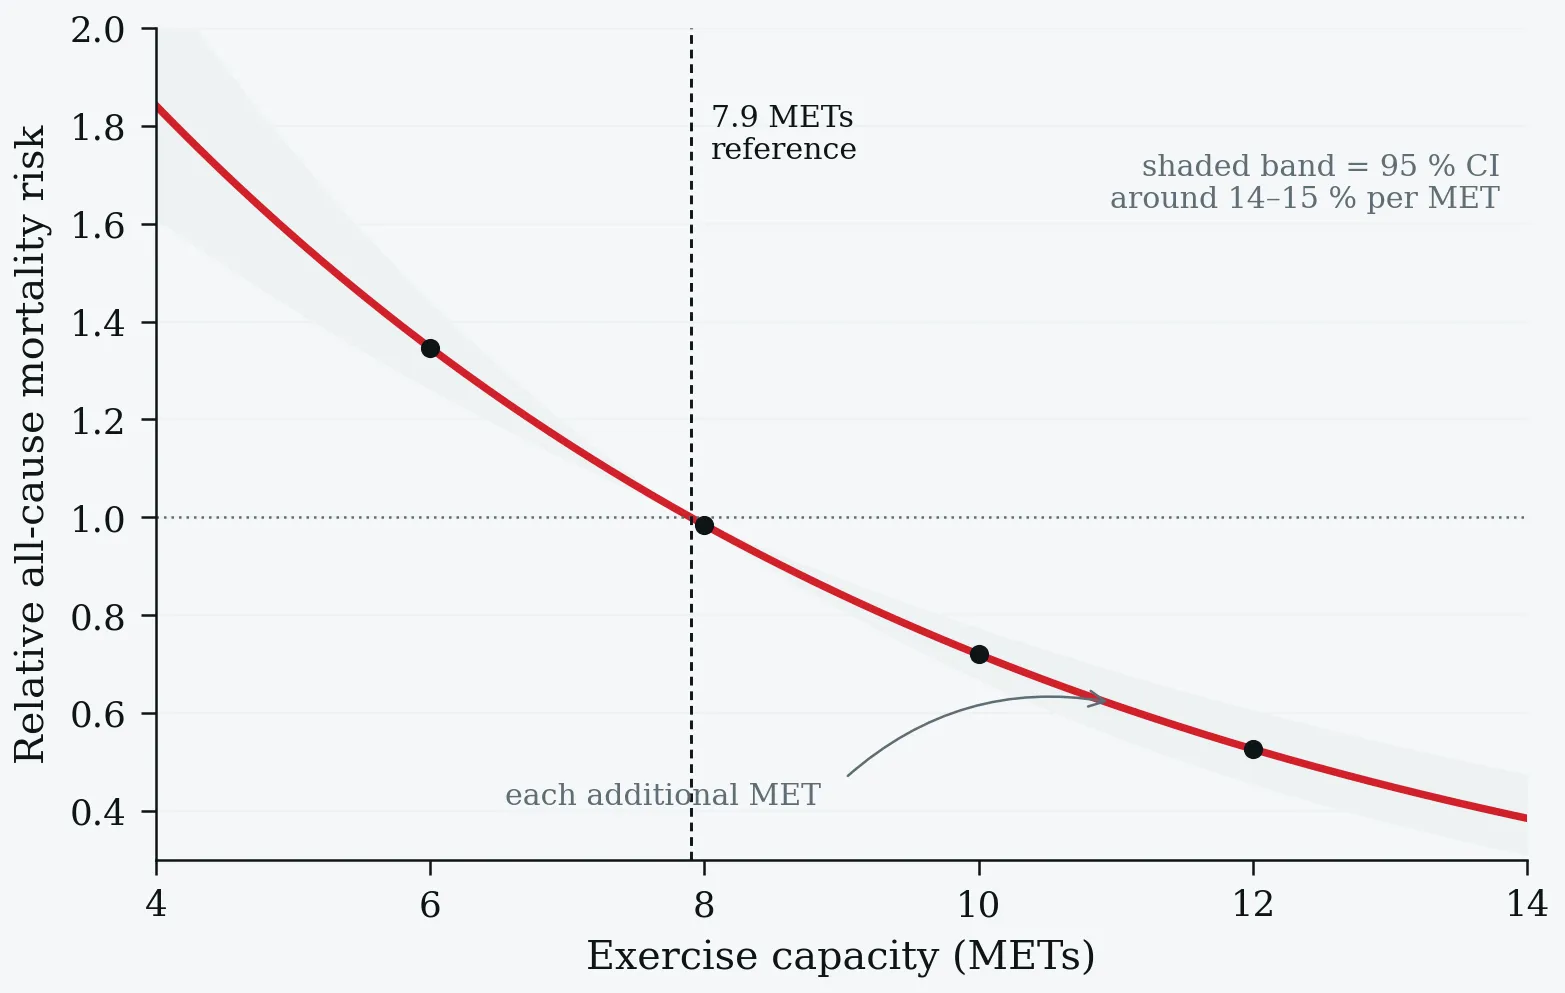
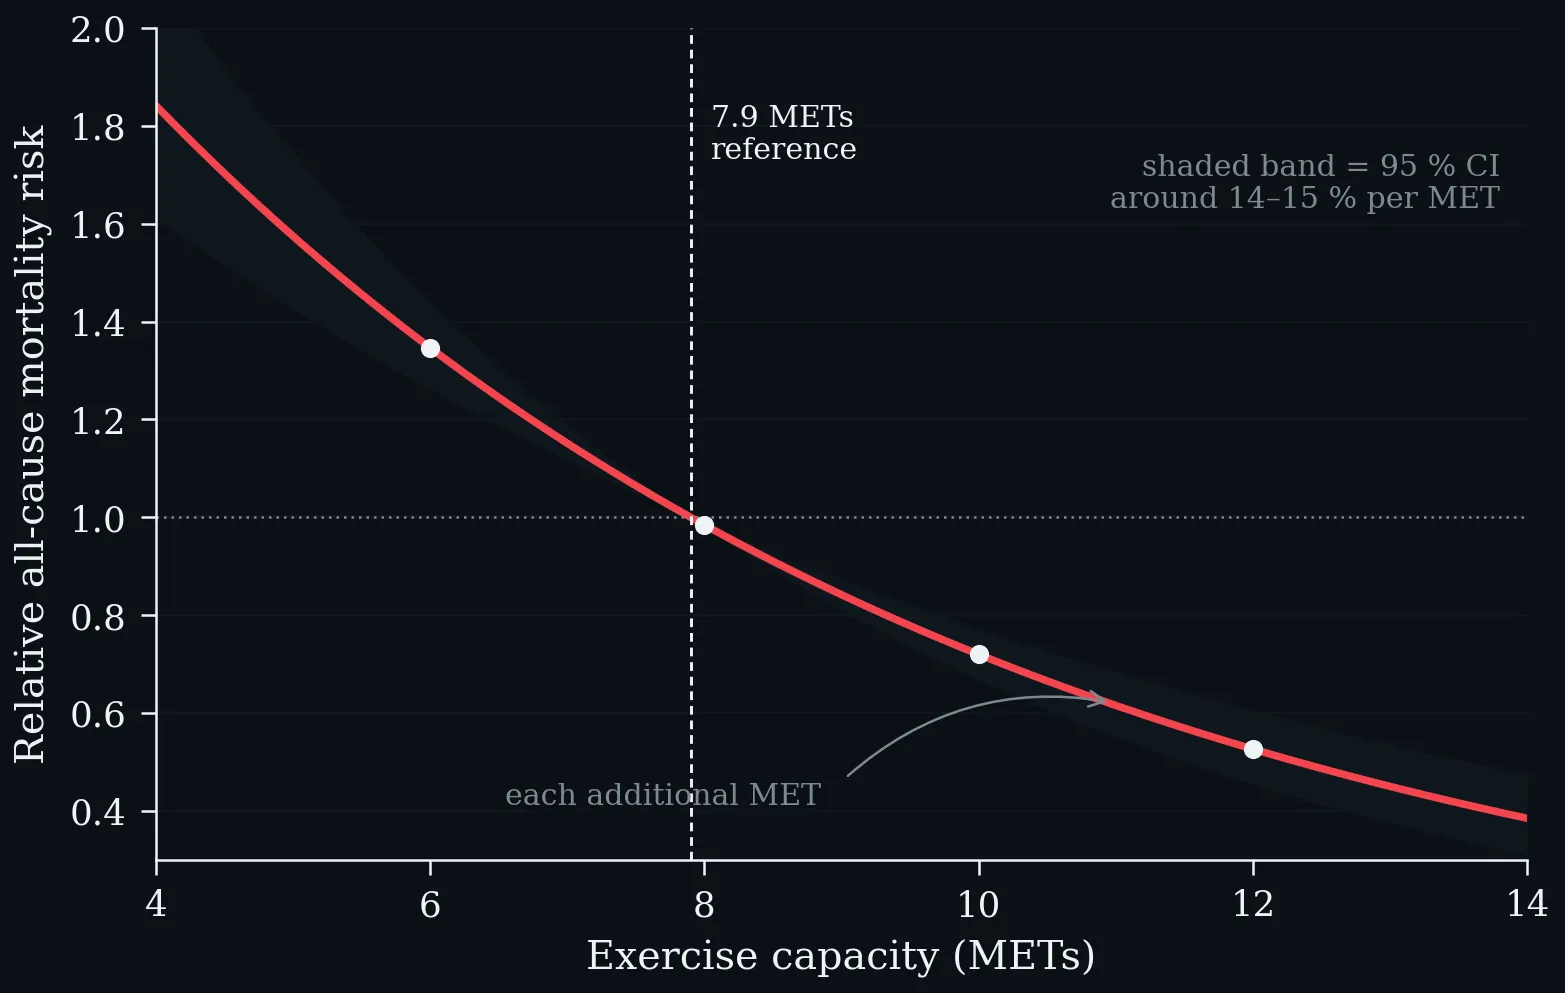
Cardiorespiratory fitness and mortality risk. Each 1-MET increment in exercise capacity is associated with a 14–15 % reduction in all-cause mortality, plotted here relative to the 7.9-MET reference. Shaded band = 95 % CI. Meta-analysis of 33 studies (n = 102,980; Kodama et al. 2009).
The landmark meta-analysis by Kodama et al. (2009) established METs as a potent and graded prognostic variable for all-cause and cardiovascular mortality.
2.2 Cleveland Clinic Cohort: 122,007 Patients (JAMA Network Open 2018)
Cleveland Clinic Key Results
- Five MET strata: Low, Below-Average, Above-Average, High, Elite.
- HR (above-average vs. below-average): 1.41 — equivalent to smoking or diabetes.
- HR (Low vs. Elite): >5-fold.
- Protective effect more pronounced in women at every stratum.
- No ceiling mortality risk even at elite fitness.
2.3 Veterans Affairs Cohort: 750,000+ Veterans (Kokkinos et al. 2022)
All-cause mortality hazard ratios by fitness category on a common logarithmic axis. Left: Cleveland Clinic cohort (n = 122,007); the above-average vs. below-average hazard ratio of 1.41 equates to the excess mortality risk of smoking or diabetes, and the Low-to-Elite gradient exceeds 5-fold (Mandsager et al. 2018). Right: US Veterans Affairs cohort (n = 750,302; mean follow-up 10.2 years) with a ≈4-fold Very-Low to Very-High gradient and no ceiling risk at the top; error bars = 95 % CI (Kokkinos et al. 2022).
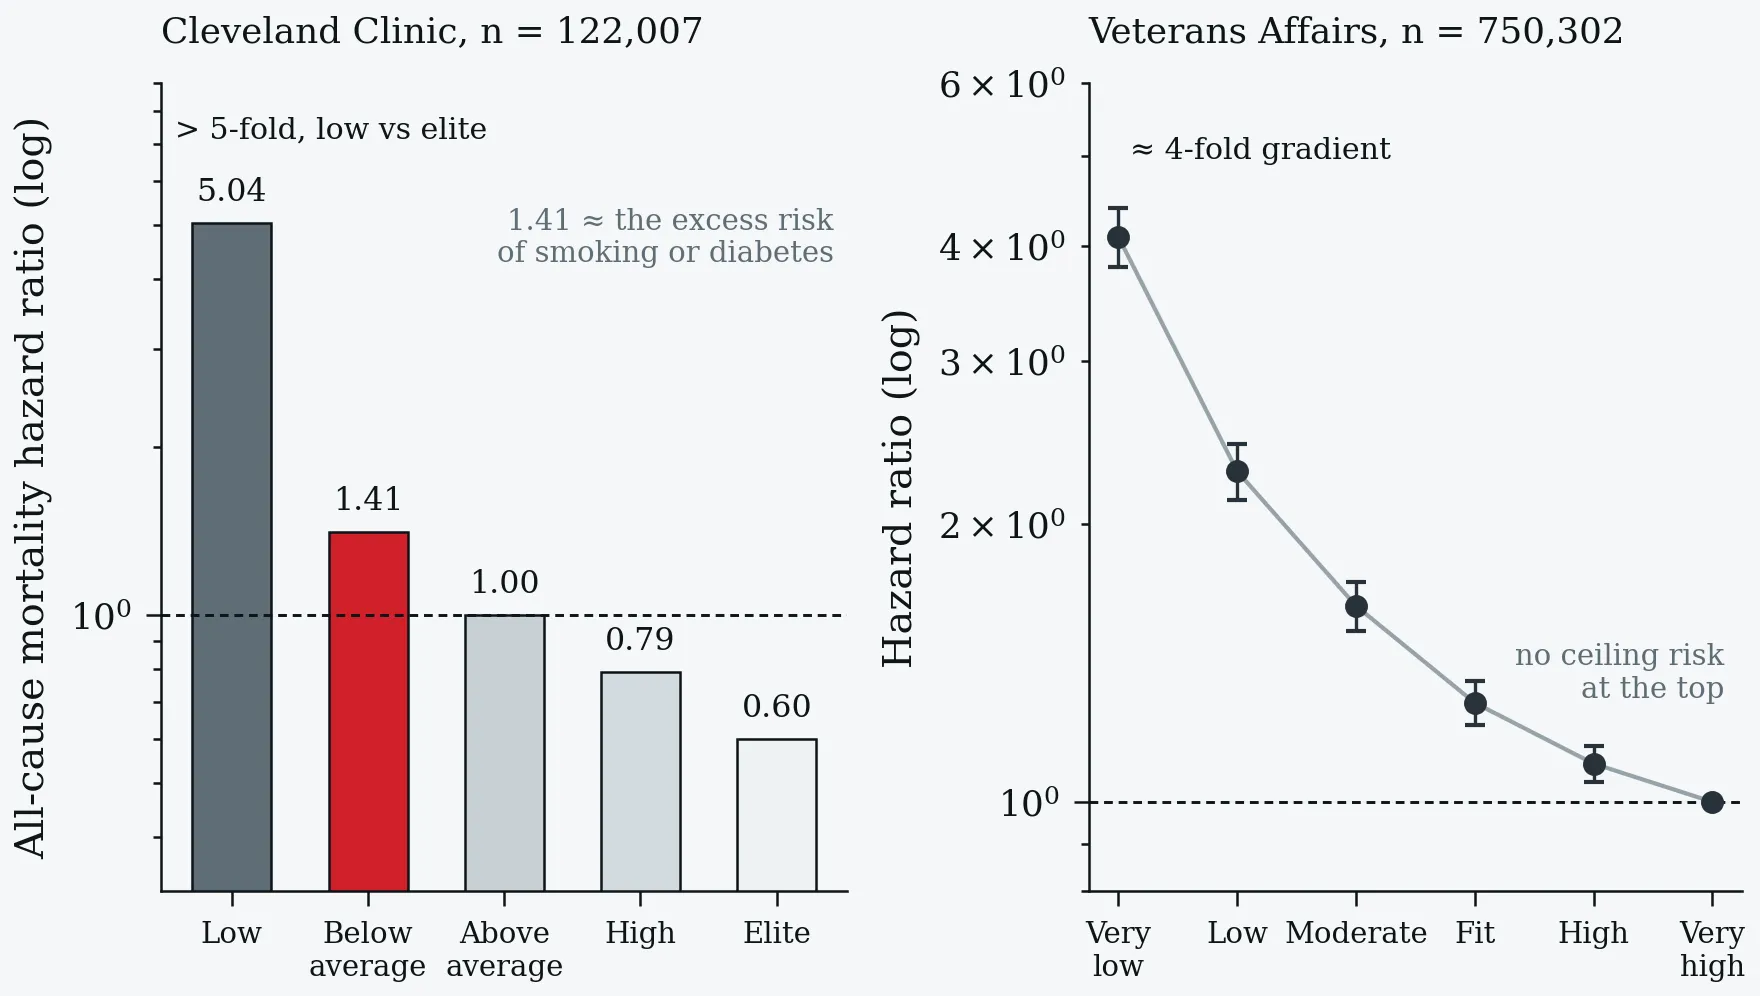
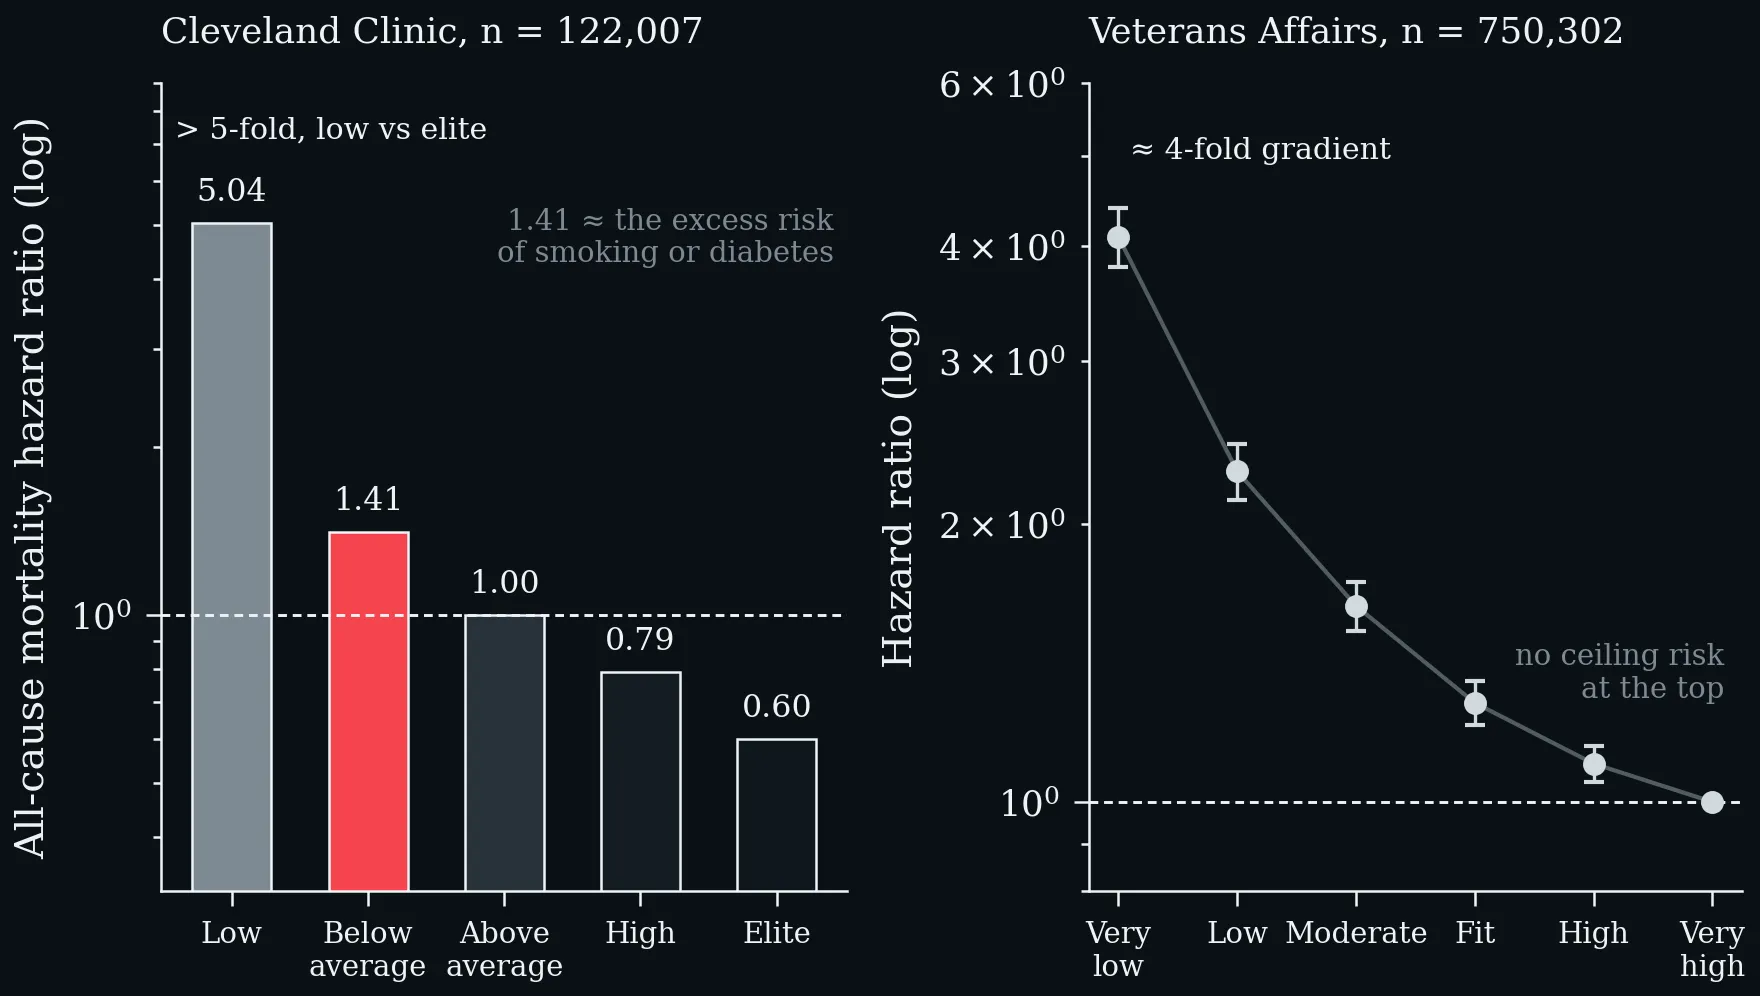
All-cause mortality hazard ratios by fitness category on a common logarithmic axis. Left: Cleveland Clinic cohort (n = 122,007); the above-average vs. below-average hazard ratio of 1.41 equates to the excess mortality risk of smoking or diabetes, and the Low-to-Elite gradient exceeds 5-fold (Mandsager et al. 2018). Right: US Veterans Affairs cohort (n = 750,302; mean follow-up 10.2 years) with a ≈4-fold Very-Low to Very-High gradient and no ceiling risk at the top; error bars = 95 % CI (Kokkinos et al. 2022).
Across all three datasets, the fitness–survival relationship is graded and continuous with no ceiling: higher CRF is associated with lower mortality at every level, and the largest absolute gains accrue at the low-fitness end of the spectrum.
One-Minute-Paper Topics
A One-Minute-Paper (OMP) is a short, focused prompt that students answer in ~60 seconds at the end of a session to consolidate learning, surface misconceptions, and provide formative feedback. When answering, be concise, specific, and use terminology from today’s session.
- The Kodama et al. meta-analysis (n = 102,980) established a graded inverse relationship between CRF and mortality. State the key quantitative finding: what does each 1-MET increment in exercise capacity correspond to in terms of mortality risk reduction?
- The Cleveland Clinic study (n = 122,007) found a hazard ratio of 1.41 for all-cause mortality when comparing above-average vs. below-average fitness categories. To which two well-known risk factors is this mortality excess equivalent? Is there a ceiling effect at high fitness levels?
- The Cleveland Clinic data showed that the protective effect of fitness was more pronounced in women than in men at every fitness stratum. Why might this sex difference exist, and what are the practical implications for exercise prescription in women?
- The Kokkinos et al. cohort (n = 750,302; mean follow-up 10.2 years) reported approximately a 4-fold mortality gradient from Very-Low to Very-High fitness. What does this gradient tell us about the dose–response between fitness and survival?
- Patients recovering from Long COVID or ME/CFS often show severely reduced exercise capacity (<5 METs). Using the Cleveland Clinic mortality gradient data, explain the clinical urgency of safe, individualised CRF rehabilitation in these populations.
Key References
- Kodama S, Saito K, Tanaka S, et al. Cardiorespiratory fitness as a quantitative predictor of all-cause and cardiovascular mortality in healthy men and women: a meta-analysis. JAMA 301 (19), 2009: 2024–2035.
- Kokkinos P, Faselis C, Samuel IBH, et al. Cardiorespiratory fitness and mortality risk across the spectra of age, race, and sex. J Am Coll Cardiol 80 (6), 2022: 598–609.
- Mandsager K, Harb S, Cremer P, et al. Association of cardiorespiratory fitness with long-term mortality among adults undergoing exercise treadmill testing. JAMA Netw Open 1 (6), 2018: e183605.
3 The VO₂ Max Verdict and Practical Recommendations
Learning objectives:
- The 2024 CRF-vs-VO₂ max meta-analysis and the 234-fold participant imbalance
- The similar ~14 % effect as construct validity — and why it does not license wearable VO₂ max
- Metric-by-metric recommendations, and the clinical niches where direct VO₂ max retains value
3.1 Meta-Analysis: 42 Studies, CRF vs. VO₂ Max (2024)
Data imbalance between METs-based CRF and direct VO₂ max evidence. a: >99 % of outcome-linked participants contributed MET data; <1 % contributed direct VO₂ max data. b: The same imbalance as a relative participant count — 234-fold more participants in the MET arm. c: Point estimates for cardiovascular mortality reduction are remarkably similar (≈14 %), confirming construct validity — but the evidence base rests almost entirely on METs (Swain and Franklin 2024).
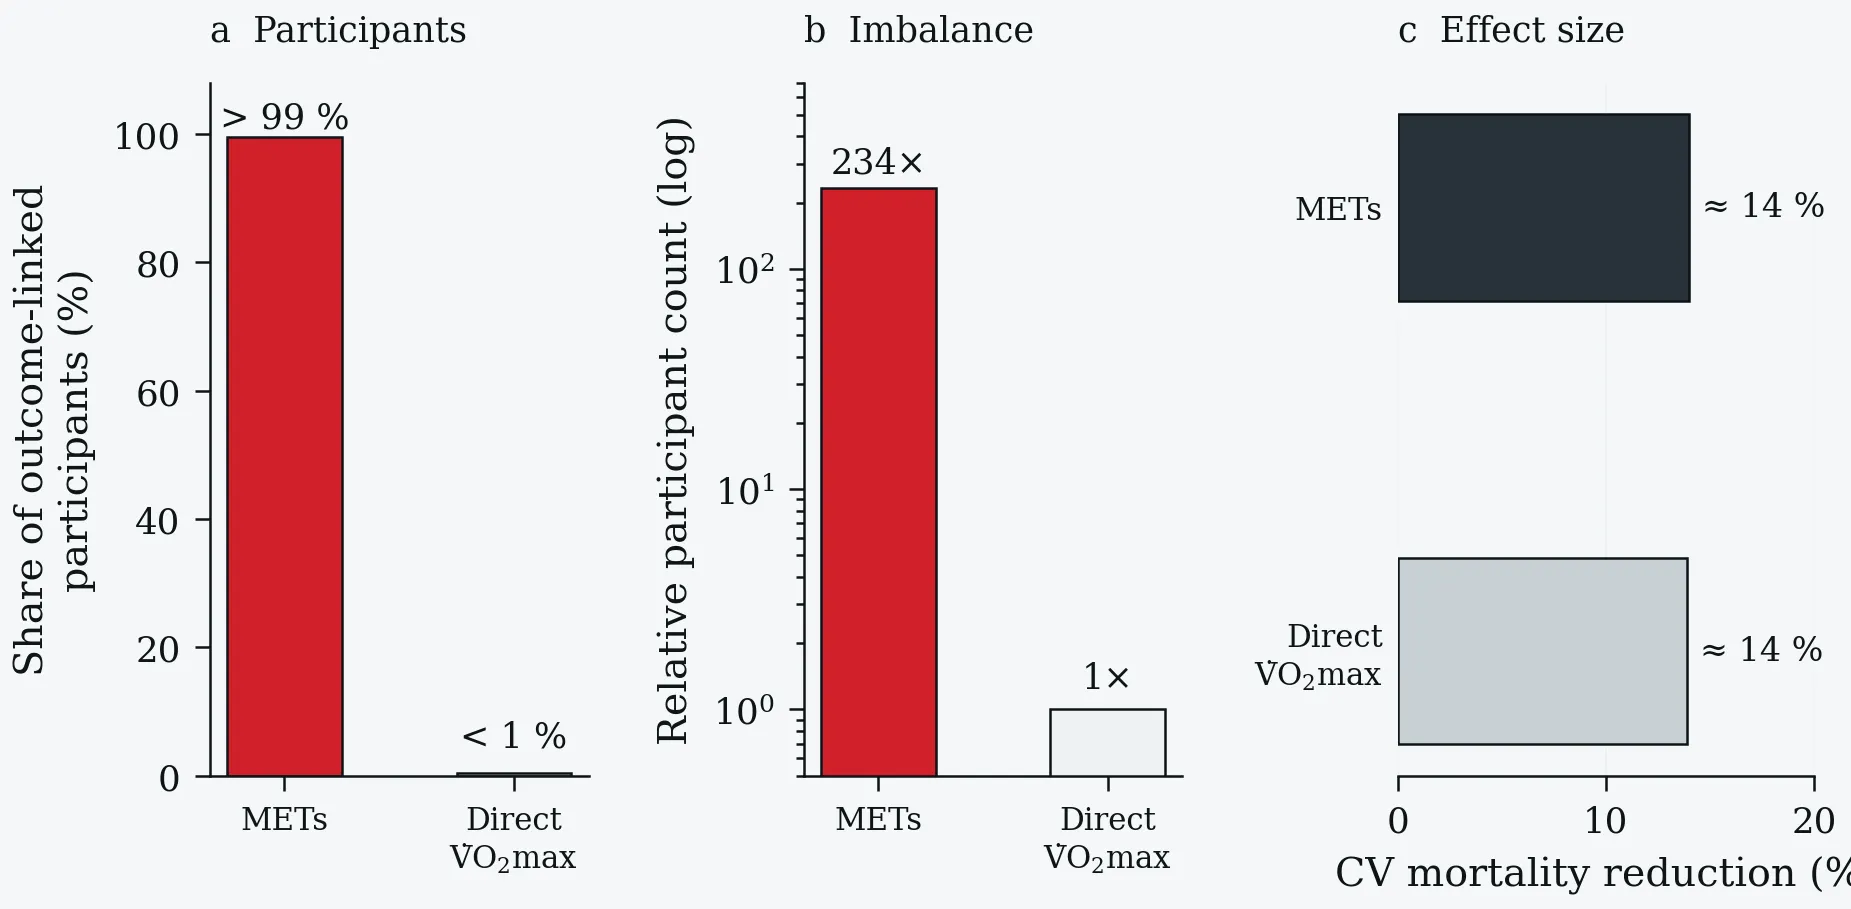
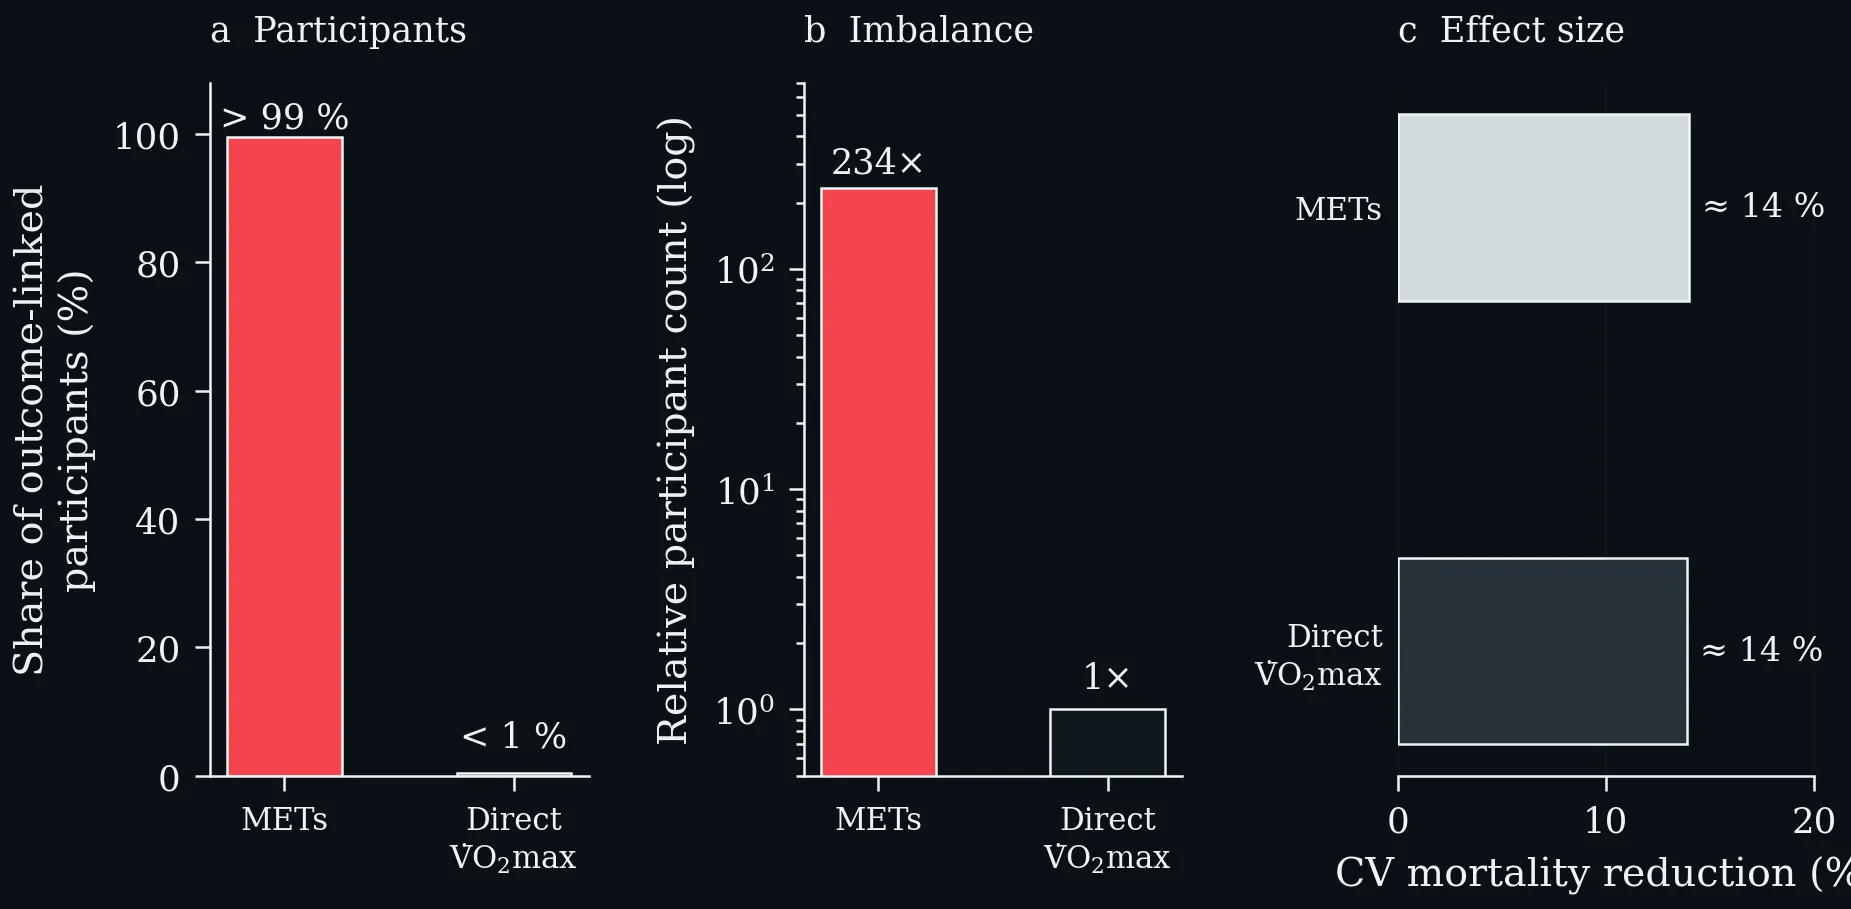
Data imbalance between METs-based CRF and direct VO₂ max evidence. a: >99 % of outcome-linked participants contributed MET data; <1 % contributed direct VO₂ max data. b: The same imbalance as a relative participant count — 234-fold more participants in the MET arm. c: Point estimates for cardiovascular mortality reduction are remarkably similar (≈14 %), confirming construct validity — but the evidence base rests almost entirely on METs (Swain and Franklin 2024).
Critical Finding: Data Imbalance
234-fold more participants contributed data via METs than via direct VO₂ max measurement. Over 99 % of all evidence linking fitness to mortality derives from METs-based CRF — not VO₂ max.
The evidence base is profoundly imbalanced. The 2024 meta-analysis by Swain and Franklin (2024), comparing CRF and VO₂ max across 42 studies, revealed that 234-fold more study participants contributed METs-based CRF data than direct VO₂ max data. This asymmetry reflects both the practical accessibility of METs testing and the specialized requirements for direct VO₂ max measurement. The near-identical ≈14 % effect estimates confirm construct validity — the two metrics capture the same underlying aerobic capacity — but this similarity does not justify replacing an accessible, well-evidenced measure (METs) with an inaccurate wearable estimate of the other.
3.2 Specific Clinical Applications of VO₂ Max
In selected clinical populations, direct VO₂ max measurement has demonstrated utility: in heart failure for risk stratification and transplant listing; in pulmonary hypertension as a prognostic marker (Topol 2026); and in pre-operative evaluation for predicting post-surgical cardiopulmonary complications (Older et al. 1993).
3.3 Practical Recommendations
Evidence-based fitness-monitoring recommendations by metric.
| Metric | Recommendation |
|---|---|
| METs (CRF) | Preferred for most healthy adults. Free, universally accessible, best studied for all-cause and cardiovascular mortality outcomes (>99 % of evidence base). Use treadmill/bicycle speed-incline charts, Bruce protocol, or HR formula. |
| VO₂ Max (lab) | Reserve for: (a) high-performance athletes; (b) heart failure/pulmonary hypertension risk stratification; (c) pre-operative evaluation. |
| Wearable VO₂ Max | Not recommended for clinical or lifestyle decision-making. MAPE 7–16 %, directional biases, and extrinsic confounders render it unreliable. |
| Strength & Balance | Include alongside CRF. Combined aerobic + strength training is superior to aerobic training alone for mortality reduction (Kim et al. 2023). |
Evidence-based fitness-monitoring recommendations by metric.
Topol’s bottom line: “Perhaps the better strategy is to be as physically active as possible and not worry about any metric!” (Topol 2026). The emphasis should be on building a comprehensive, enjoyable activity habit rather than chasing a single number from a device whose accuracy is demonstrably limited.
3.4 Summary Comparison: CRF vs. VO₂ Max
Head-to-head comparison of CRF/METs and VO₂ max across measurement, cost, evidence base, and application.
| Dimension | CRF / METs | VO₂ Max |
|---|---|---|
| Measurement | Treadmill/bike; HR formula | Direct gas exchange in metabolic lab |
| Cost | Free | ≈$150/test |
| Accessibility | Universal | Specialist lab only |
| Wearable estimate | Indirect (step count, HR) | Algorithmic imputation (MAPE 7–16 %) |
| Evidence base | >750,000 per large study | <1,300 per study (direct measure) |
| Fraction of outcome data | >99 % | <1 % |
| AHA recommendation | Clinical vital sign | Niche clinical/sports use |
| Target population | All healthy adults | Elite athletes; HF/PH patients; pre-op |
| AI platform misuse | Rare | Frequent |
Head-to-head comparison of CRF/METs and VO₂ max across measurement, cost, evidence base, and application.
One-Minute-Paper Topics
A One-Minute-Paper (OMP) is a short, focused prompt that students answer in ~60 seconds at the end of a session to consolidate learning, surface misconceptions, and provide formative feedback. When answering, be concise, specific, and use terminology from today’s session.
- The 2024 meta-analysis revealed that 234-fold more participants contributed data via METs than via direct VO₂max measurement. Why does this imbalance matter for evidence-based practice, and what does it imply for the popular “VO₂max craze”?
- Both METs and direct VO₂max show similar cardiovascular mortality reduction (~14%). What does this tell us about construct validity? And why does the similarity NOT justify replacing METs with wearable VO₂max estimates in clinical practice?
- In which three clinical populations does direct VO₂max measurement retain value according to the lecture (heart failure, pulmonary hypertension, pre-operative evaluation)? For each, state the specific clinical question it addresses.
- The summary table recommends including strength and balance alongside CRF. What is the evidence for combined aerobic + strength training vs. aerobic training alone for mortality reduction? Name one relevant study cited.
- Using only a stopwatch and a standard staircase, how could a clinician estimate a patient’s METs without laboratory equipment?
- Topol concludes: “Perhaps the better strategy is to be as physically active as possible and not worry about any metric!” Do you agree with this statement from a public health communication standpoint? What are its advantages and risks?
- For each of the following scenarios, which fitness metric (METs, direct VO₂max, wearable VO₂max) would you recommend and why: (a) population-level epidemiological study; (b) elite cyclist planning periodisation; (c) heart failure patient pre-transplant listing; (d) healthy middle-aged adult wanting to monitor personal fitness.
- Topol describes a widespread conflation of VO₂max with CRF in popular health media. Give two concrete examples of how this conflation could harm individual health behaviour, and propose one public communication strategy to correct it.
Key References
- Kim J, Park Y, Lee K, et al. Combined cardiorespiratory fitness and muscle strength in relation to all-cause and cardiovascular mortality: findings from the UK Biobank. Br J Sports Med, 2023 (Epub ahead of print).
- Older P, Hall A, Hader R. Cardiopulmonary exercise testing as a screening test for perioperative management of major surgery in the elderly. Chest 104 (3), 1993: 701–704.
- Swain DP, Franklin BA. Comparison of cardiorespiratory fitness expressed in METs versus measured VO₂ max in the prediction of mortality. J Sci Med Sport, 2024. (citation to be completed)
- Topol E. The flawed VO₂ max craze: conflation with cardiorespiratory fitness. Ground Truths (Substack), 23 February 2026.
References
- Kim J, Park Y, Lee K, et al. Combined cardiorespiratory fitness and muscle strength in relation to all-cause and cardiovascular mortality: findings from the UK Biobank. Br J Sports Med, 2023 (Epub ahead of print).
- Kodama S, Saito K, Tanaka S, et al. Cardiorespiratory fitness as a quantitative predictor of all-cause and cardiovascular mortality in healthy men and women: a meta-analysis. JAMA 301 (19), 2009: 2024–2035.
- Kokkinos P, Faselis C, Samuel IBH, et al. Cardiorespiratory fitness and mortality risk across the spectra of age, race, and sex. J Am Coll Cardiol 80 (6), 2022: 598–609.
- Mandsager K, Harb S, Cremer P, et al. Association of cardiorespiratory fitness with long-term mortality among adults undergoing exercise treadmill testing. JAMA Netw Open 1 (6), 2018: e183605.
- Older P, Hall A, Hader R. Cardiopulmonary exercise testing as a screening test for perioperative management of major surgery in the elderly. Chest 104 (3), 1993: 701–704.
- Ross R, Blair SN, Arena R, et al. Importance of assessing cardiorespiratory fitness in clinical practice: a case for fitness as a clinical vital sign — a scientific statement from the American Heart Association. Circulation 134 (24), 2016: e653–e699.
- Swain DP, Franklin BA. Comparison of cardiorespiratory fitness expressed in METs versus measured VO₂ max in the prediction of mortality. J Sci Med Sport, 2024. (citation to be completed)
- Tedesco S, Sica M, Ancillao A, et al. Accuracy of consumer-grade wearables for VO₂ max estimation: a systematic review. Electronics 14 (15), 2025: 3081.
- Topol E. The flawed VO₂ max craze: conflation with cardiorespiratory fitness. Ground Truths (Substack), 23 February 2026.