Homeostasis, Hormesis and the Acute Response to Exercise
Table of Contents
- Two Frameworks, One Organism
- The ABA Protocol
- Acute Responses to Exercise
- The Biphasic Dose–Response
- The Clinical Edge
Learning objectives:
- Define homeostasis as acute regulation and hormesis as chronic adaptation, and name their different time scales
- Describe the ABA logic of a single maximal exercise test — baseline, intervention, recovery
- Read the cardiovascular, respiratory, metabolic and thermoregulatory response from a single cardiopulmonary exercise test
- Interpret heart rate, V̇E, V̇O₂, breathing frequency and RER against the threshold region of the same test
- Explain the biphasic dose–response and the J-curve of immune function
- State why zone-based prescription can be harmful in post-exertional malaise
1 Two Frameworks, One Organism
Full treatment of the homeostasis–hormesis frame, including the control-loop figures and the ME/CFS section, is on Lecture 1 §2–3 of the Exercise Physiology series.
Lecture 2 described what happens acutely when load is imposed. Two theoretical frames organise how those observations are interpreted. Homeostasis is the control-loop logic of acute regulation: a disturbance moves a controlled variable, sensors detect the deviation, effectors return it towards a set point, and the system recovers. Hormesis is the adaptive logic of repetition: a stimulus that is disturbing in the acute term produces, over days and weeks, a structural and functional response that raises the capacity to tolerate the same stimulus. Training is hormesis with a schedule.
The two frames operate on complementary temporal scales and answer different questions. Asking “did the person recover?” is a homeostatic question and is answered within minutes to hours. Asking “did the person adapt?” is a hormetic question and requires repeated measurement across weeks. Most misreadings of performance data come from answering one question with the other’s data.
2 The ABA Protocol
A single maximal exercise test, read as an ABA design, is the smallest complete demonstration of homeostatic regulation: A — baseline measurements before load; B — the intervention, the graded test to exhaustion; A′ — recovery, with repeated measurements until the variables return towards baseline. In the cohort dataset used in Lecture 11 and Lecture 12 this design appears in explicit form, with eight sampling time points arranged around a one-minute sit-to-stand test: two before, one immediately after, and five across 45 minutes of recovery. The design is deliberately simple so that the shape of the recovery curve, not the peak value alone, becomes the object of interpretation.
Acute physical stress disturbs homeostasis, and physiological mechanisms rebalance the disturbance until the system returns towards rest. Exertion increases breathing so that more oxygen is taken up; for that oxygen to reach the muscles, circulation must increase; for circulation to increase, the interval between heartbeats must shorten while stroke volume rises; and for ventilation to increase, both breathing depth and breathing frequency must rise. Ventilation and the duration of heartbeats are therefore the typical parameters with which the function of the respiratory and cardiovascular systems is described.
The case used throughout the following chapter makes one such disturbance measurable. A healthy male recreational athlete (23 years, 176 cm, 69 kg, BMI 22.3 kg·m⁻², general training background) performed a maximal incremental step test on a cycle ergometer, with the external work rate incremented by 50 W every three minutes from 50 W to a final 300 W stage terminated after 30 s at volitional exhaustion (peak 4.3 W·kg⁻¹). The lactate-based reference loads are an aerobic threshold of 117 W and an individual anaerobic threshold of 145 W. Every recording is structured as an ABA protocol: phase A1 baseline rest, phase B the step test, and phase A2 passive recovery — the perturbation → correction → recovery loop made measurable. Figures 1–4 and Tables 1–3 are reproduced from Lecture 1 §2.2 of the Exercise Physiology series.
3 Acute Responses to Exercise
When the organism engages in physical activity, multiple physiological systems are activated at the same time. The four sub-chapters below take them one at a time, but the figures show them on a single time axis, because the point of the ABA reading is that they move together.
Cardiorespiratory response to the maximal incremental step test, with mass-related oxygen uptake. Top strip: external work rate. Phases are A1 baseline rest, B step test (red) and A2 passive recovery; vertical hairlines mark the two transitions. (A) Heart rate, beat-to-beat recording averaged in 10-s bins, rising from 51 to 187 bpm. (B) Ventilation (V̇E), rising from about 6 l·min⁻¹ at rest to 122.8 l·min⁻¹ at the end of the final stage, with a peak of 127.8 l·min⁻¹ ten seconds after load offset. (C) Mass-related oxygen uptake in ml·min⁻¹·kg⁻¹. All three series are 10-s averages.
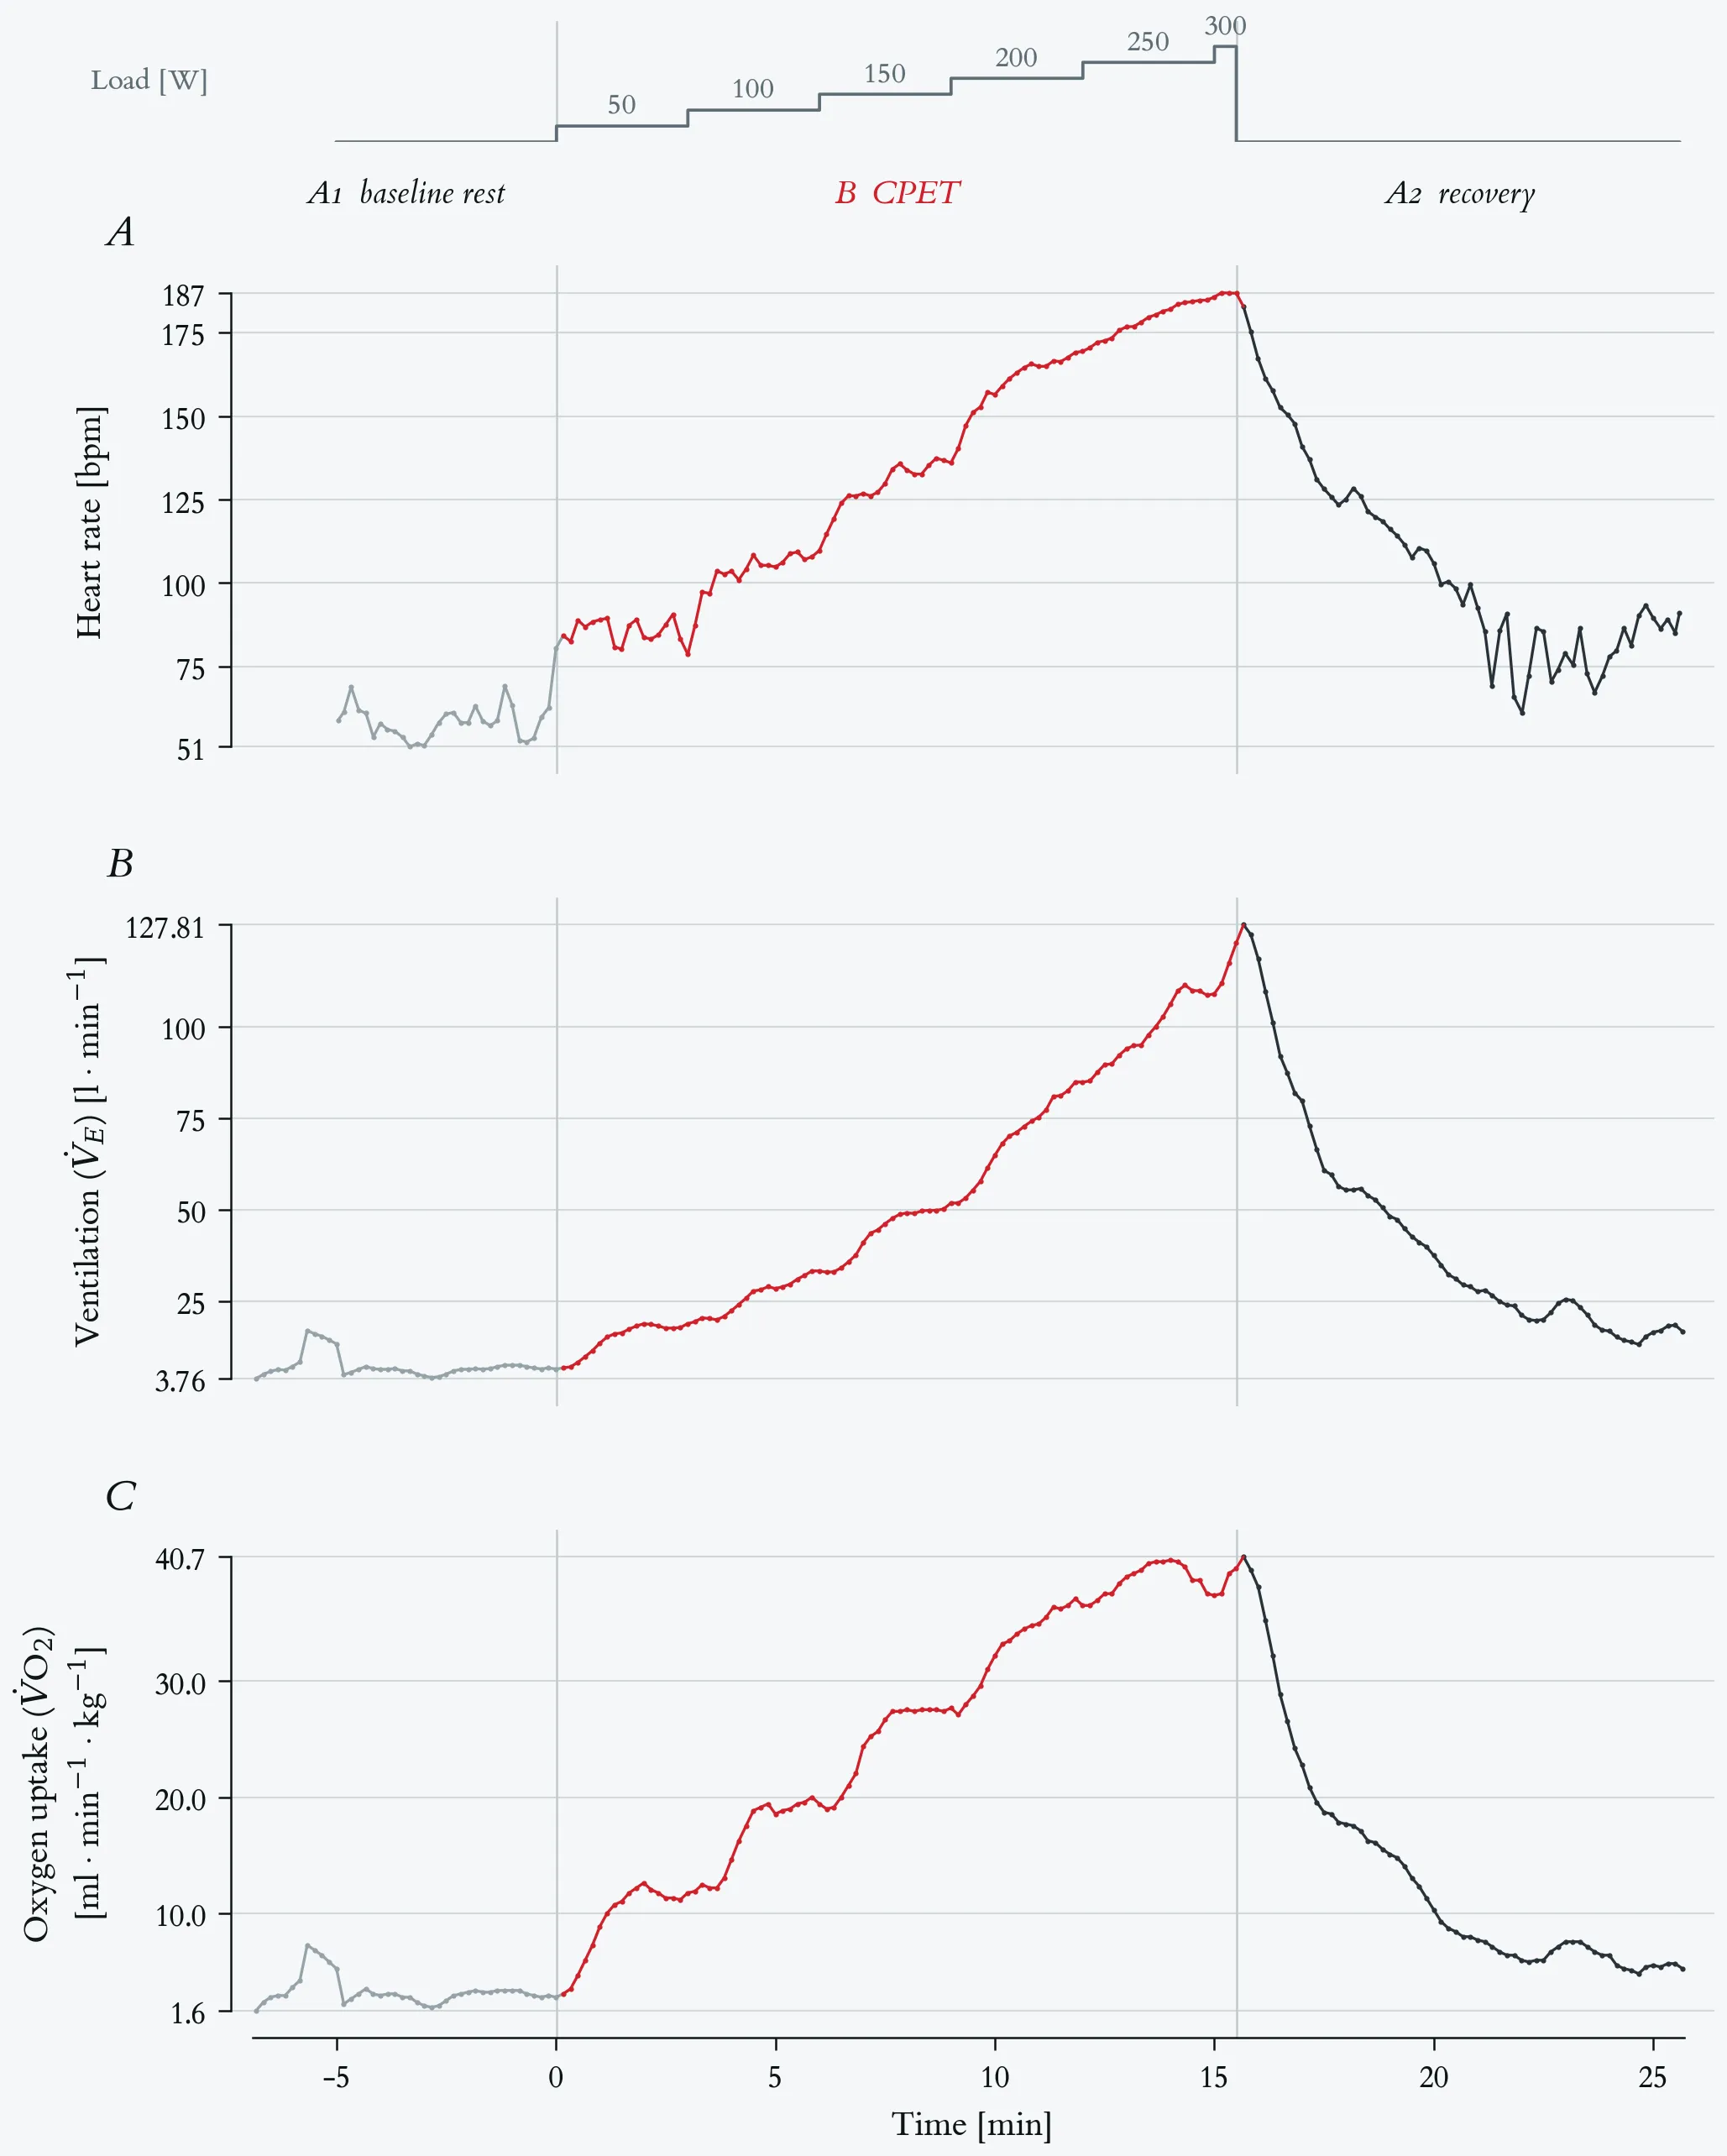
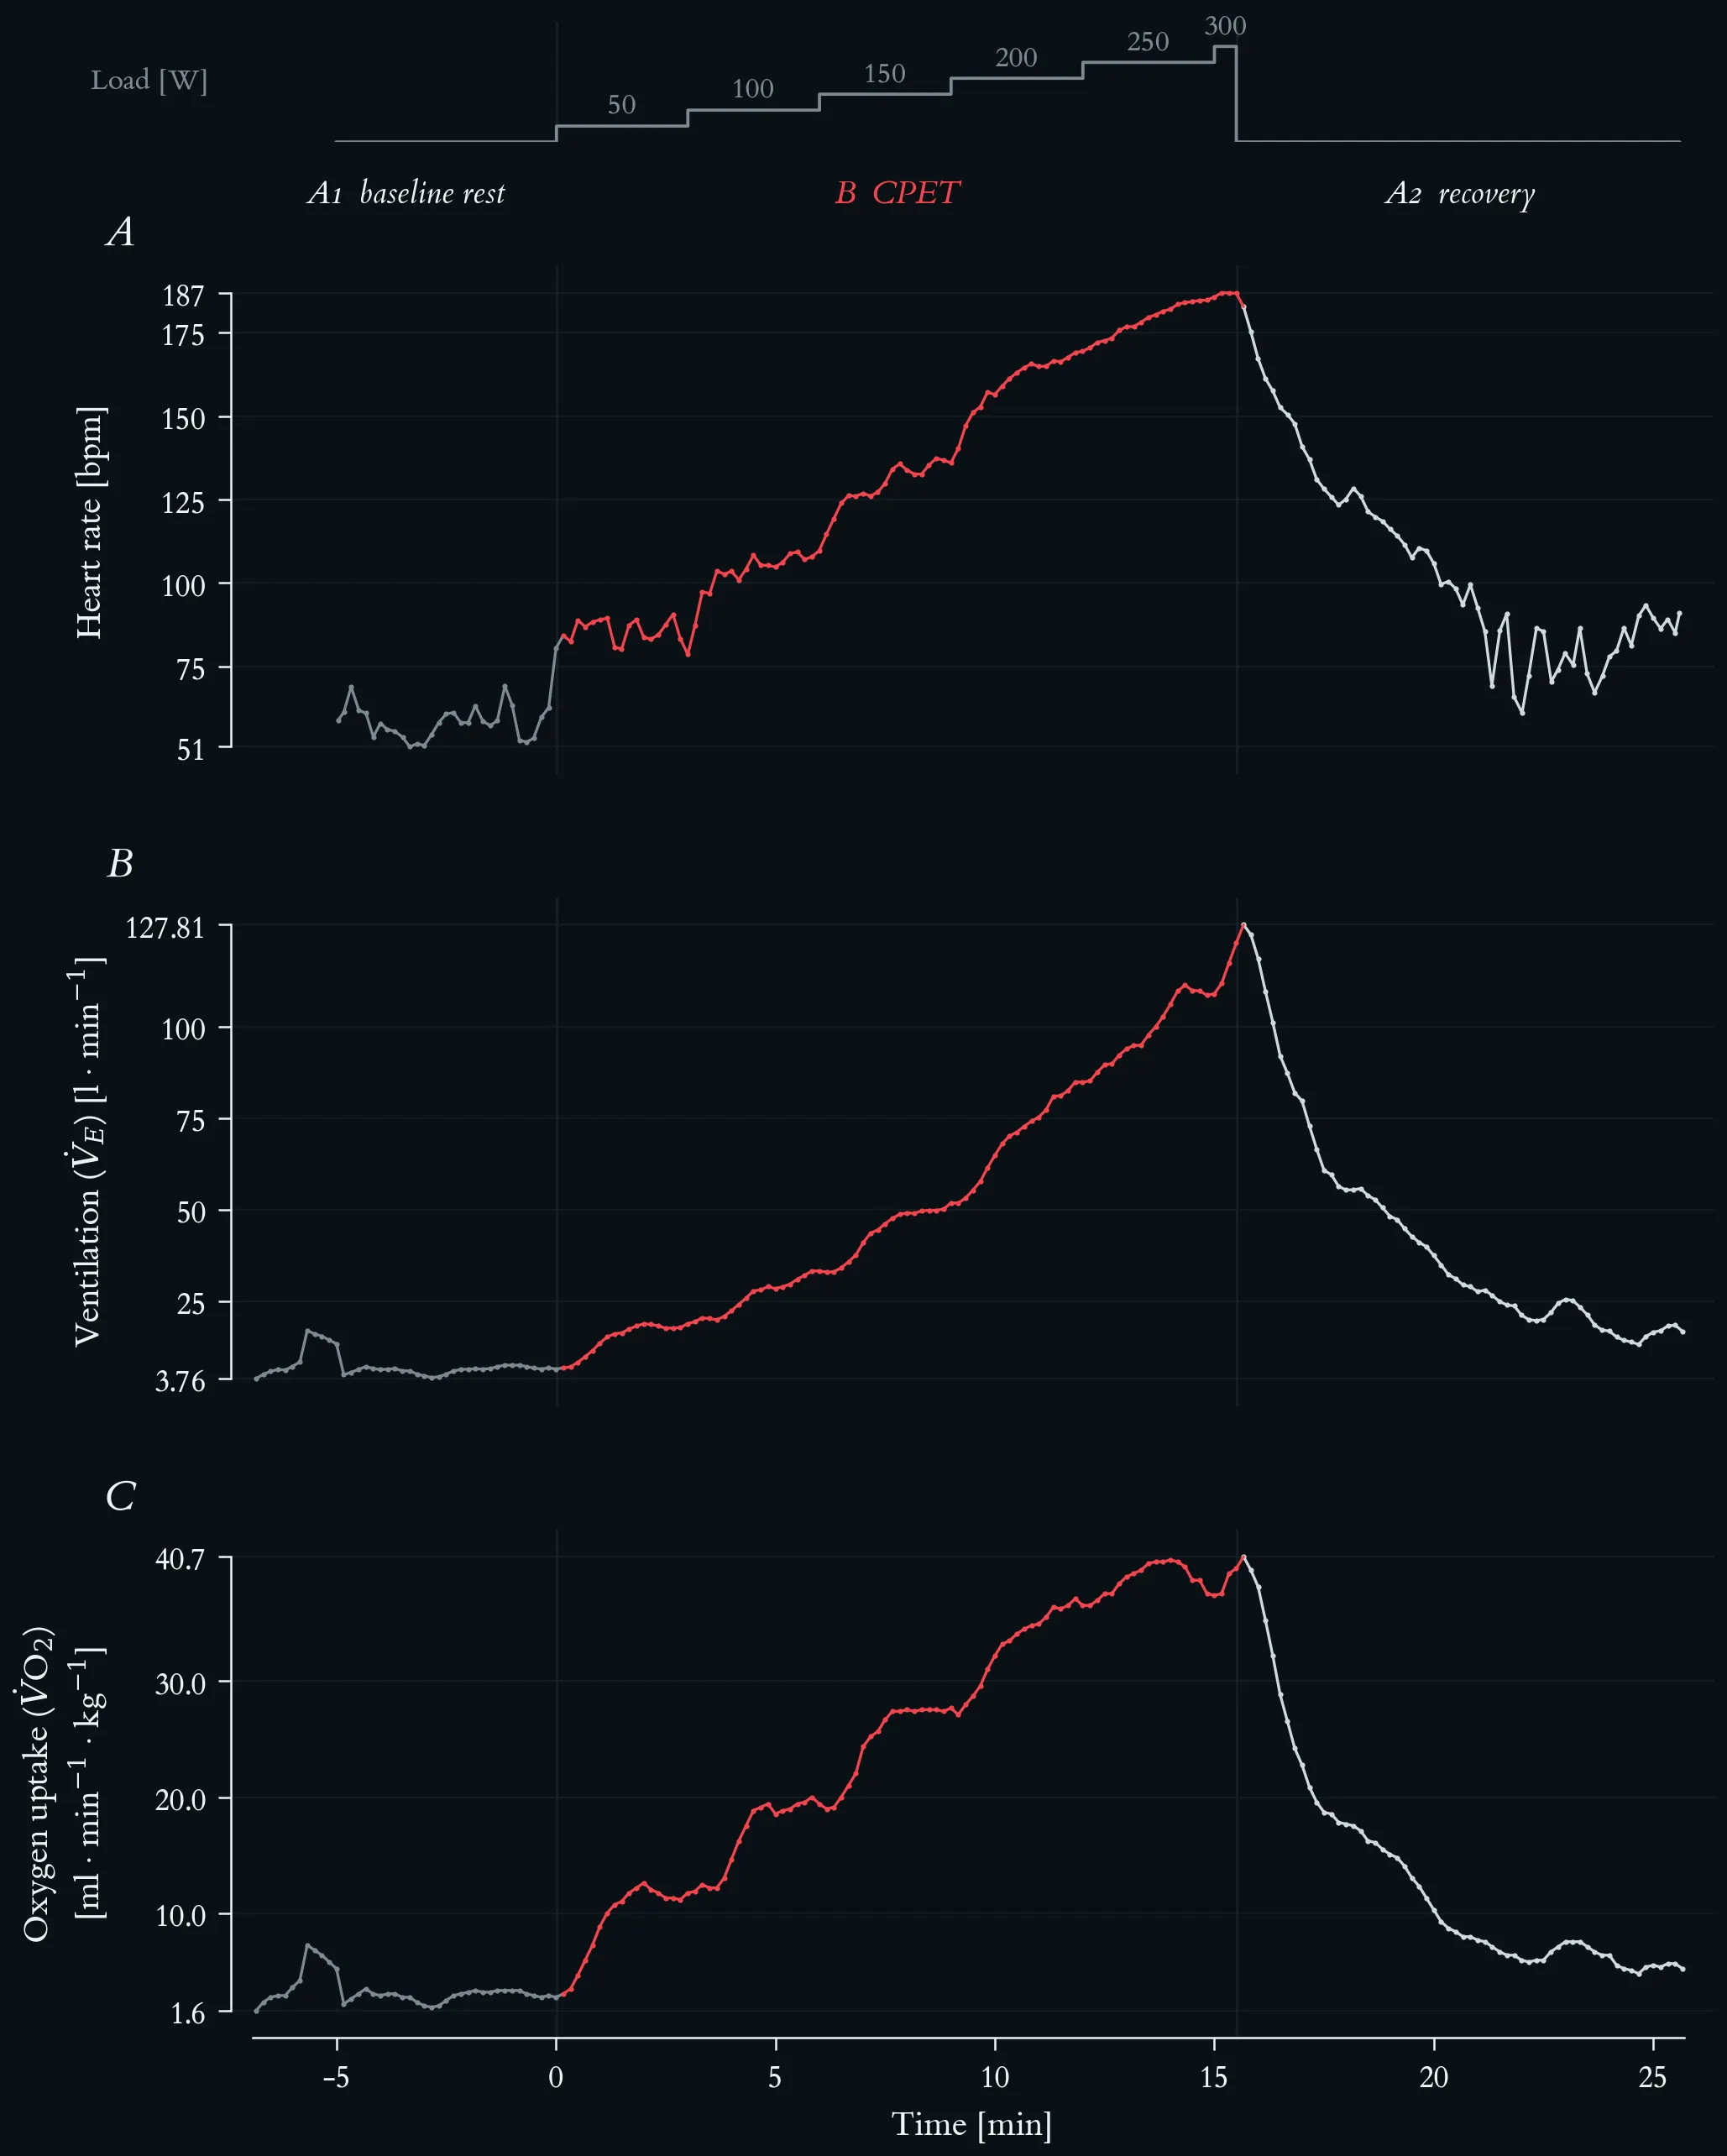
Cardiorespiratory response to the maximal incremental step test, with mass-related oxygen uptake. Top strip: external work rate. Phases are A1 baseline rest, B step test (red) and A2 passive recovery; vertical hairlines mark the two transitions. (A) Heart rate, beat-to-beat recording averaged in 10-s bins, rising from 51 to 187 bpm. (B) Ventilation (V̇E), rising from about 6 l·min⁻¹ at rest to 122.8 l·min⁻¹ at the end of the final stage, with a peak of 127.8 l·min⁻¹ ten seconds after load offset. (C) Mass-related oxygen uptake in ml·min⁻¹·kg⁻¹. All three series are 10-s averages.
Resting V̇O₂ is 2.8 ml·min⁻¹·kg⁻¹, roughly four fifths of one metabolic equivalent. End-of-stage values rise steeply and almost linearly to 200 W — 11.7 → 19.4 → 27.7 → 36.5 ml·min⁻¹·kg⁻¹ — and then flatten at 37.4 and 39.7 over the two final stages. The peak of 40.7 ml·min⁻¹·kg⁻¹ falls in the first recovery sample, ten seconds after load offset, the usual consequence of 10-s averaging and gas-transport delay; it is therefore the peak value of the test, not a steady-state value of the 300 W stage.
The ventilation and oxygen-uptake panels separate below and above the threshold region: while V̇O₂ stops rising proportionally from 200 W onward, V̇E keeps accelerating (84.8 → 109.0 → 122.8 l·min⁻¹), so the ventilatory equivalent for oxygen rises from about 31 at rest to 45 at peak. This disproportionate ventilatory rise sets in above the individual anaerobic threshold of 145 W. Values are uncorrected 10-s averages; no plateau criterion is applied.
Heart rate, ventilation and mass-related oxygen uptake at the end of each stage of the maximal incremental step test.
| Load [W] | Time [min] | HR [bpm] | V̇E [l·min⁻¹] | V̇O₂ [ml·min⁻¹·kg⁻¹] |
|---|---|---|---|---|
| rest (A1) | −6.8 – 0.0 | 58 | 6.4 | 2.8 |
| 50 | 0.2 – 3.0 | 85 | 18.8 | 11.7 |
| 100 | 3.2 – 6.0 | 103 | 33.2 | 19.4 |
| 150 | 6.2 – 9.0 | 129 | 51.8 | 27.7 |
| 200 | 9.2 – 12.0 | 160 | 84.8 | 36.5 |
| 250 | 12.2 – 15.0 | 179 | 109.0 | 37.4 |
| 300 | 15.2 – 15.5 | 187 | 122.8 | 39.7 |
| peak (A2, +10 s) | 15.7 | — | 127.8 | 40.7 |
Heart rate, ventilation and mass-related oxygen uptake at the end of each stage of the maximal incremental step test.
3.1 Cardiovascular Response
- Heart rate increases to deliver more oxygen and nutrients to working muscles.
- Stroke volume increases — the heart pumps more blood per beat.
- Blood pressure rises — systolic increases more than diastolic.
- Blood flow is redistributed — 20–25 % of cardiac output at rest goes to muscle; during exercise this rises to 85–90 %.
The rise in heart rate is only the visible half of the cardiac response. Underlying it is a shift in cardiac autonomic control — withdrawal of vagal (parasympathetic) activity and increasing sympathetic drive — which shows itself not in the level of the signal but in its beat-to-beat variability.
Beat-to-beat cardiac autonomic response across the ABA protocol. Phases are A1 baseline rest (5.0 min, 293 beats), B CPET (15.5 min, 2059 beats, red) and A2 recovery (10.1 min, 1070 beats). (A) Beat-to-beat RR interval (n = 3422): mean RR falls from 1029 ms at rest to 452 ms under load, with a minimum of 316 ms at exhaustion. (B) Heart rate, the same recording in 10-s bins. (C) Successive RR differences (ΔRR): scatter collapses from ±330 ms at rest to a near-flat band — RMSSD 102 ms in A1, 16.9 ms across B, 2.6 ms over the final five minutes of loading — and the large excursions return within the first minutes of A2. (D) RSA amplitude in a respiration-guided band f_R ± 0.125 Hz, 60-s windows stepped by 5 s, logarithmic axis; because breathing frequency rises from 0.22 to 0.98 Hz, the classic 0.15–0.40 Hz band would miss the respiratory peak from 150 W onward.
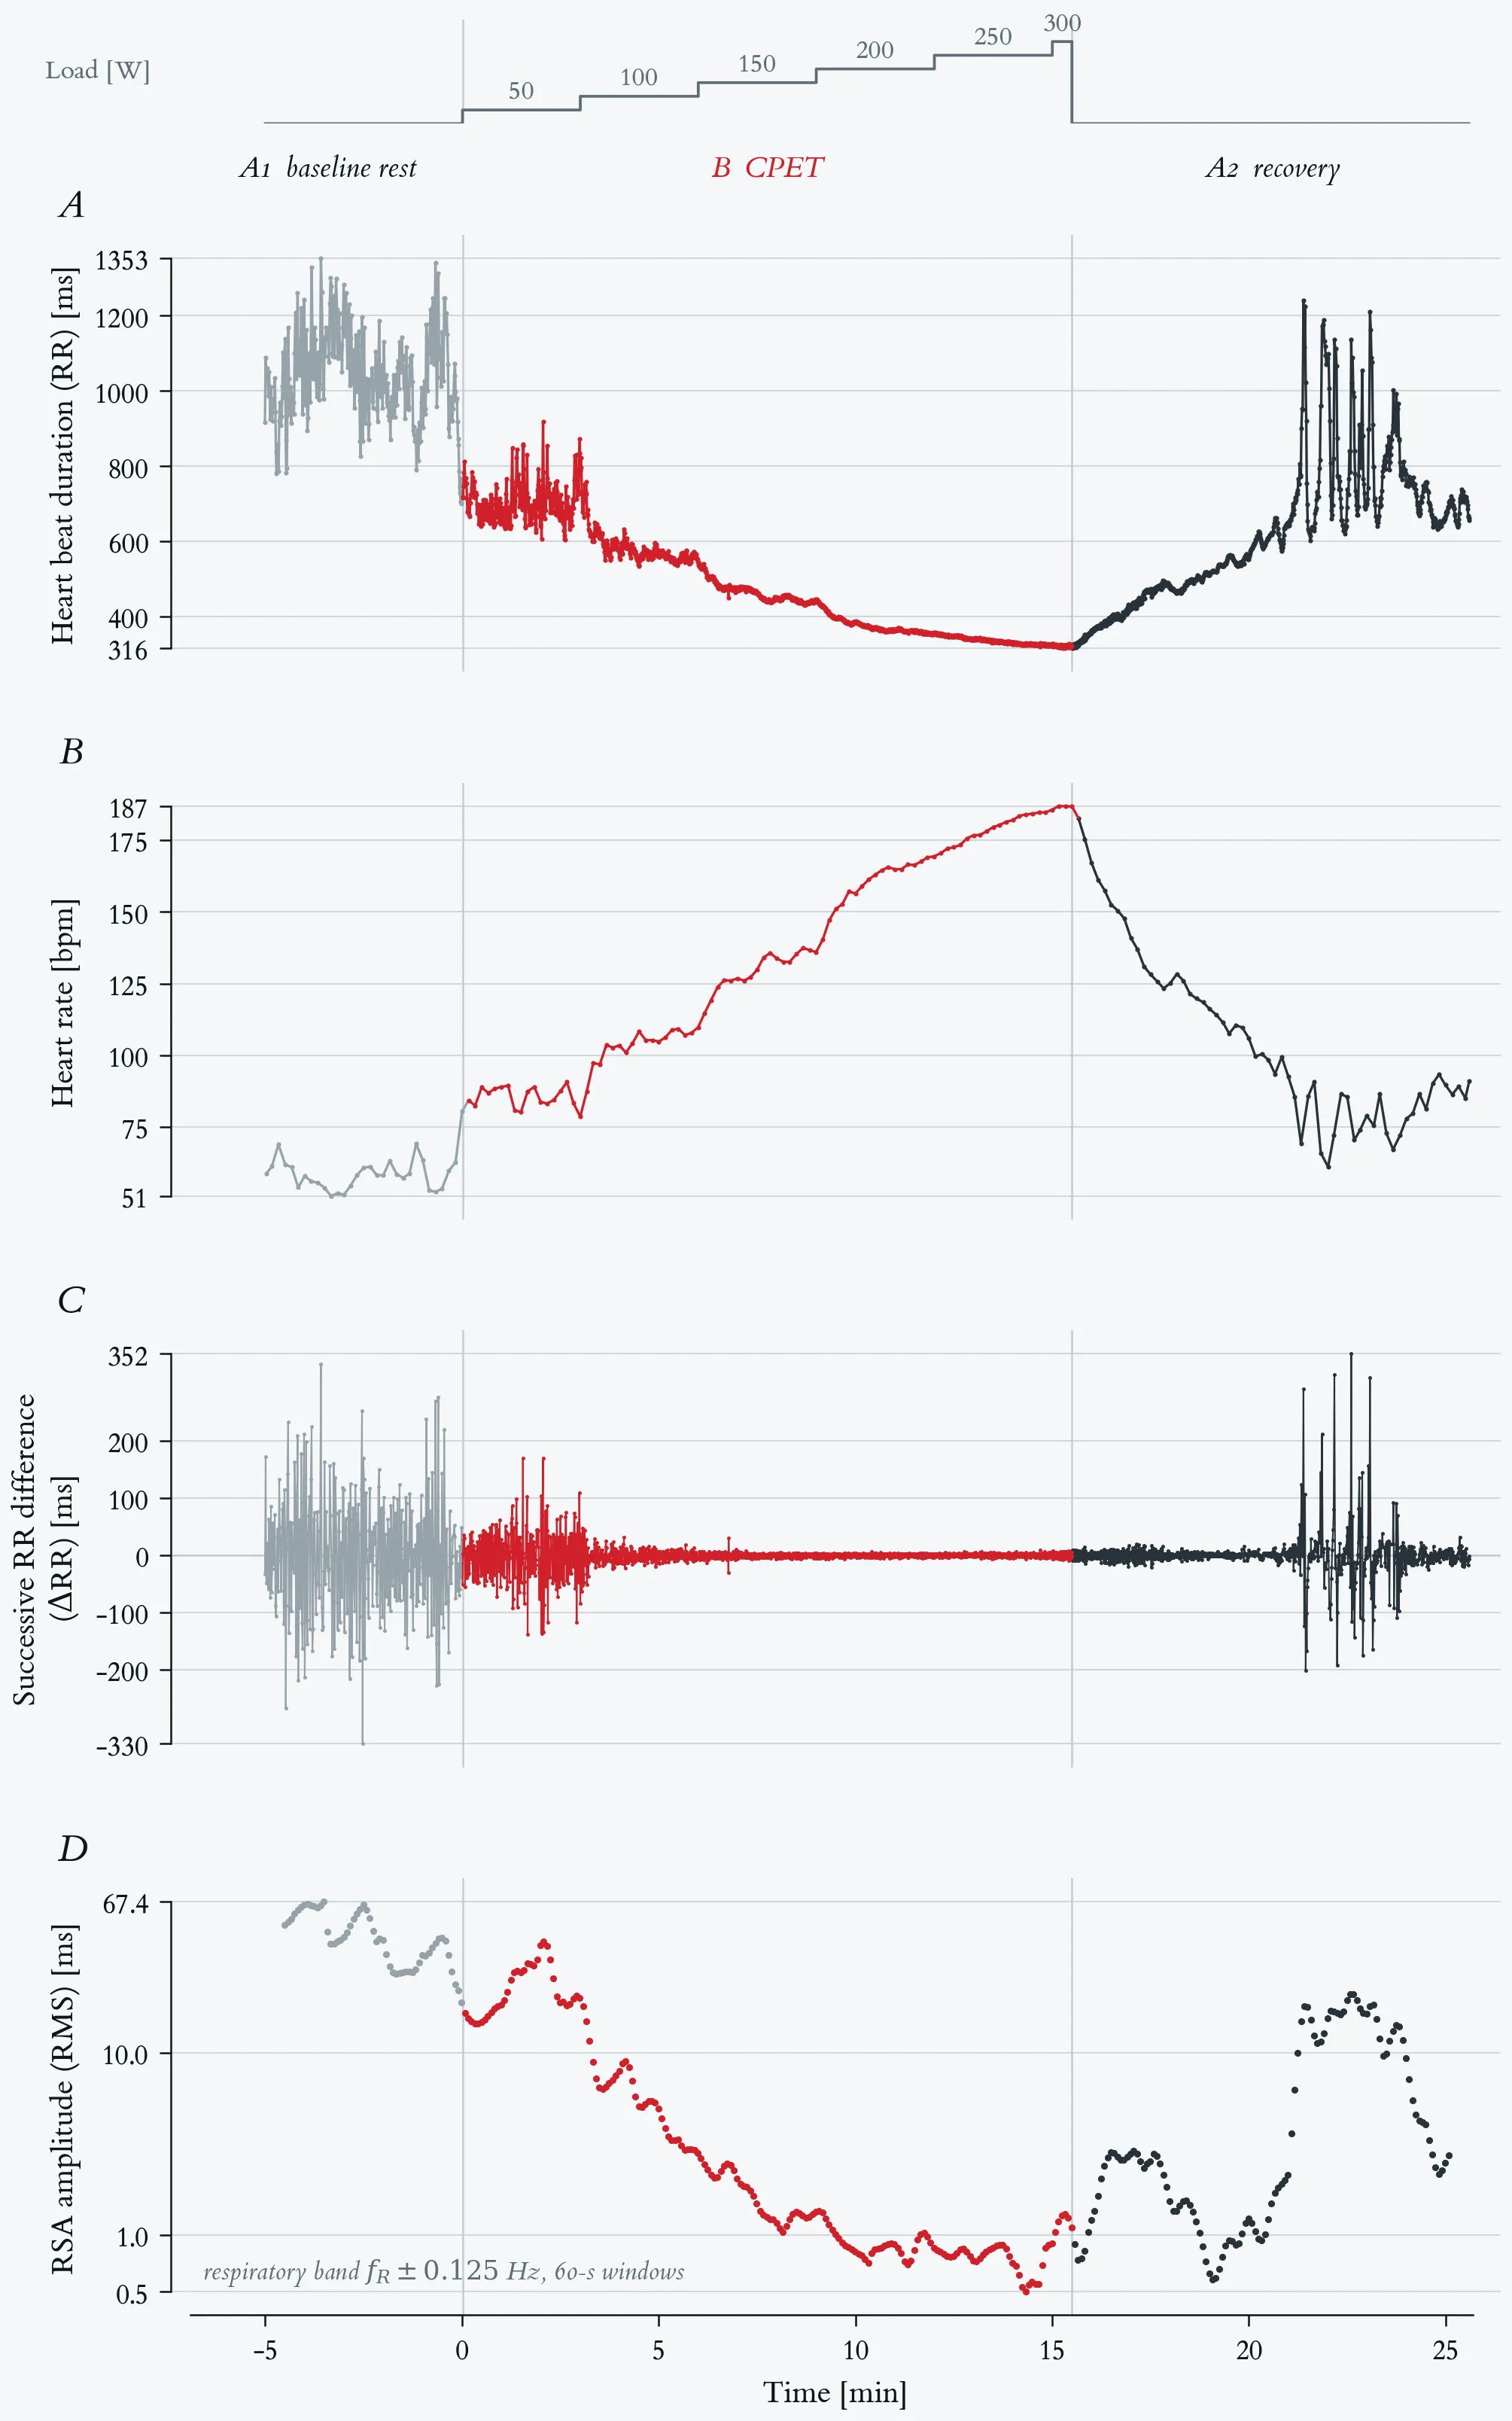
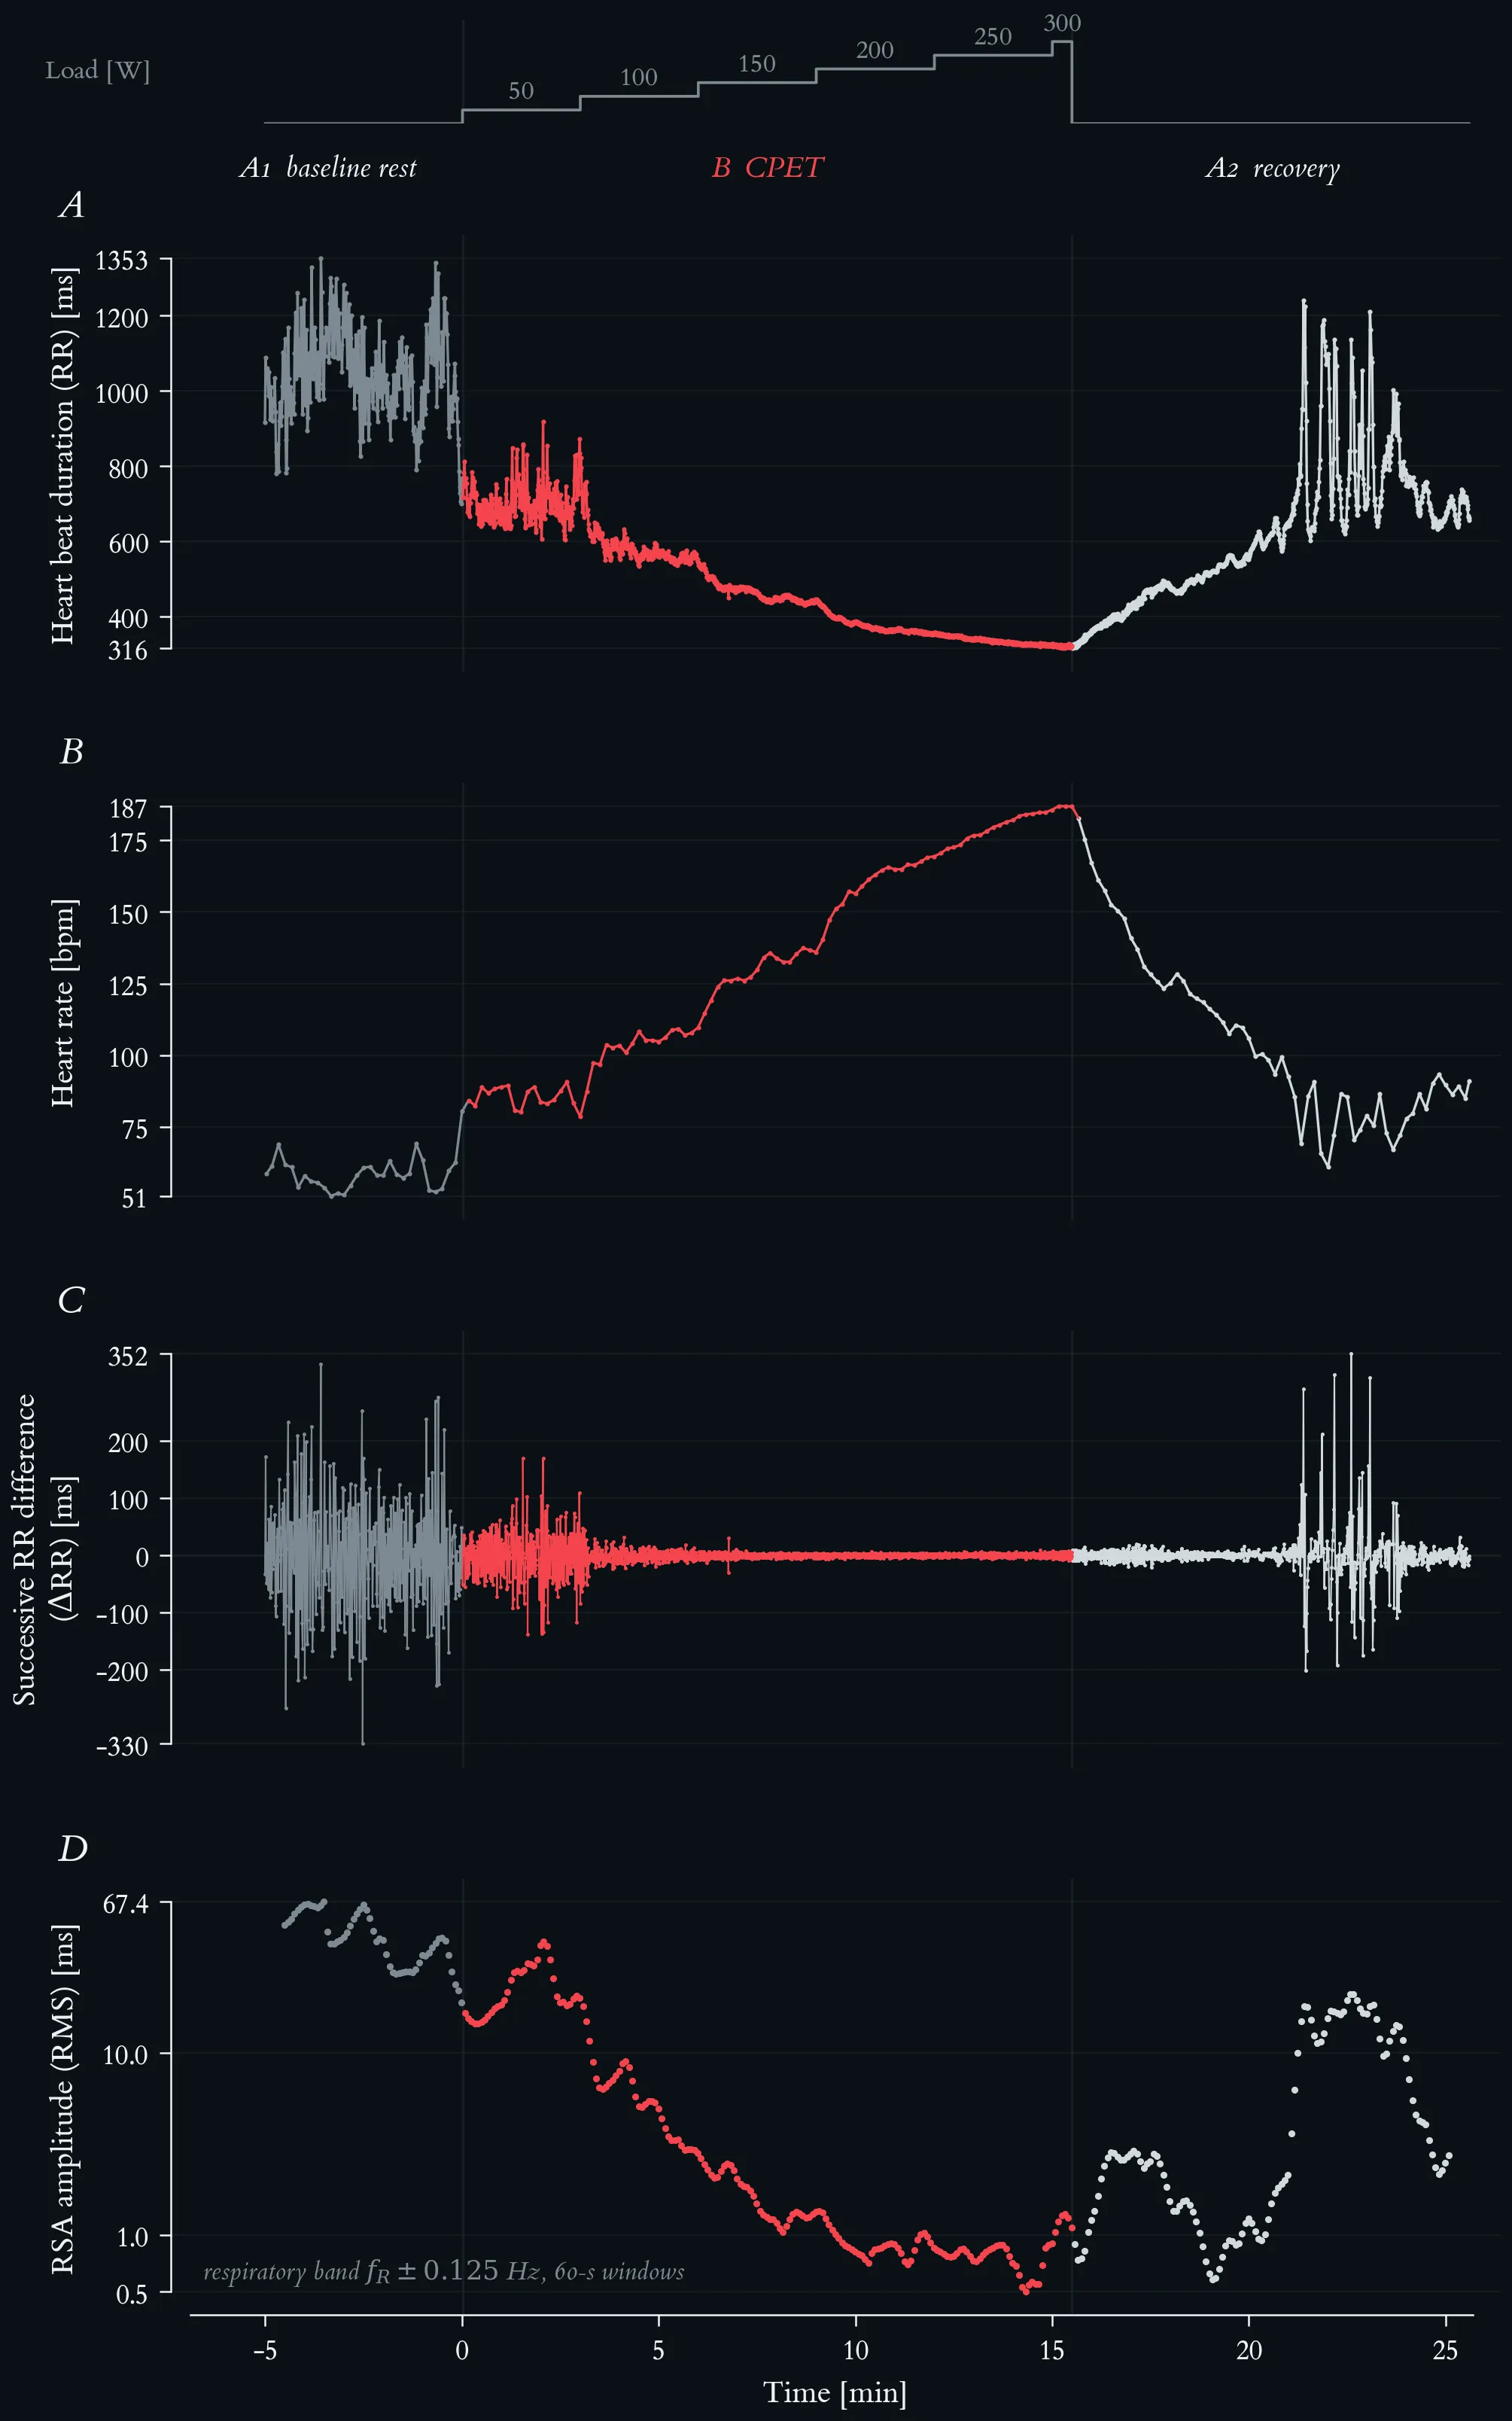
Beat-to-beat cardiac autonomic response across the ABA protocol. Phases are A1 baseline rest (5.0 min, 293 beats), B CPET (15.5 min, 2059 beats, red) and A2 recovery (10.1 min, 1070 beats). (A) Beat-to-beat RR interval (n = 3422): mean RR falls from 1029 ms at rest to 452 ms under load, with a minimum of 316 ms at exhaustion. (B) Heart rate, the same recording in 10-s bins. (C) Successive RR differences (ΔRR): scatter collapses from ±330 ms at rest to a near-flat band — RMSSD 102 ms in A1, 16.9 ms across B, 2.6 ms over the final five minutes of loading — and the large excursions return within the first minutes of A2. (D) RSA amplitude in a respiration-guided band f_R ± 0.125 Hz, 60-s windows stepped by 5 s, logarithmic axis; because breathing frequency rises from 0.22 to 0.98 Hz, the classic 0.15–0.40 Hz band would miss the respiratory peak from 150 W onward.
Panel C makes vagal withdrawal and its reinstatement legible as a change in variability rather than in level: respiratory sinus arrhythmia dominates the resting signal, disappears under sympathetic drive, and reappears abruptly once the load is removed. The RR and ΔRR values are single-beat measurements without artefact correction; the root-mean-square figures are descriptive summaries of these non-stationary phases, not HRV indices in the conventional short-term-stationary sense.
Panels C and D answer two different questions, and putting them on one axis is the point of the figure. Panel C shows how much beat-to-beat variability there is; panel D shows how much of it is respiratory. Under load the two agree: RSA amplitude falls from 43 ms at rest to 1.4 ms by the 150 W stage — the stage containing the individual anaerobic threshold — and to a minimum of 0.49 ms at 250 W, a factor of 54 in amplitude and about 2900 in power. Normalised to the mean RR the collapse survives, 4.06 % to 0.23 %, so it is not an arithmetic consequence of shorter beats.
3.2 Respiratory Response
- Breathing frequency increases to enhance gas exchange.
- Tidal volume increases — a greater volume of air per breath.
- Minute ventilation (V̇E) increases with exercise intensity.
- V̇O₂ increases — more oxygen is extracted from the inhaled air.
Minute ventilation is the product of breathing frequency and tidal volume, and the two contribute unequally across the intensity range.
Breathing frequency across the maximal incremental step test. Top strip: external work rate. Lactate-based reference loads: aerobic threshold 117 W, individual anaerobic threshold 145 W. Phases are A1 baseline rest, B step test (red) and A2 passive recovery. Breathing frequency (fb) as 10-s averages from the metabolic cart, 196 samples.
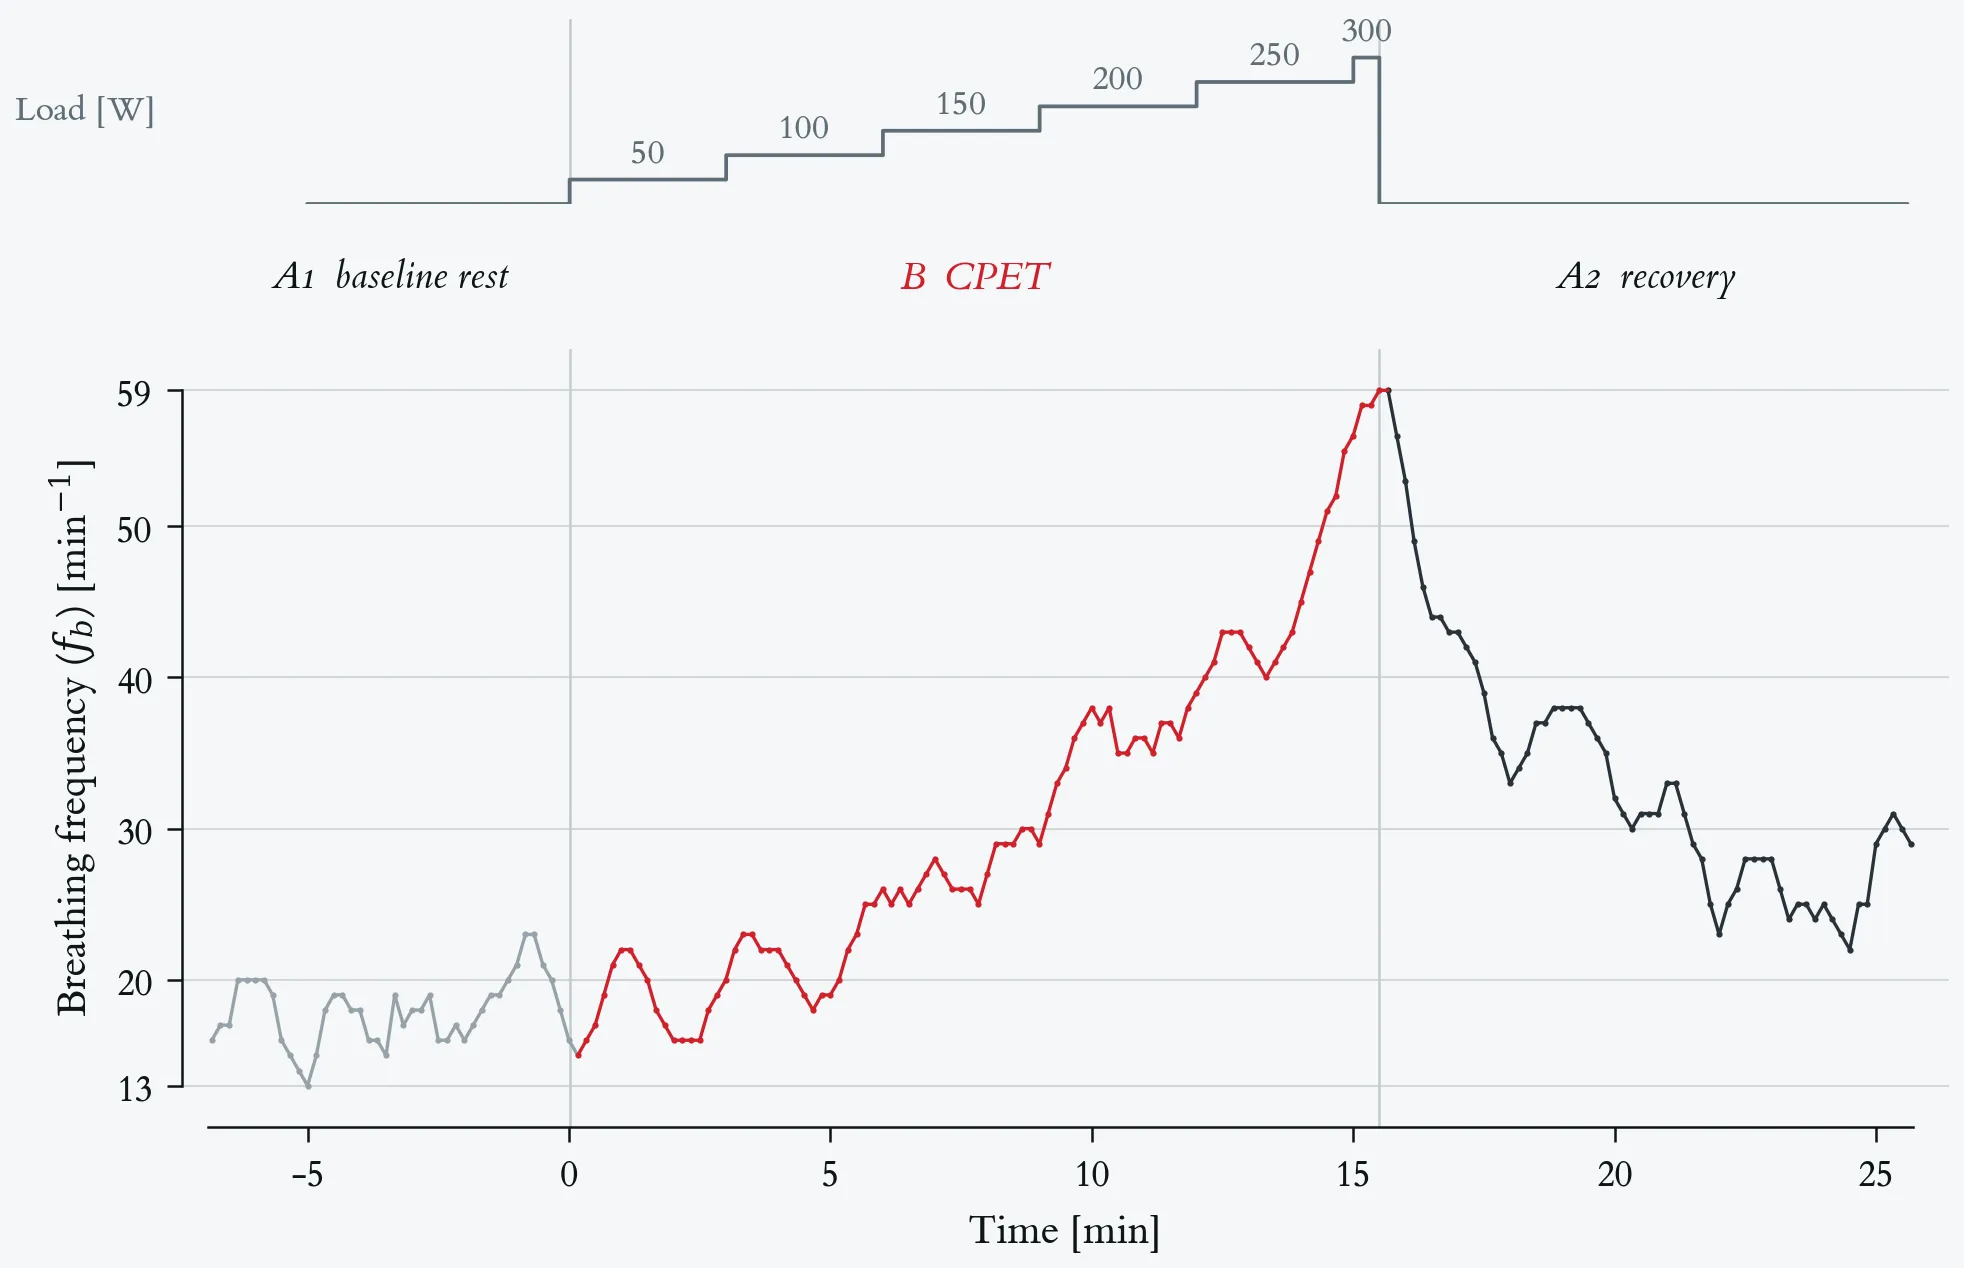
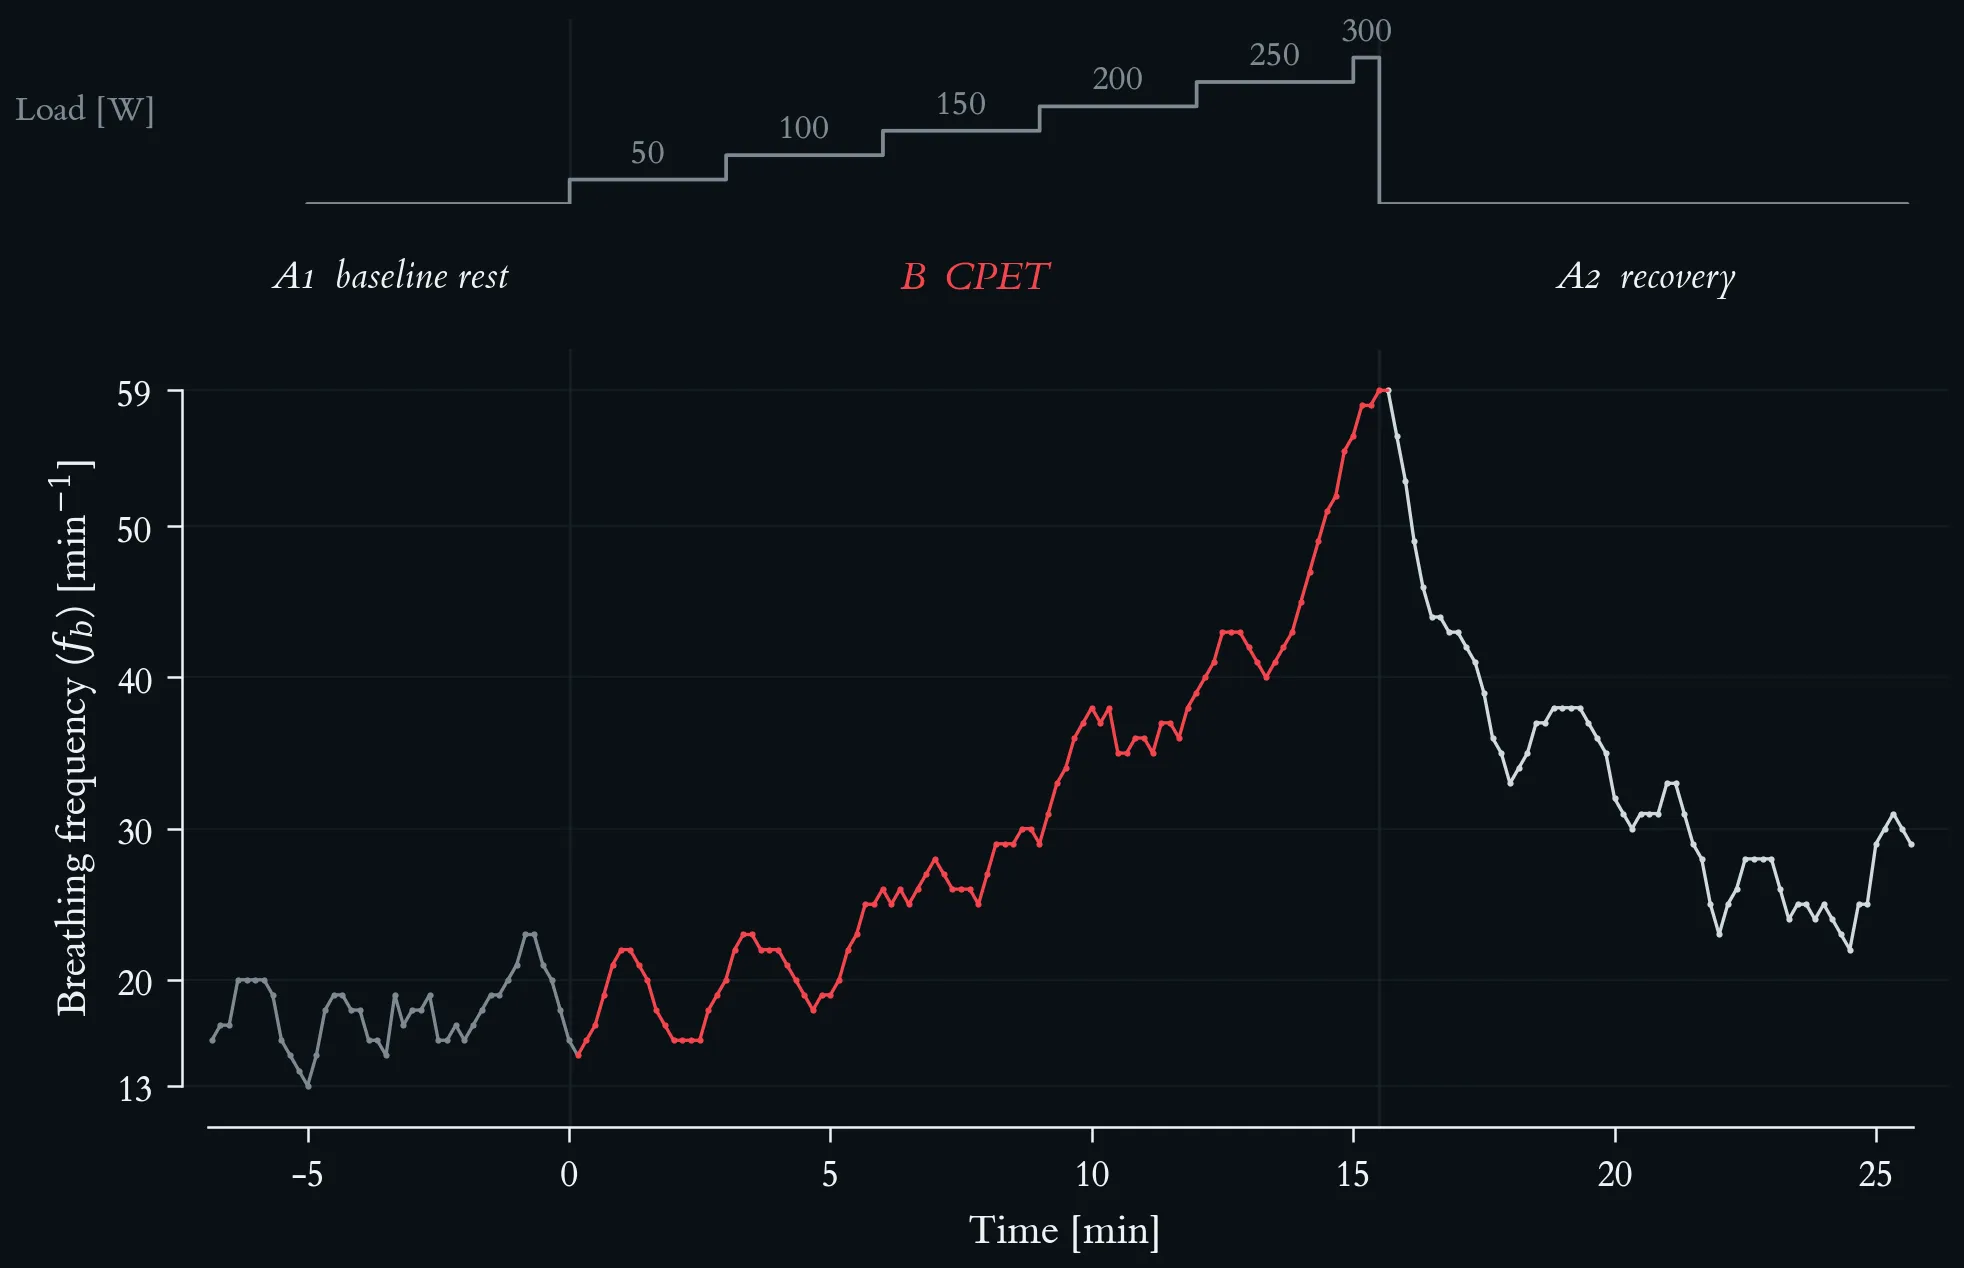
Breathing frequency across the maximal incremental step test. Top strip: external work rate. Lactate-based reference loads: aerobic threshold 117 W, individual anaerobic threshold 145 W. Phases are A1 baseline rest, B step test (red) and A2 passive recovery. Breathing frequency (fb) as 10-s averages from the metabolic cart, 196 samples.
Resting fb is about 18 min⁻¹ and varies between 13 and 23 min⁻¹ without a trend. End-of-stage values rise slowly through the first three stages (20 → 26 → 29 min⁻¹ at 50, 100 and 150 W) and then steeply: 39 min⁻¹ at 200 W, 56 min⁻¹ at 250 W and 59 min⁻¹ in the final stage, the peak of the test. Almost half of the total rise therefore occurs in the last two stages, above the individual anaerobic threshold. In recovery fb falls to about 30 min⁻¹ within three minutes and then stays well above the resting level for the remaining seven minutes. The steep late rise is the frequency component of the ventilatory response: tidal volume has stopped rising by the 250 W stage, so from there on ventilation is increased almost entirely by breathing faster.
Breathing frequency at the end of each stage of the maximal incremental step test.
| Load [W] | Time [min] | fb [min⁻¹] |
|---|---|---|
| rest (A1) | −6.8 – 0.0 | 16 (median 18) |
| 50 | 0.2 – 3.0 | 20 |
| 100 | 3.2 – 6.0 | 26 |
| 150 | 6.2 – 9.0 | 29 |
| 200 | 9.2 – 12.0 | 39 |
| 250 | 12.2 – 15.0 | 56 |
| 300 | 15.2 – 15.5 | 59 (peak) |
| recovery end (A2) | 25.7 | 29 |
Breathing frequency at the end of each stage of the maximal incremental step test.
3.3 Metabolic Response
- ATP demand increases — muscle contractions require rapid ATP regeneration.
- Substrate utilisation shifts — at low intensities fats dominate, at high intensities carbohydrates predominate.
- Lactate production increases — above the anaerobic threshold, net accumulation becomes significant.
- Hormone secretion increases — catecholamines, cortisol and glucagon mobilise energy substrates.
The shift in substrate utilisation can be read directly from gas exchange. The respiratory exchange ratio (RER = V̇CO₂/V̇O₂) approximates the respiratory quotient of the oxidised substrates: about 0.7 for pure fat oxidation, 1.0 for pure carbohydrate oxidation, and — above 1.0 — the signature of non-metabolic CO₂ released by bicarbonate buffering of accumulating lactate.
Mass-related oxygen uptake and respiratory exchange ratio across the maximal incremental step test. Lactate-based reference loads: aerobic threshold 117 W, individual anaerobic threshold 145 W. Both series are 10-s averages, 196 samples. (A) V̇O₂ per body mass (69 kg) in ml·min⁻¹·kg⁻¹, rising from 2.8 at rest to a peak of 40.7 in the first recovery sample. (B) Respiratory exchange ratio, with a hairline at 1.00.
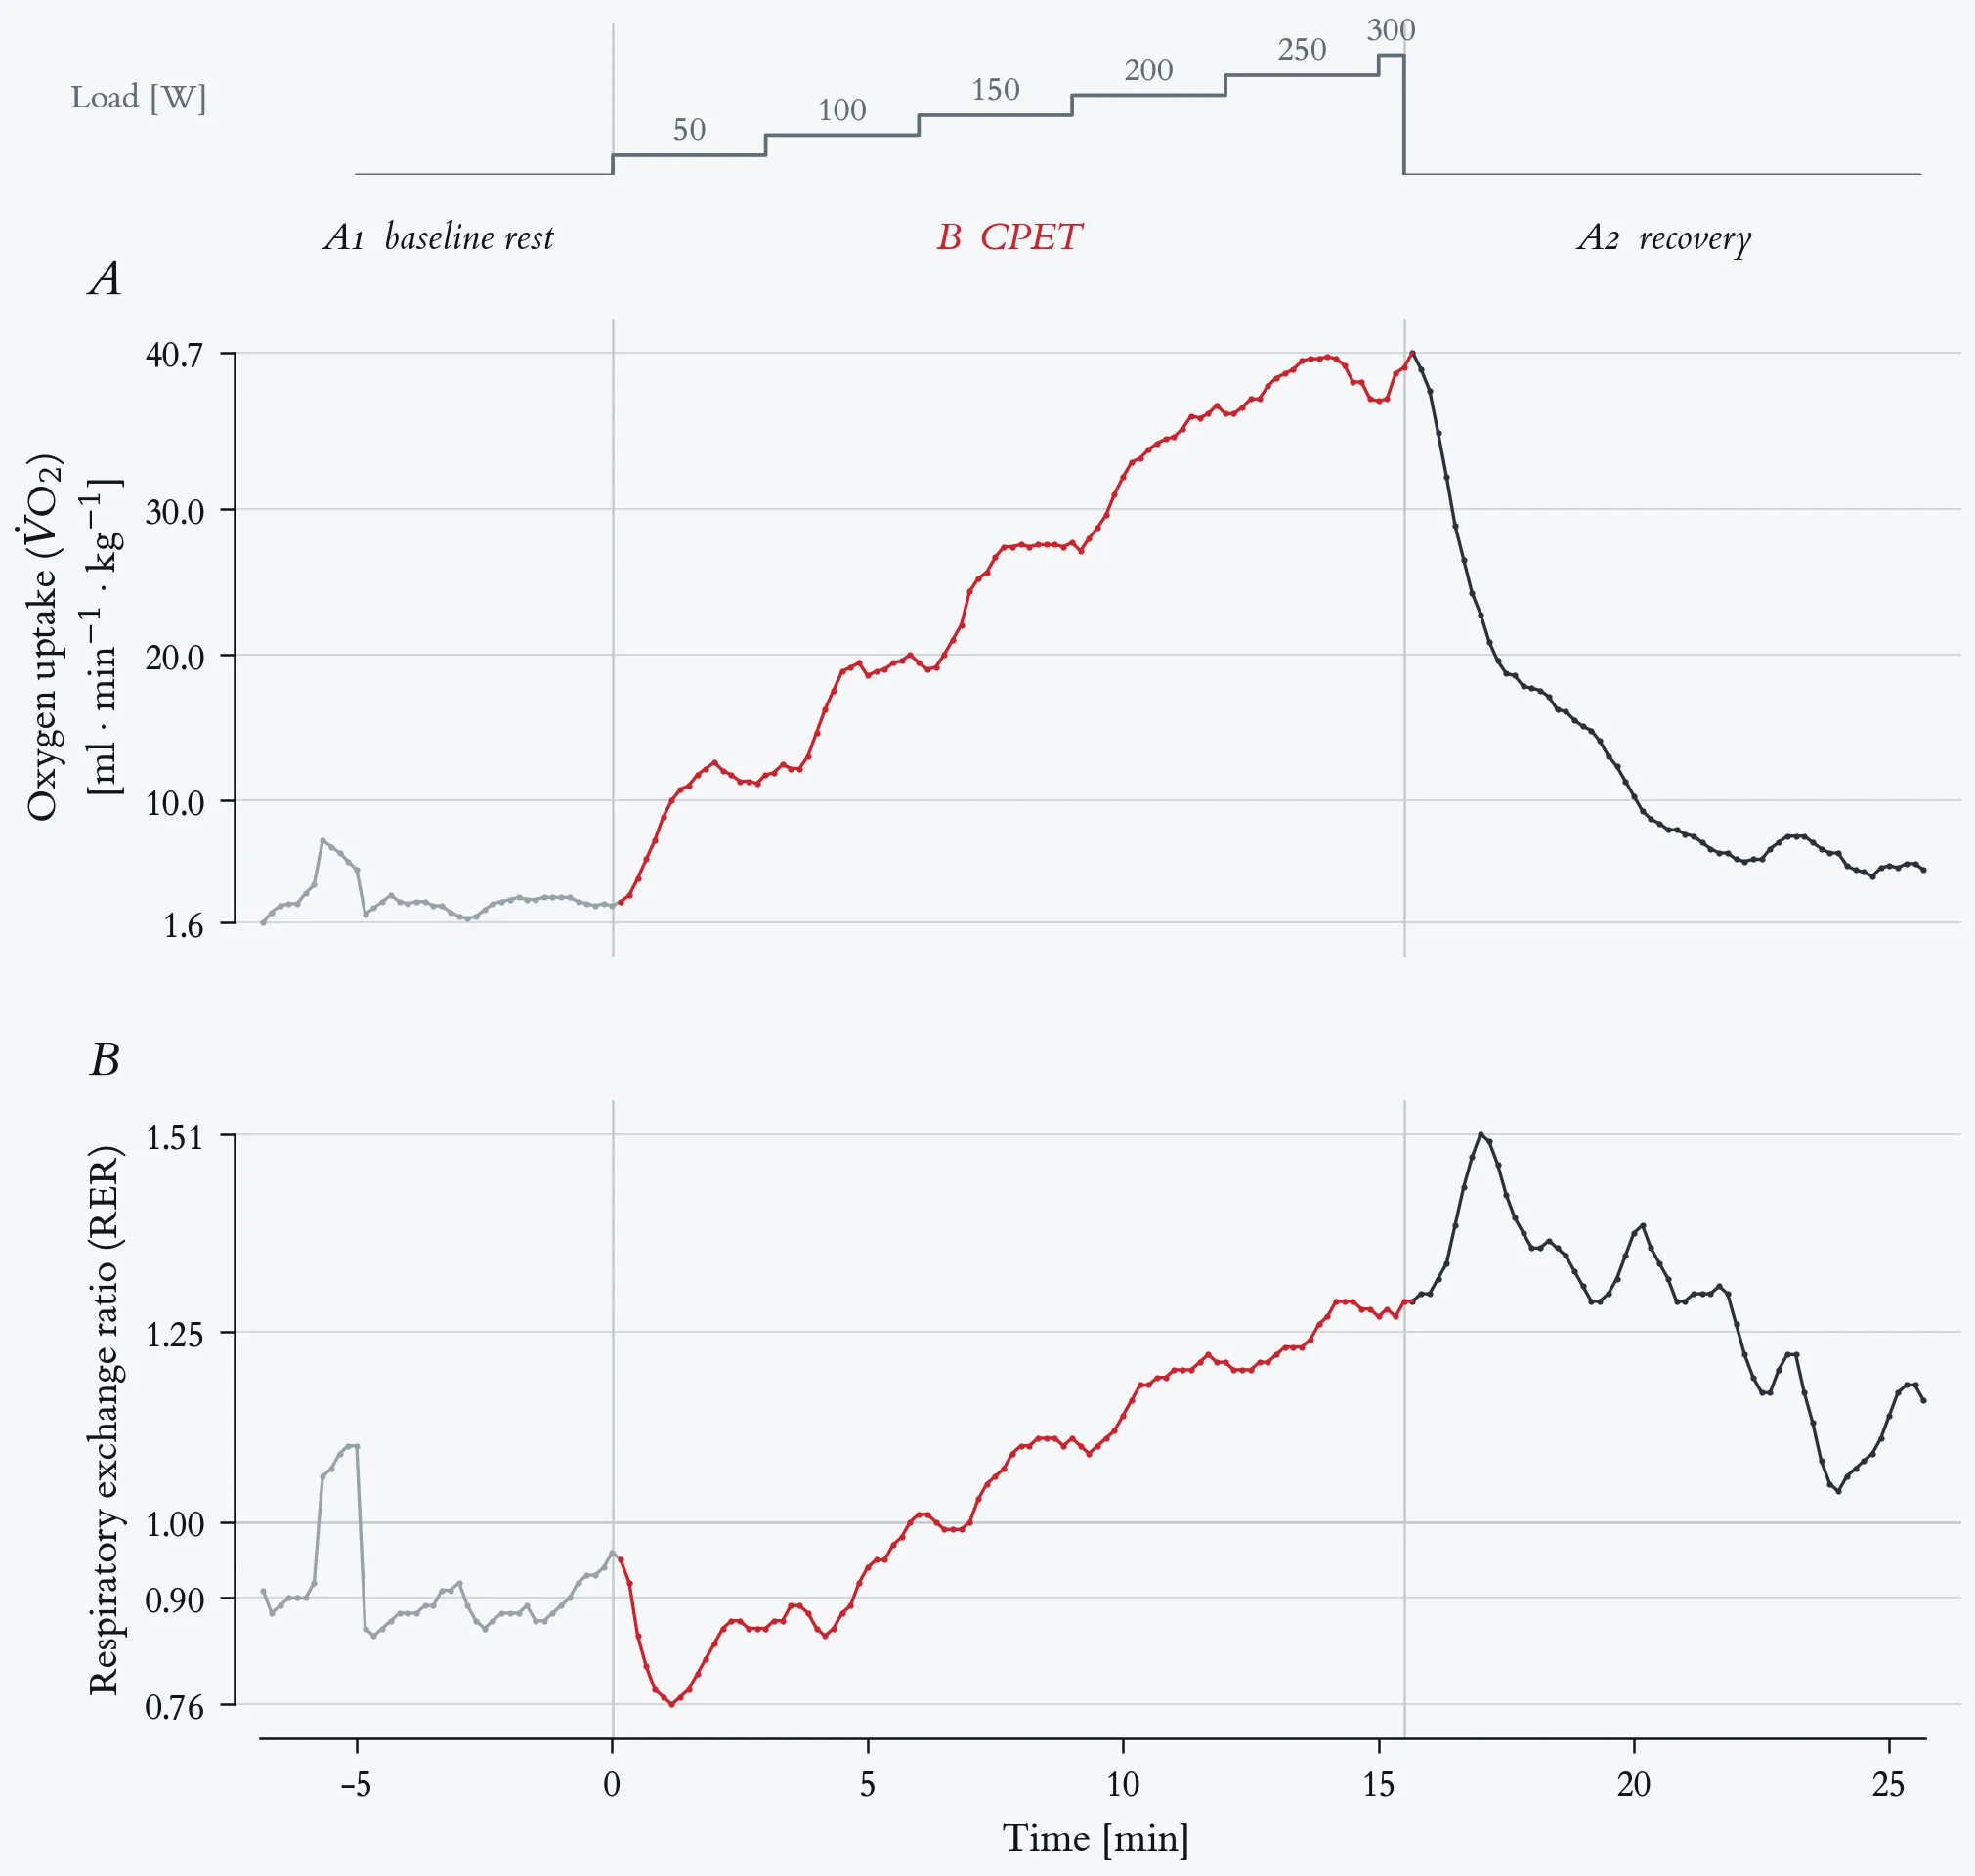
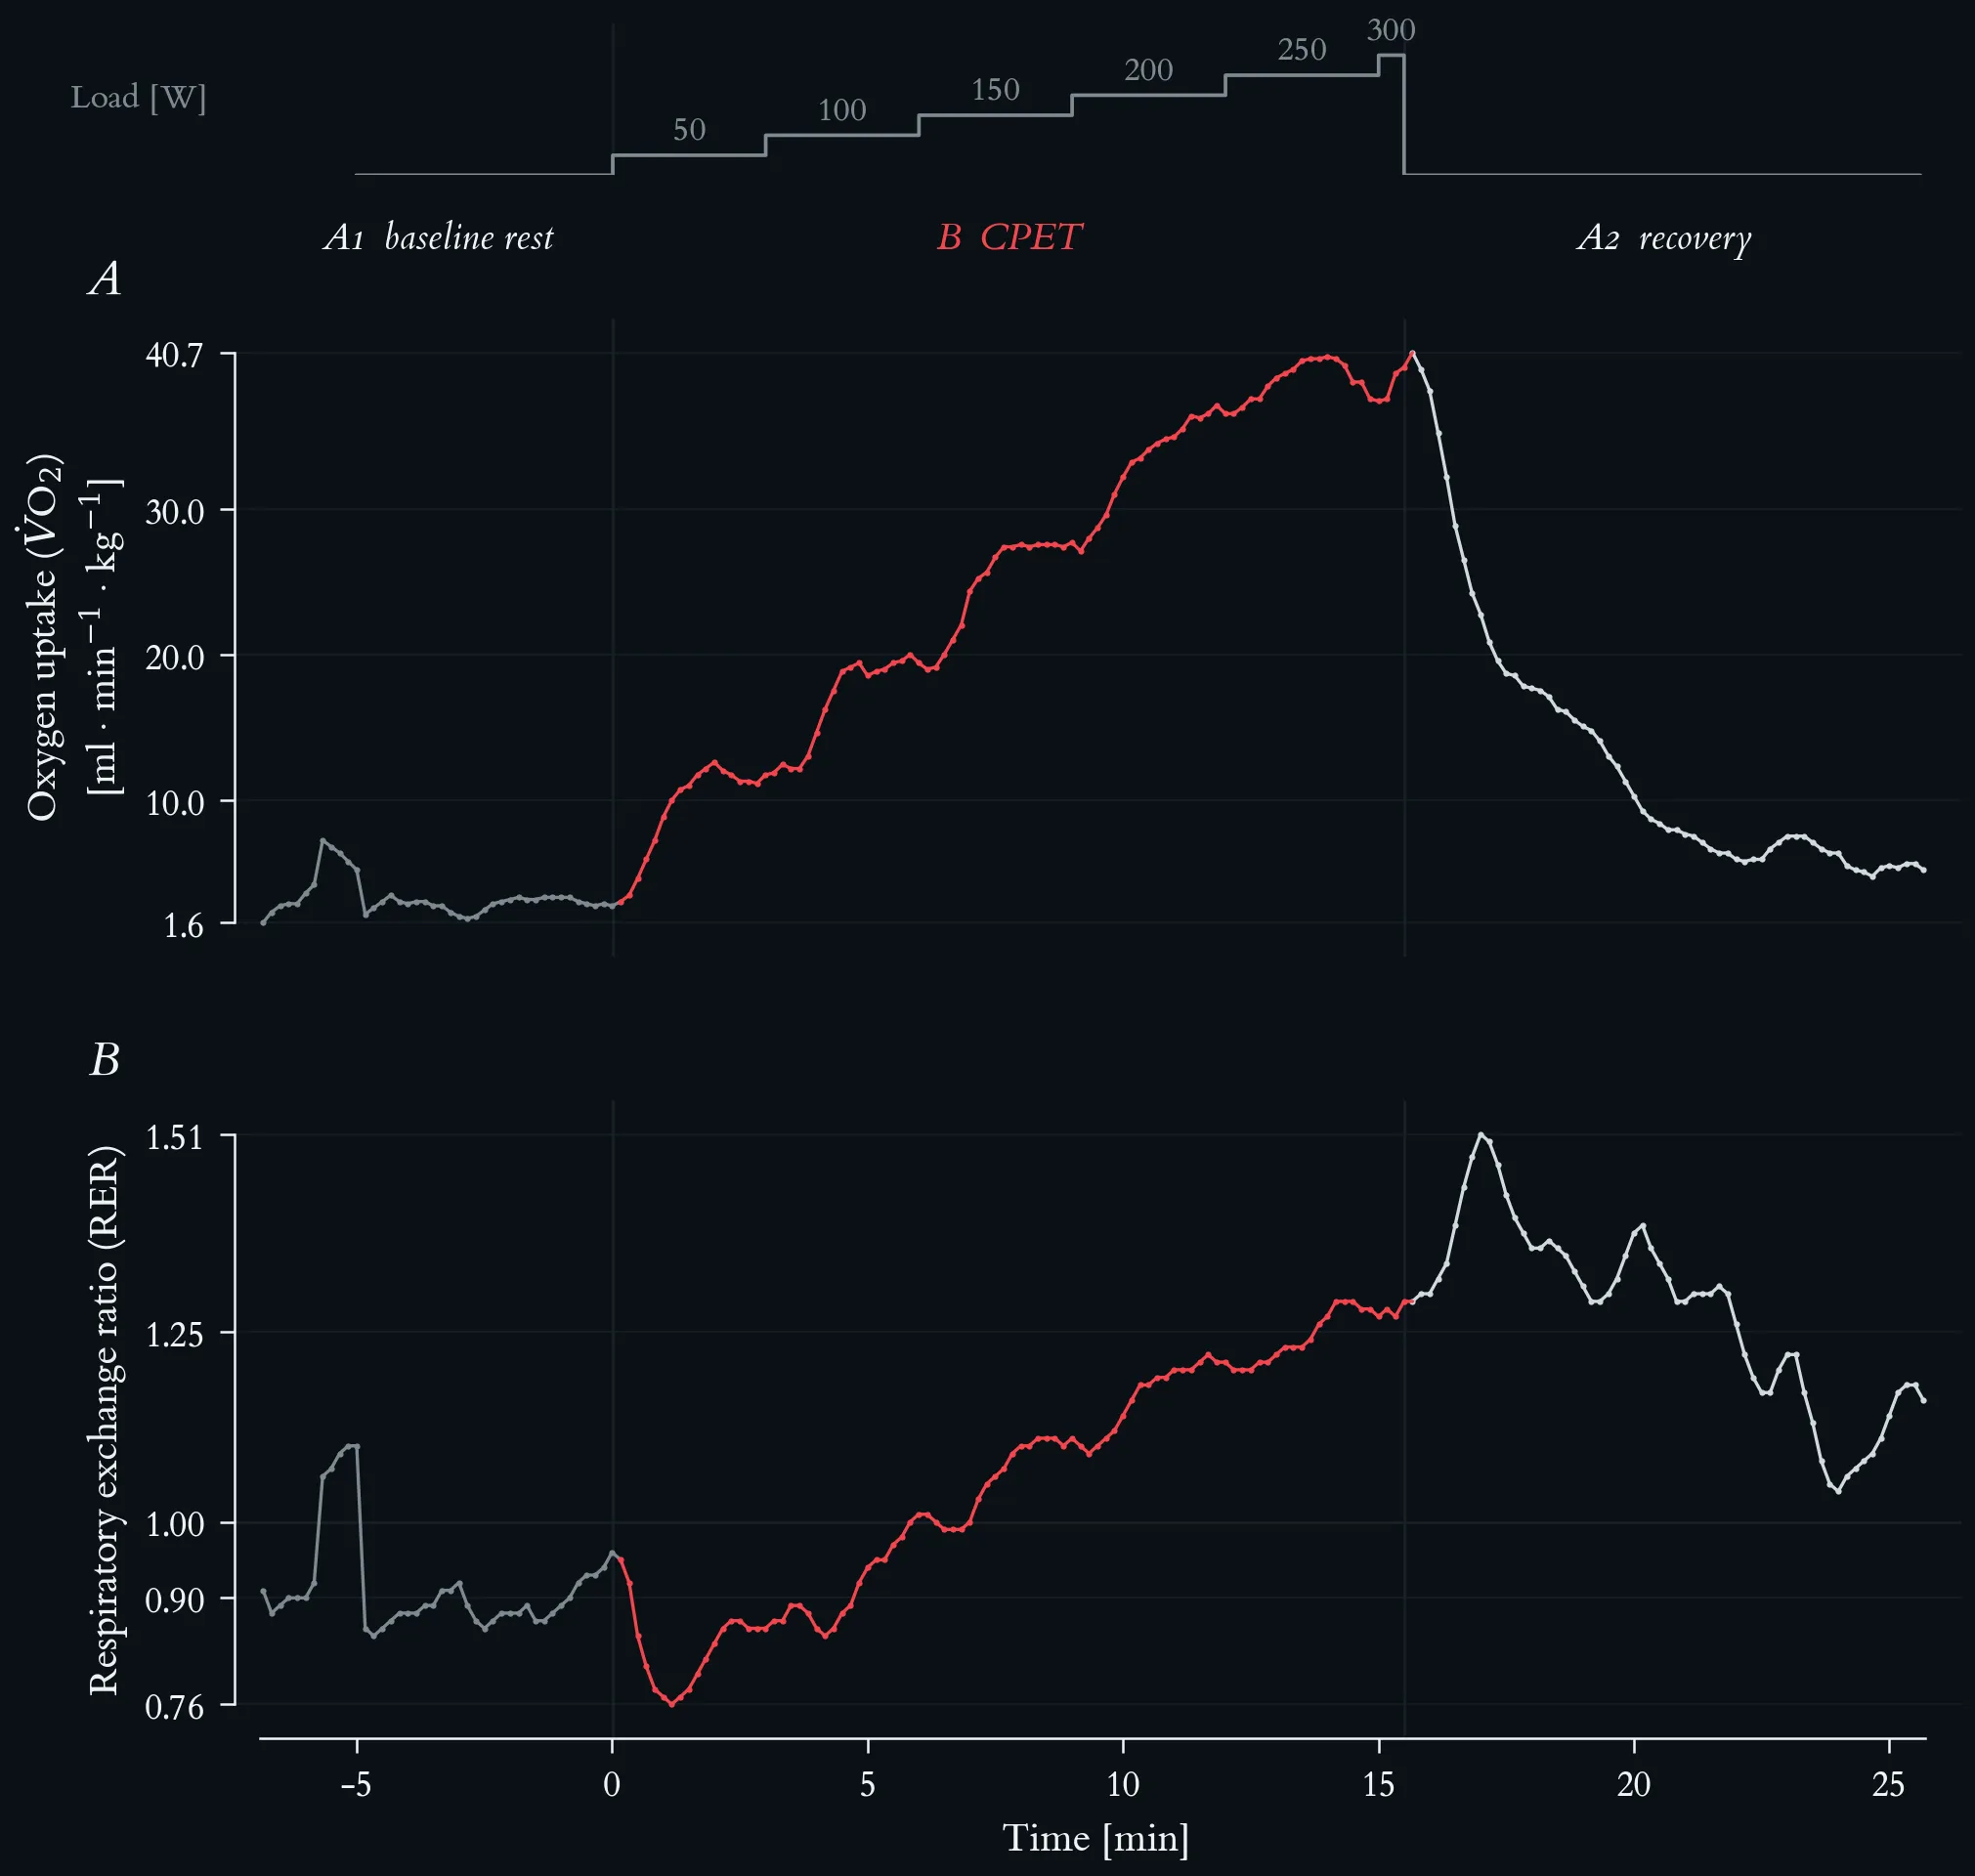
Mass-related oxygen uptake and respiratory exchange ratio across the maximal incremental step test. Lactate-based reference loads: aerobic threshold 117 W, individual anaerobic threshold 145 W. Both series are 10-s averages, 196 samples. (A) V̇O₂ per body mass (69 kg) in ml·min⁻¹·kg⁻¹, rising from 2.8 at rest to a peak of 40.7 in the first recovery sample. (B) Respiratory exchange ratio, with a hairline at 1.00.
RER sits near 0.89 at rest, drops to 0.76 in the first minute of loading — the usual lag of CO₂ output behind O₂ uptake at exercise onset — and then rises steadily. It crosses 1.00 at 5.8 min, inside the 100 W stage, at a V̇O₂ of 20.0 ml·min⁻¹·kg⁻¹, that is at about half of the peak value. At the end of the test RER reaches 1.29, so the exhaustion criterion of RER ≥ 1.15 is clearly met. The highest value of the whole recording, 1.51, falls at 17.0 min in recovery, when bicarbonate buffering of the accumulated lactate continues to release CO₂ while oxygen uptake has already fallen; RER stays above 1.0 for the entire ten minutes of recovery.
Mass-related oxygen uptake and respiratory exchange ratio at the end of each stage of the maximal incremental step test.
| Load [W] | Time [min] | V̇O₂ [ml·min⁻¹·kg⁻¹] | RER |
|---|---|---|---|
| rest (A1) | −6.8 – 0.0 | 2.8 | 0.96 (median 0.89) |
| 50 | 0.2 – 3.0 | 11.7 | 0.86 |
| 100 | 3.2 – 6.0 | 19.4 | 1.01 |
| 150 | 6.2 – 9.0 | 27.7 | 1.11 |
| 200 | 9.2 – 12.0 | 36.5 | 1.21 |
| 250 | 12.2 – 15.0 | 37.4 | 1.27 |
| 300 | 15.2 – 15.5 | 39.7 | 1.29 |
| peak (A2) | 15.7 / 17.0 | 40.7 | 1.51 |
Mass-related oxygen uptake and respiratory exchange ratio at the end of each stage of the maximal incremental step test.
3.4 Temperature Regulation
- Core body temperature rises through metabolic heat production.
- Sweating increases — the primary mechanism of heat dissipation during exercise.
- Skin blood flow increases — facilitating heat loss to the environment.
Thermoregulation is the one arm of the acute response that the standard laboratory set-up does not record, which is precisely why it is named here: the variables in Figures 1–4 do not exhaust the disturbance, and a test report that treats them as if they did has quietly dropped a regulated variable.
4 The Biphasic Dose–Response
Hormetic responses are biphasic: a low to moderate dose of the stressor produces a beneficial adaptive response, while a high dose produces impairment. Applied to exercise and immune function, this yields the familiar J-shaped relationship — moderate regular activity associated with better immune competence than inactivity, very high acute or accumulated loads associated with transient impairment. The J-curve is a heuristic, not a law; its position and steepness depend on training status, recovery, sleep and nutrition, and it is a frame for asking questions rather than a prediction.
The molecular mediators of this response are the same molecules that mediate damage in other contexts. Inflammatory mediators have a dual identity: the cytokine that signals adaptation after a training session is the cytokine that signals pathology when it is chronically elevated. Concentration, kinetics and context — not identity — determine which reading applies.
5 The Clinical Edge
Post-acute infection syndromes are where the hormetic frame breaks down. In ME/CFS, in Long COVID, and in post-exertional malaise more generally, an exercise stimulus that would be adaptive in a healthy person produces a delayed, disproportionate and prolonged symptom exacerbation. In such states the ordinary logic of progressive overload does not hold, and prescription based on percentage-of-threshold zones can be actively harmful. The practical consequence is a diagnostic one: the first question in a post-infectious consultation is not “which zone?” but “is exertion currently a tolerable stimulus at all?” Lecture 12 returns to this with a concrete case and a structured return-to-sport decision.
Sleep sits alongside recovery in this frame as the second regulator of the adaptive response. The architecture of NREM and REM sleep, cycle structure, duration, and the bidirectional relationship between exercise and sleep are covered in the companion page and set as preparatory reading. Sleep enters the interpretation primarily as a covariate, and must be documented whenever immune markers are interpreted.
One-Minute-Paper Topics
A One-Minute-Paper (OMP) is a short, focused prompt that students answer in ~60 seconds at the end of a session to consolidate learning, surface misconceptions, and provide formative feedback. When answering, be concise, specific, and use terminology from today’s session.
- Give one measured variable from the cohort dataset that answers a homeostatic question and one that would answer a hormetic question.
- Why does an ABA design require more than one post-load time point?
- V̇O₂ and V̇E peak at different points of the test. Explain both the timing and the divergence above 200 W.
- Why does the classic 0.15–0.40 Hz high-frequency band fail from the 150 W stage onward, and what replaces it in Figure 2D?
- RER crosses 1.00 at about half of peak V̇O₂ and reaches its maximum in recovery. Explain each observation.
- Name the one arm of the acute response that Figures 1–4 do not record.
- Explain the dual identity of an inflammatory mediator using one concrete example.
- A patient with confirmed post-exertional malaise asks for a lactate test to set training zones. Draft a two-sentence answer.
References
- Haunhorst S, Bloch W, Drube S, Baumgart S, Pletz MW, Gabriel HHW, Puta C. Current return to sports recommendations after non-severe COVID-19 from an exercise immunology perspective: a scoping review. Sports Orthop Traumatol 39 (4), 2023: 378–388.
- Puta C. Basics in exercise physiology and immunology — key concepts, homeostasis and hormesis. Exercise Physiology lecture series. Available from: https://chrisputa.github.io/exercise_physiology/lectures/lecture-1/
- Steidten T, Baumbach P, May R, Gabriel B, Herbsleb M, Markov A, Granacher U, Kellmann M, Bloch W, Gabriel HHW, Puta C. Overnight immune regulation and subjective measures of sleep: a three night observational study in adolescent track and field athletes. Front Sports Act Living 3, 2021: 689805. doi:10.3389/fspor.2021.689805.