Figure Index
Every figure from every lecture, with its caption, in lecture order.
1 figures from 1 lectures.
Lecture 1: Upper Respiratory Tract Infections and Physical Activity
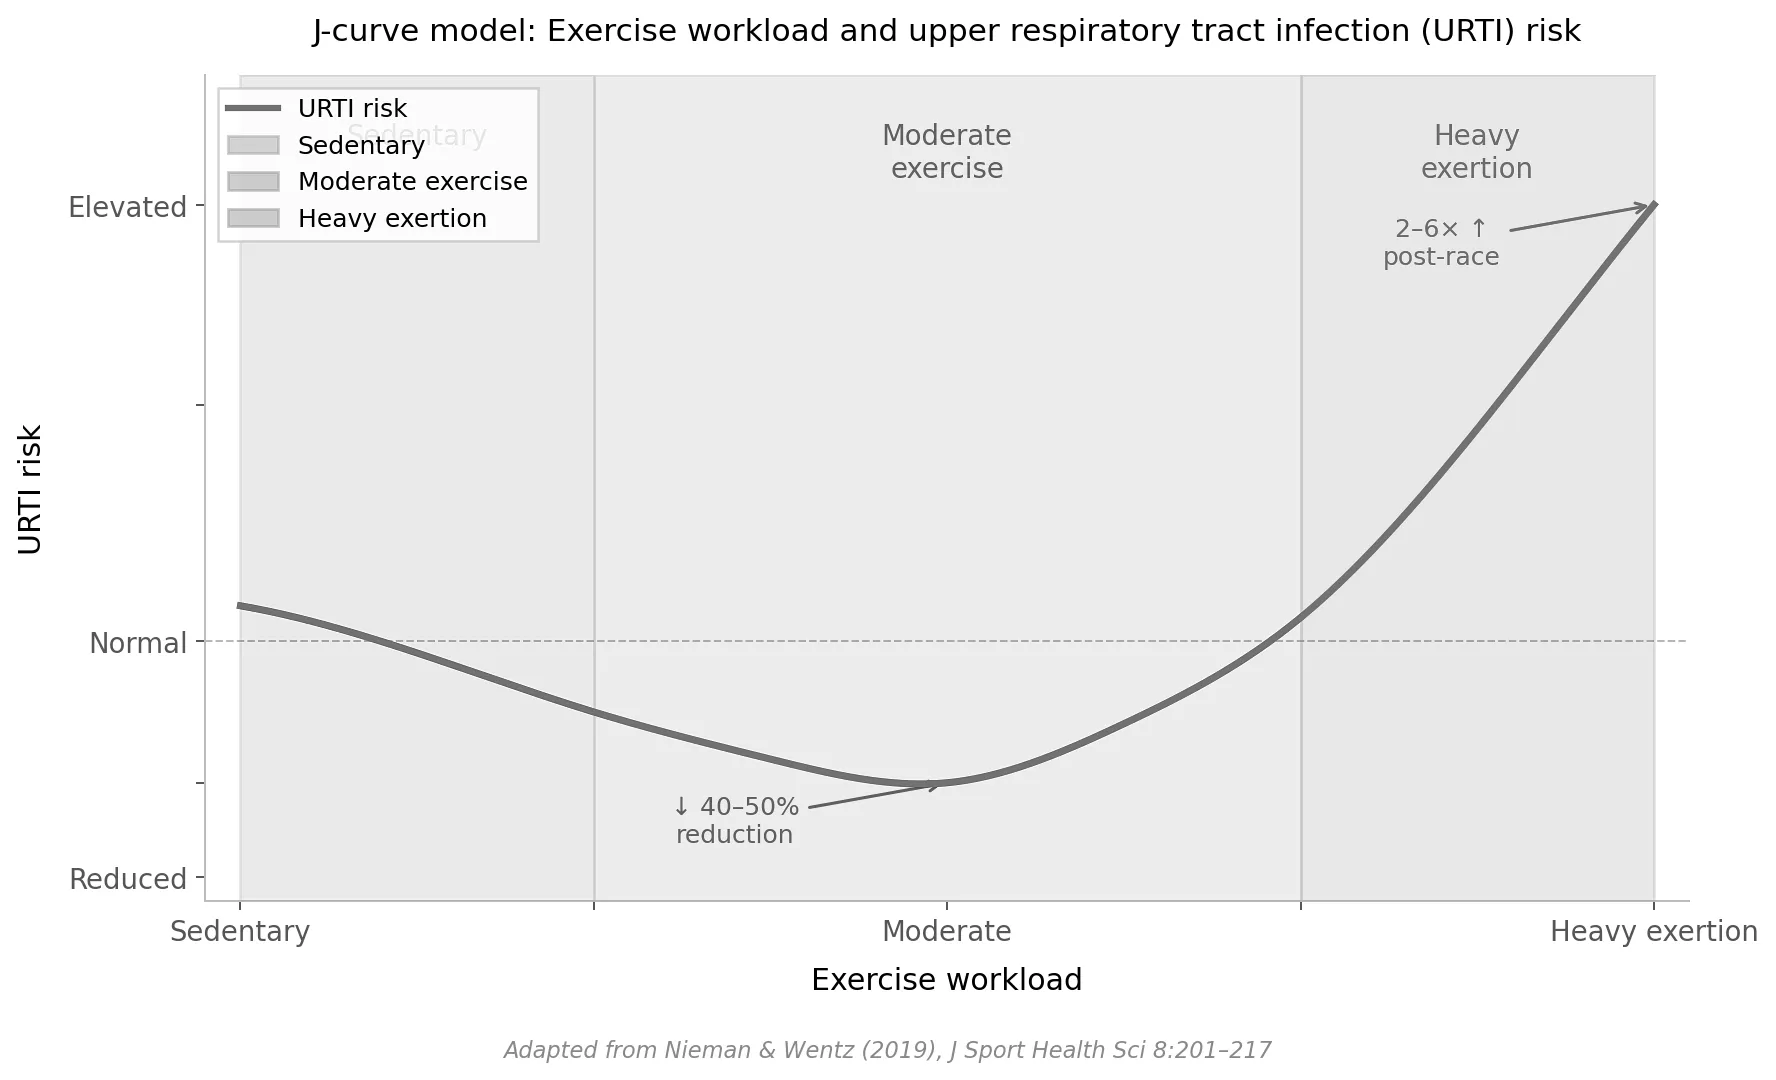
The curve follows the shape described in Nieman & Wentz (2019): URTI risk is reduced ~40–50% in the moderate exercise zone compared to sedentary individuals, then rises sharply with heavy exertion to 2–6× above normal — matching the values cited in the paper for post-race illness incidence.
The curve follows the shape described in Nieman & Wentz (2019): URTI risk is reduced ~40–50% in the moderate exercise zone compared to sedentary individuals, then rises sharply with heavy exertion to 2–6× above normal — matching the values cited in the paper for post-race illness incidence.