Figure Index
Every figure from every lecture, with its caption, in lecture order.
53 figures from 10 lectures.
Lecture 1: Basics in Exercise Physiology and Immunology - Key Concepts, Homeostasis and Hormesis
Homeostasis refers to the dynamic equilibrium of the internal environment, maintained through regulatory mechanisms that counteract disturbances. Physical activity is a significant disturbance to homeostasis, triggering rapid regulatory responses.
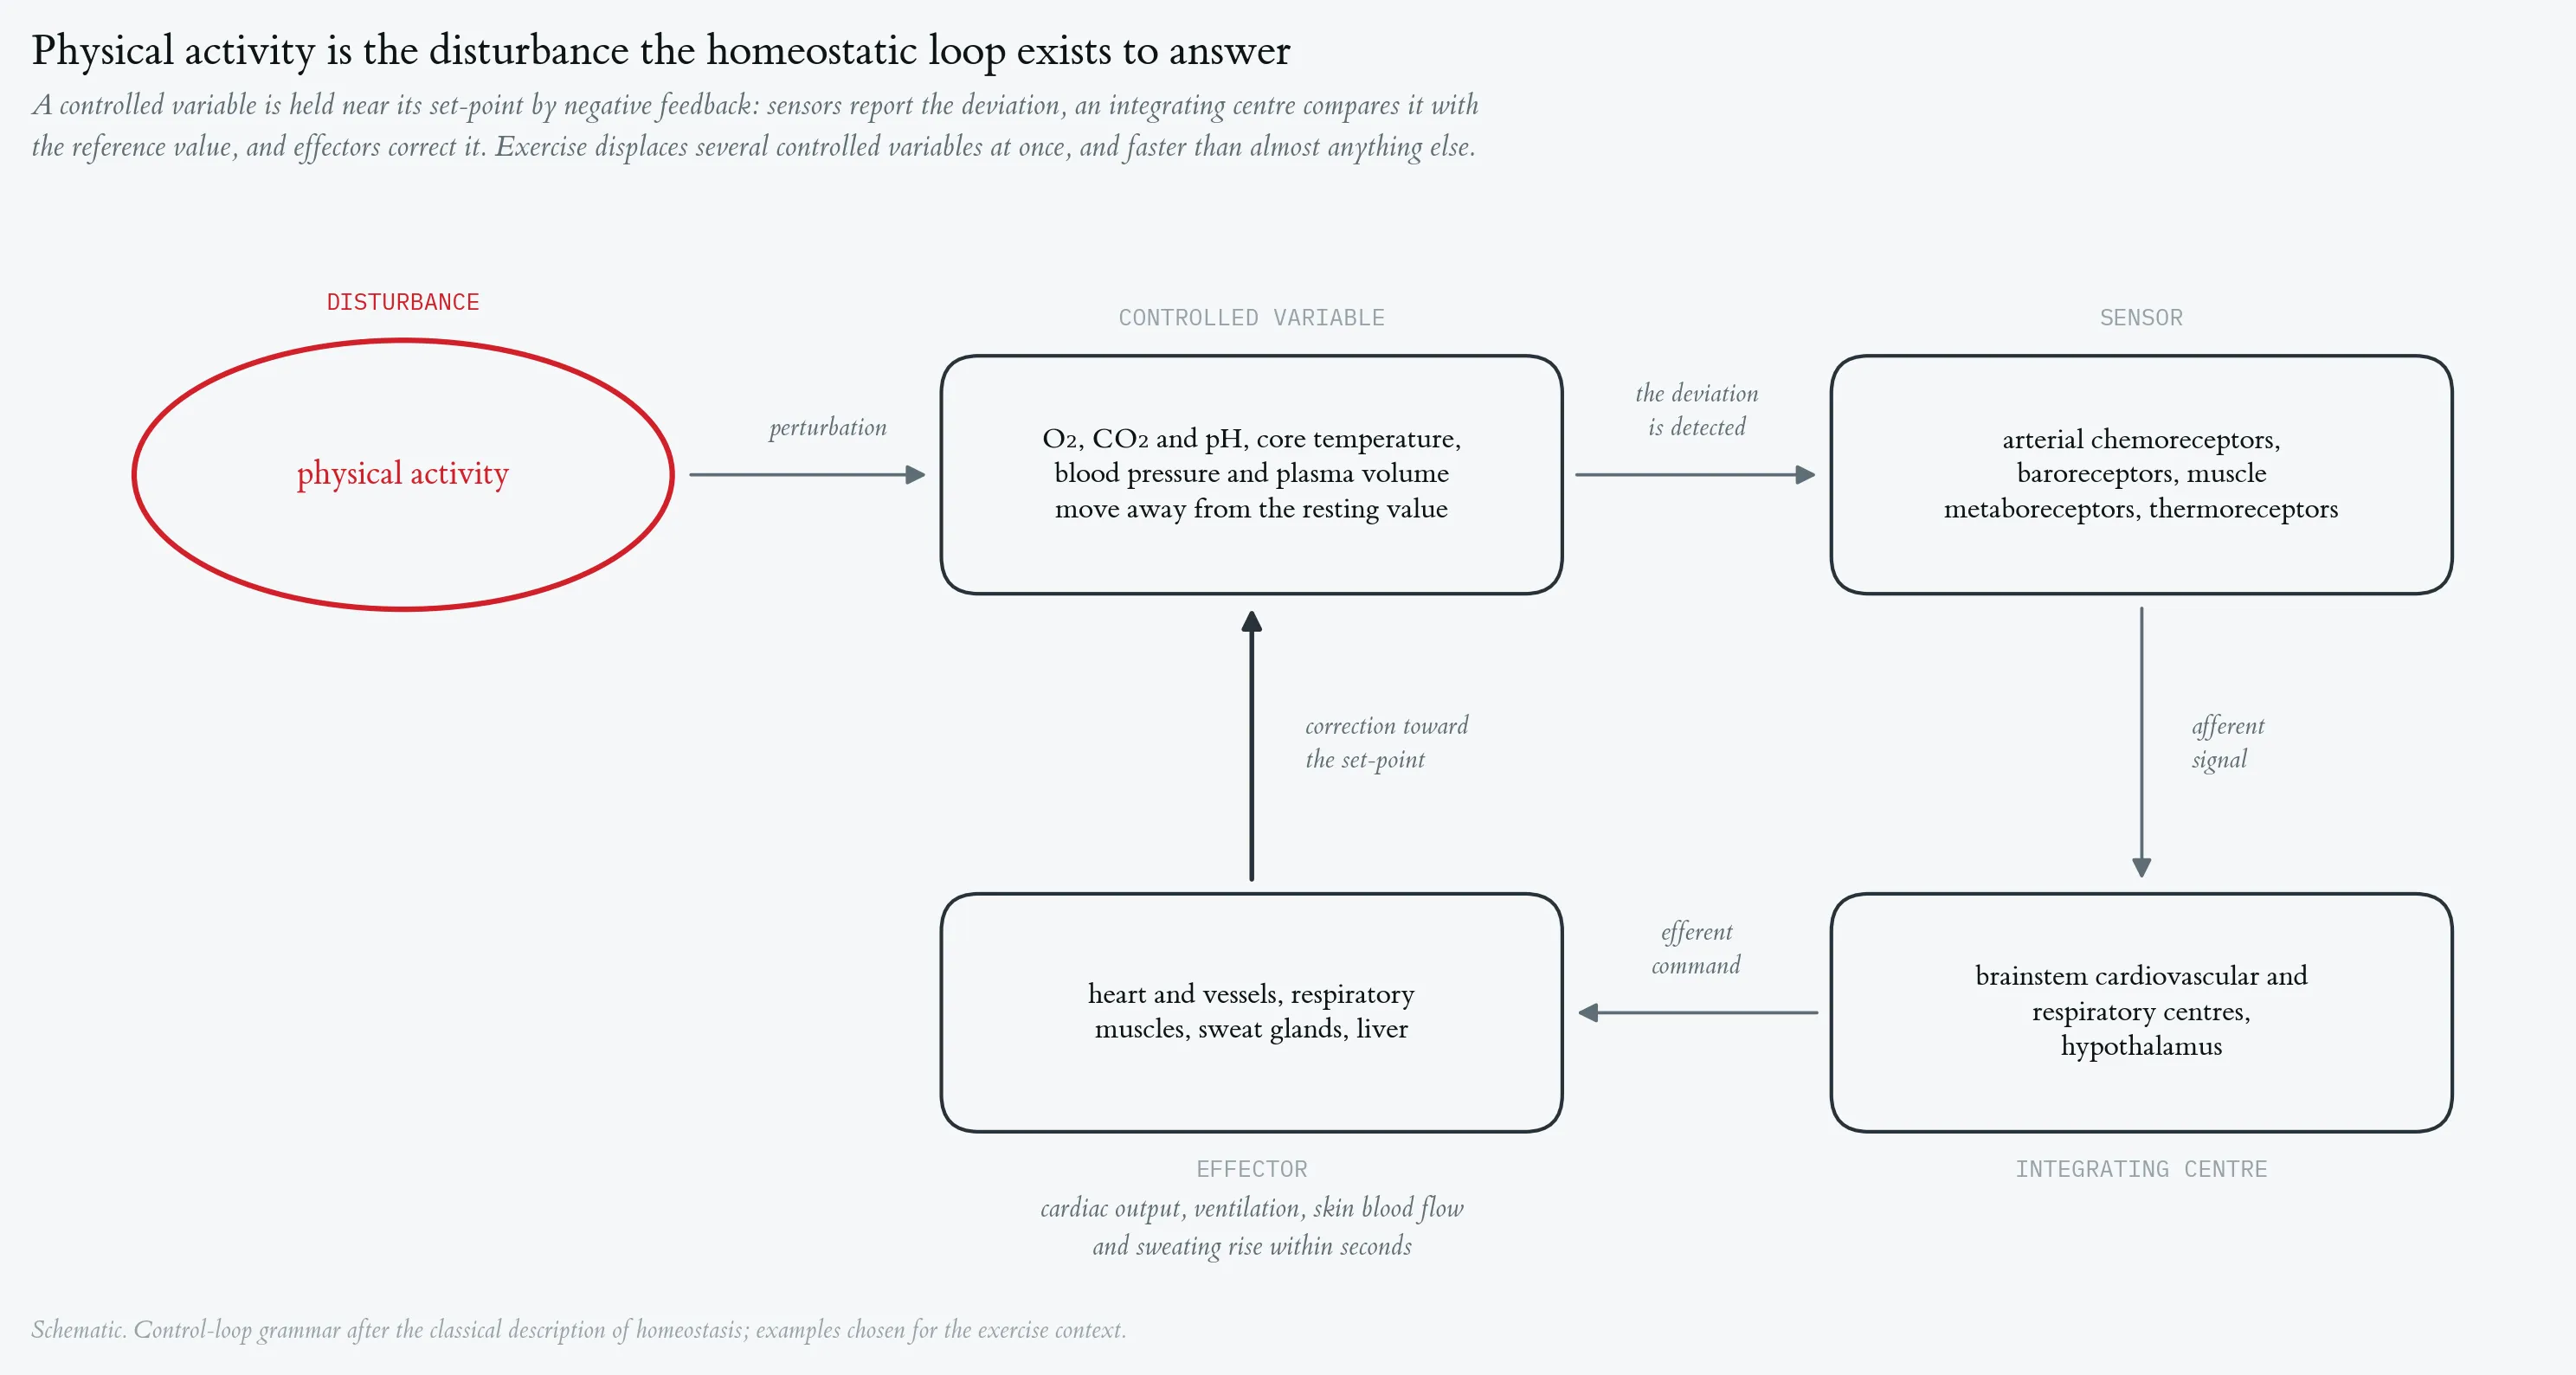

Homeostasis refers to the dynamic equilibrium of the internal environment, maintained through regulatory mechanisms that counteract disturbances. Physical activity is a significant disturbance to homeostasis, triggering rapid regulatory responses.
Cardiorespiratory response to a maximal incremental step test, with mass-related oxygen uptake. Top strip: external work rate, incremented by 50 W every three minutes from 50 W to a final 300 W stage terminated after 30 s at volitional exhaustion. Phases are A1 baseline rest, B step test (red) and A2 passive recovery; vertical hairlines mark the two transitions. (A) Heart rate, beat-to-beat recording averaged in 10-s bins, rising from 51 to 187 bpm. (B) Ventilation (V̇E), rising from about 6 l · min⁻¹ at rest to 122.8 l · min⁻¹ at the end of the final stage, with a peak of 127.8 l · min⁻¹ ten seconds after load offset. (C) Mass-related oxygen uptake, V̇O₂ per body mass (69 kg), in ml · min⁻¹ · kg⁻¹. All three series are 10-s averages (197 samples, recording started 6.8 min before load onset).
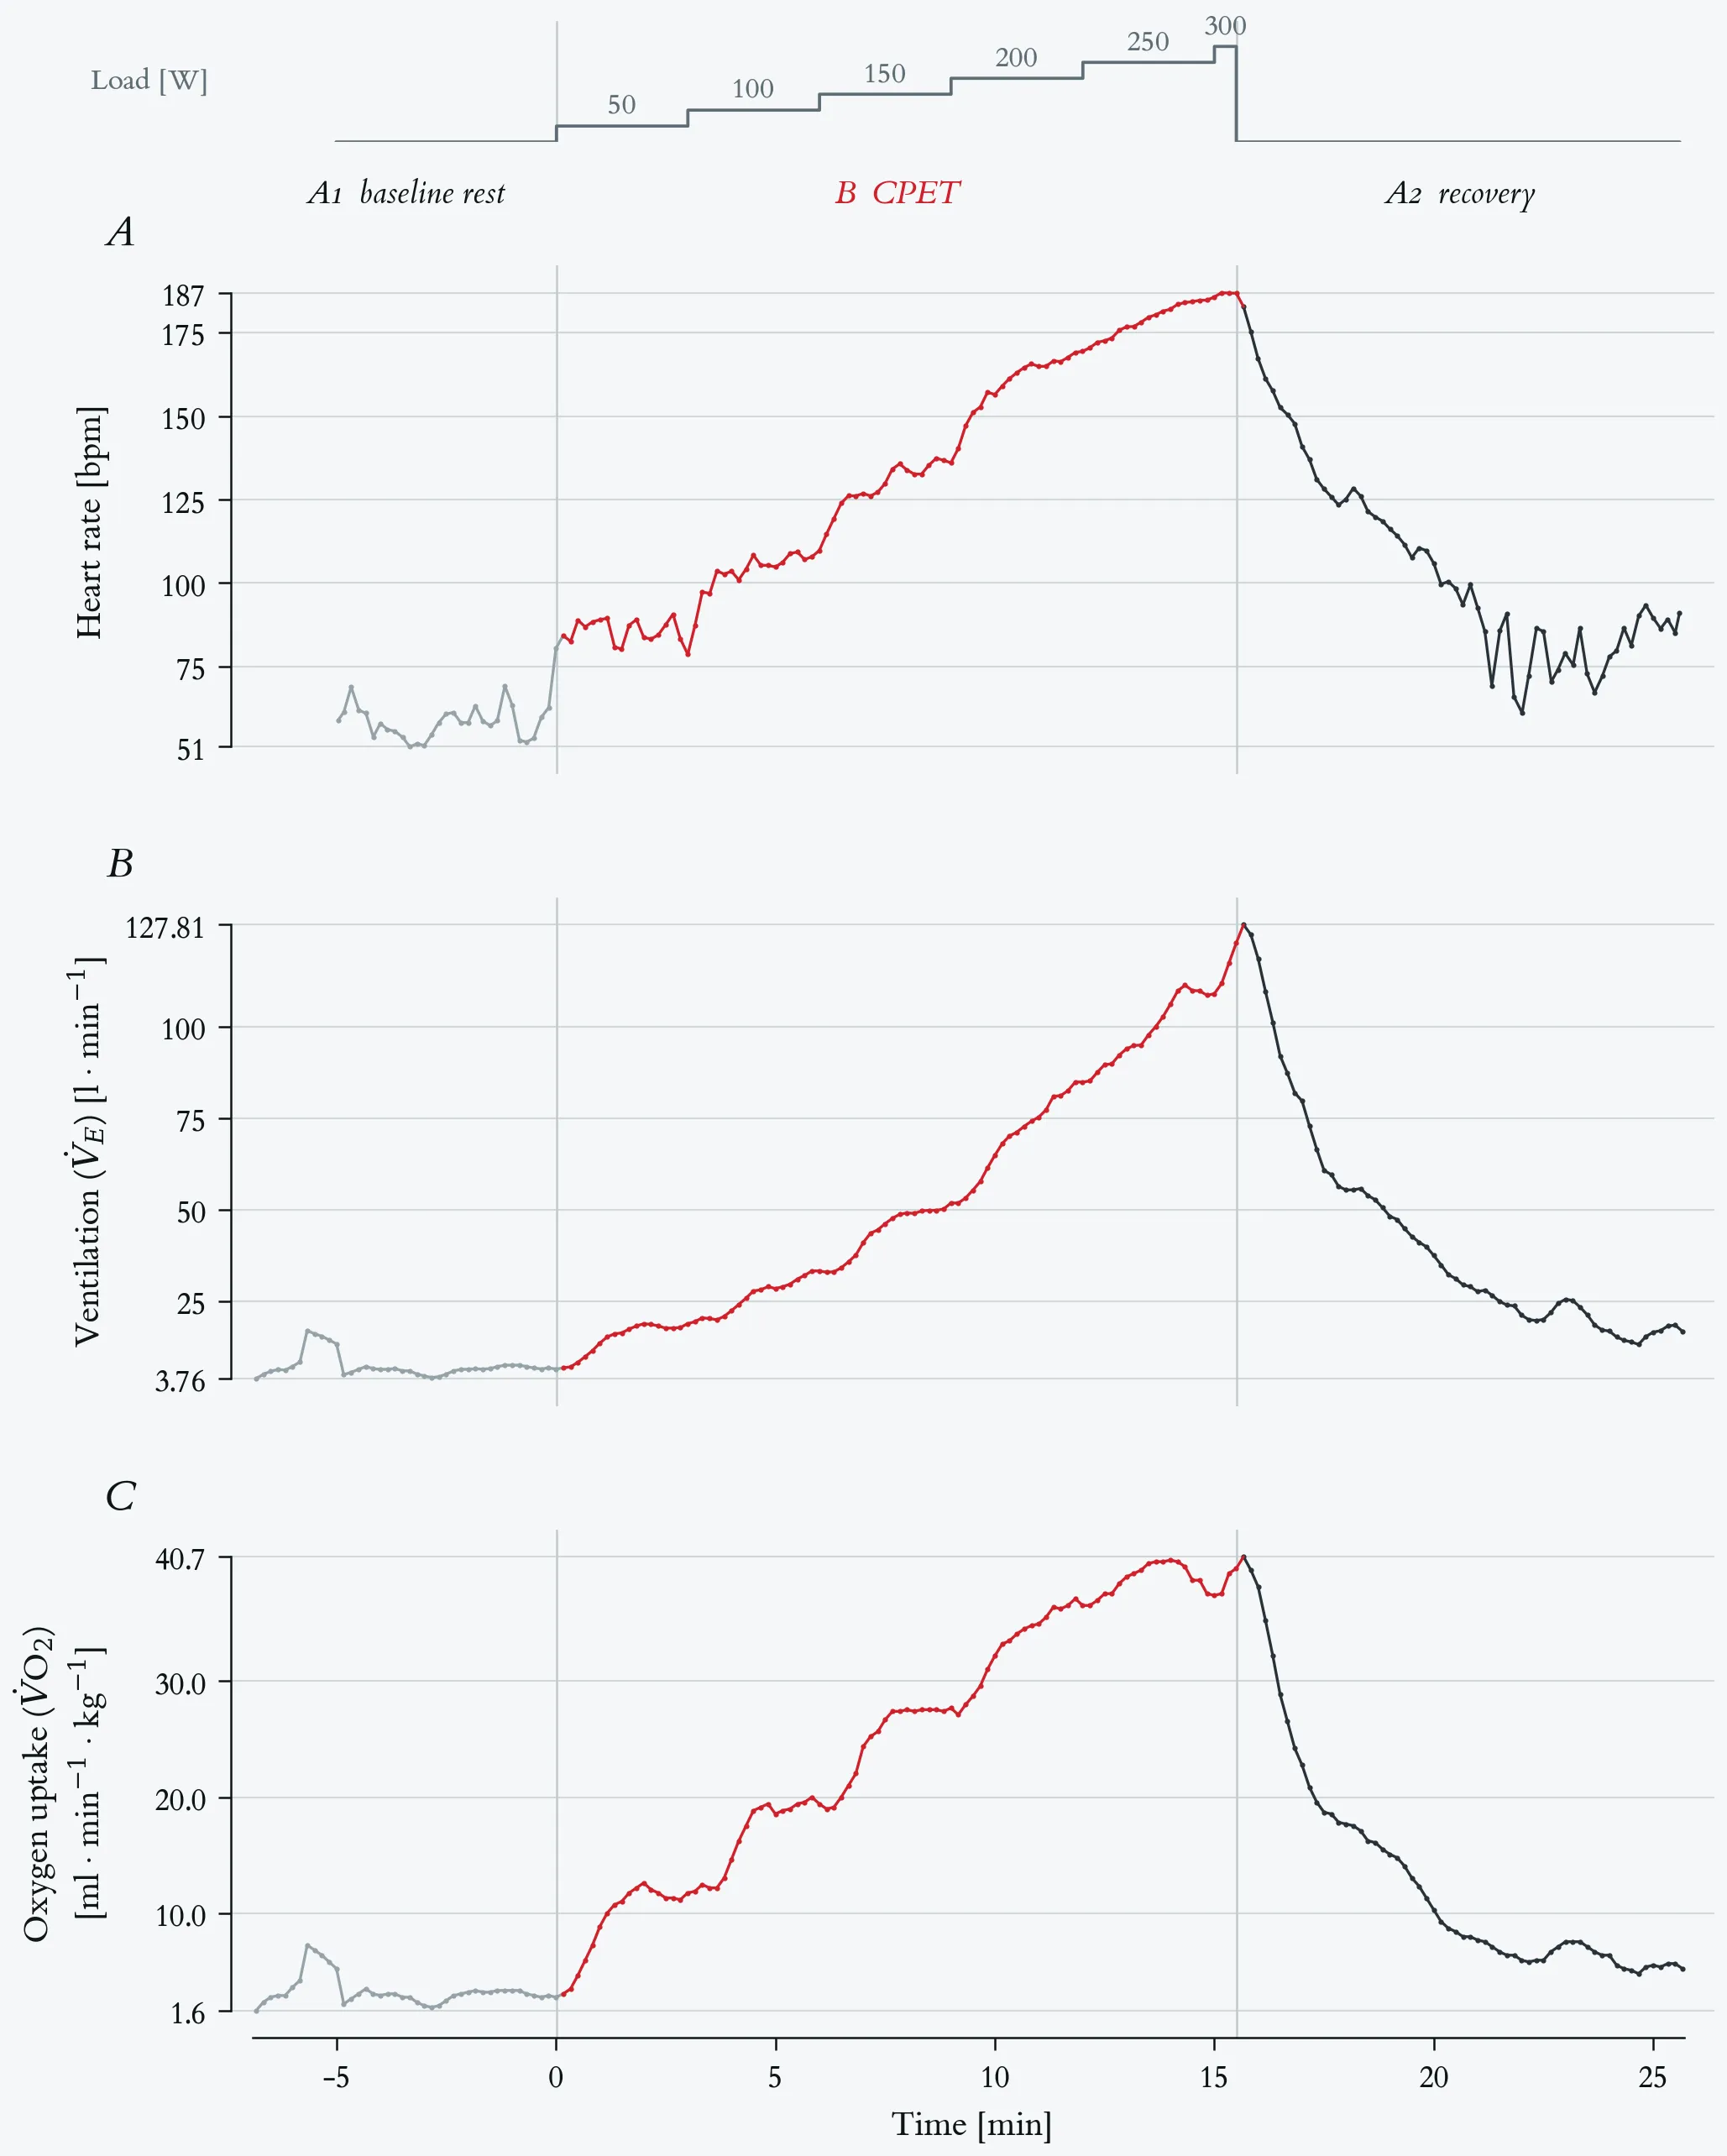
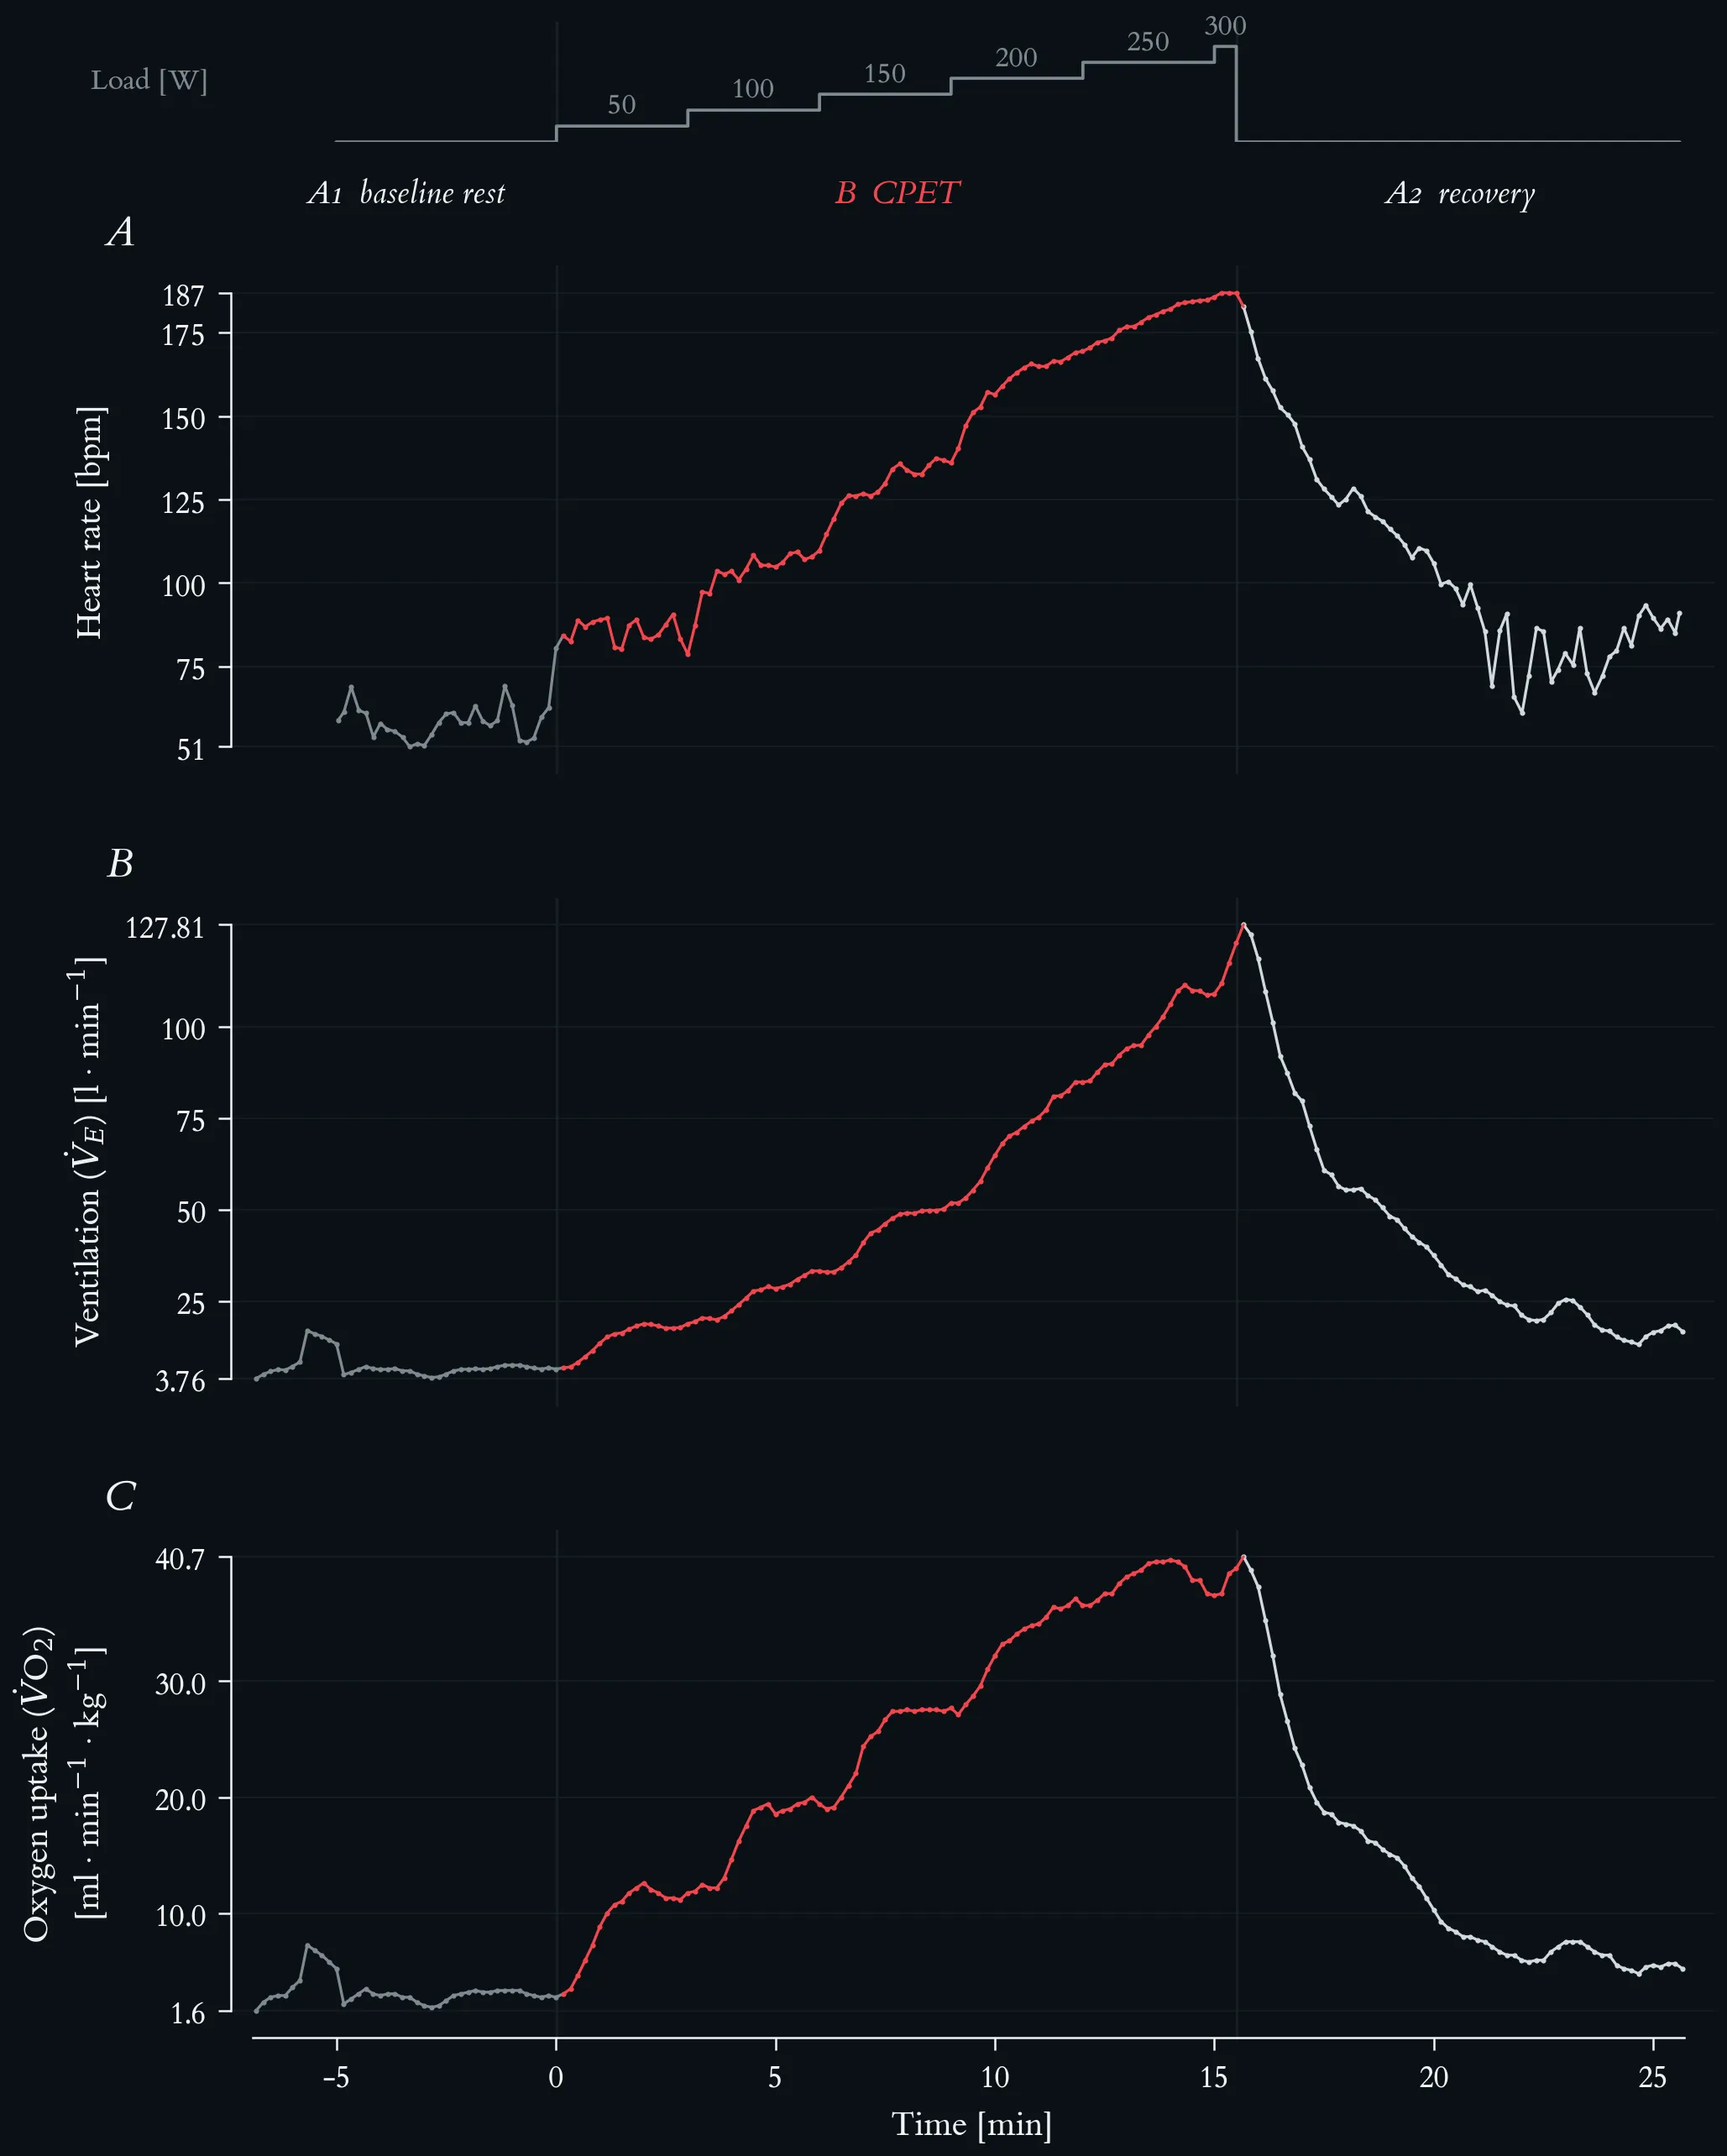
Cardiorespiratory response to a maximal incremental step test, with mass-related oxygen uptake. Top strip: external work rate, incremented by 50 W every three minutes from 50 W to a final 300 W stage terminated after 30 s at volitional exhaustion. Phases are A1 baseline rest, B step test (red) and A2 passive recovery; vertical hairlines mark the two transitions. (A) Heart rate, beat-to-beat recording averaged in 10-s bins, rising from 51 to 187 bpm. (B) Ventilation (V̇E), rising from about 6 l · min⁻¹ at rest to 122.8 l · min⁻¹ at the end of the final stage, with a peak of 127.8 l · min⁻¹ ten seconds after load offset. (C) Mass-related oxygen uptake, V̇O₂ per body mass (69 kg), in ml · min⁻¹ · kg⁻¹. All three series are 10-s averages (197 samples, recording started 6.8 min before load onset).
Beat-to-beat cardiac autonomic response across the ABA exercise protocol. Top strip: external work rate, stepped by 50 W every three minutes from 50 to 300 W. Phases are A1 baseline rest (5.0 min, 293 beats), B CPET (15.5 min, 2059 beats, red), and A2 recovery (10.1 min, 1070 beats); vertical hairlines mark the two transitions. (A) Beat-to-beat RR interval (n = 3422 beats). Mean RR falls from 1029 ms at rest to 452 ms under load and reaches its minimum of 316 ms at exhaustion. (B) Heart rate, the same recording averaged in 10-s bins, rising from 51 to 187 bpm. (C) Successive RR differences (ΔRR), the beat-to-beat change that panel A carries only implicitly. The scatter collapses from ±330 ms at rest to a near-flat band during the ramp — root mean square of successive differences 102 ms in A1, 16.9 ms across B, and 2.6 ms over the final five minutes of loading — and the large excursions return within the first minutes of A2, where isolated beats again differ by more than 300 ms. (D) RSA amplitude: the RMS of the RR oscillation inside a respiration-guided band, f_R ± 0.125 Hz, with f_R taken from the concurrent measured breathing frequency; 60-s windows stepped by 5 s, logarithmic axis. Because breathing frequency rises from 0.22 to 0.98 Hz over this test, the classic high-frequency band (0.15–0.40 Hz) would miss the respiratory peak from the 150 W stage onward and underestimate it by a factor of five at 250 W.
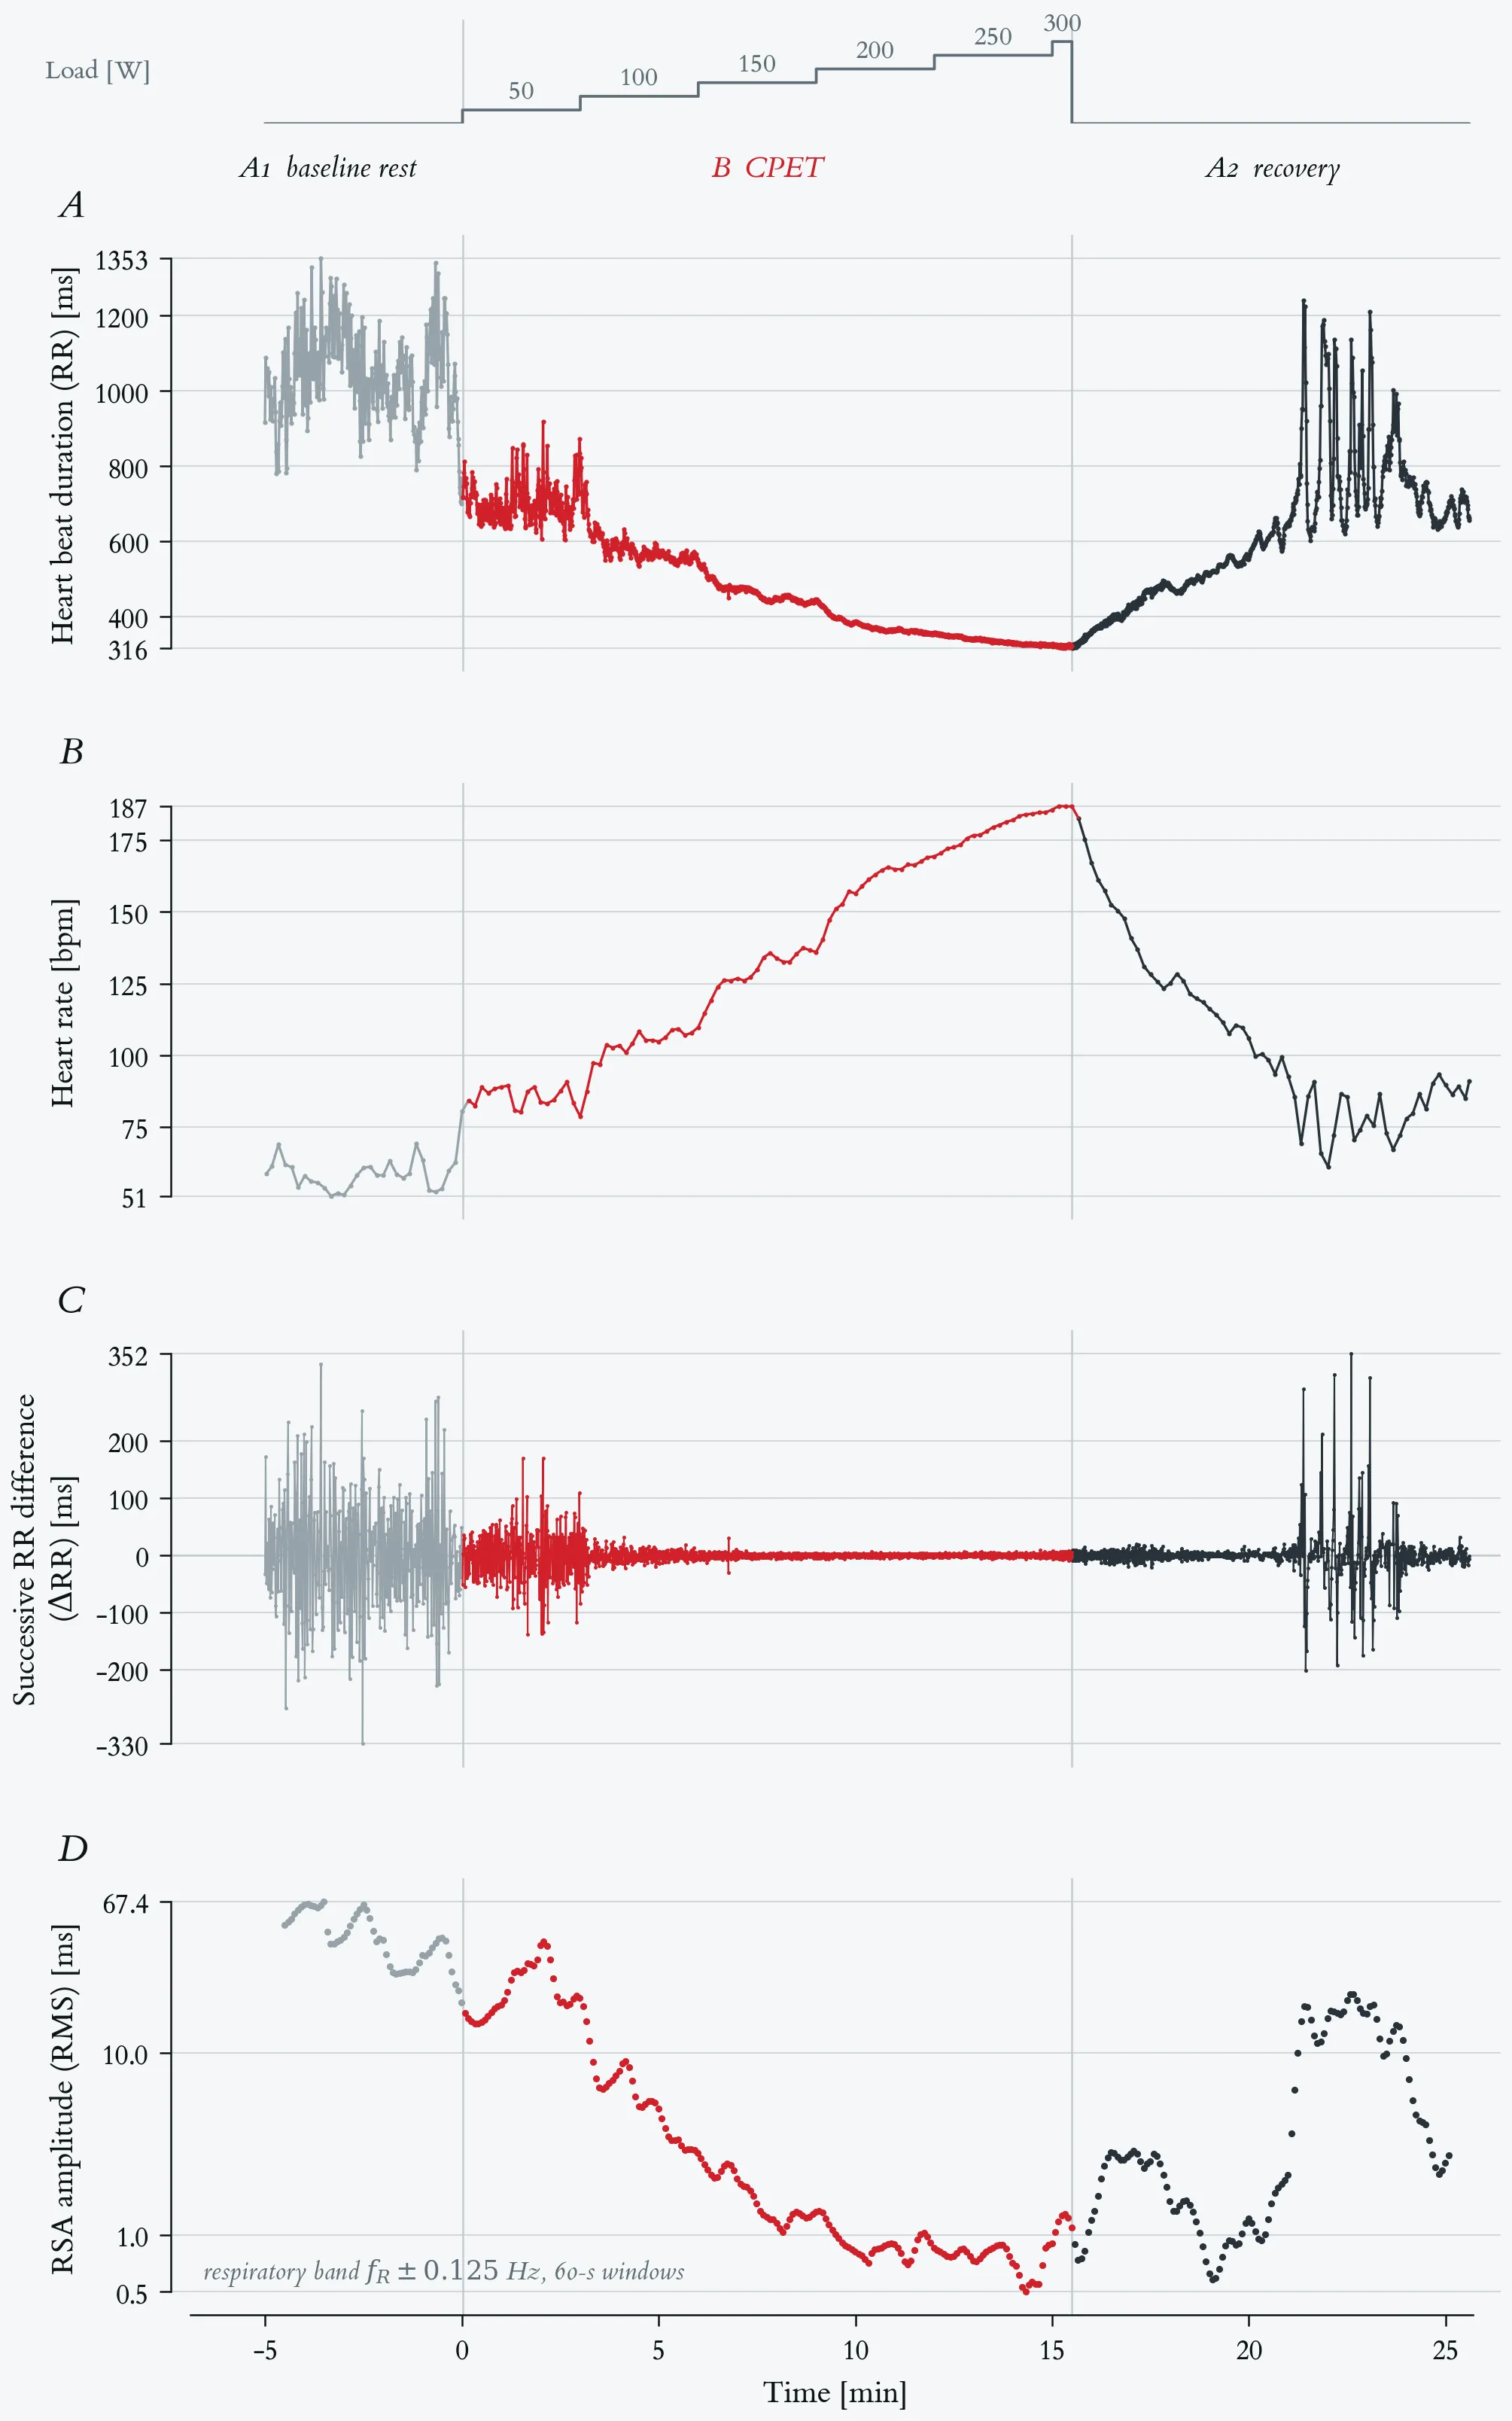
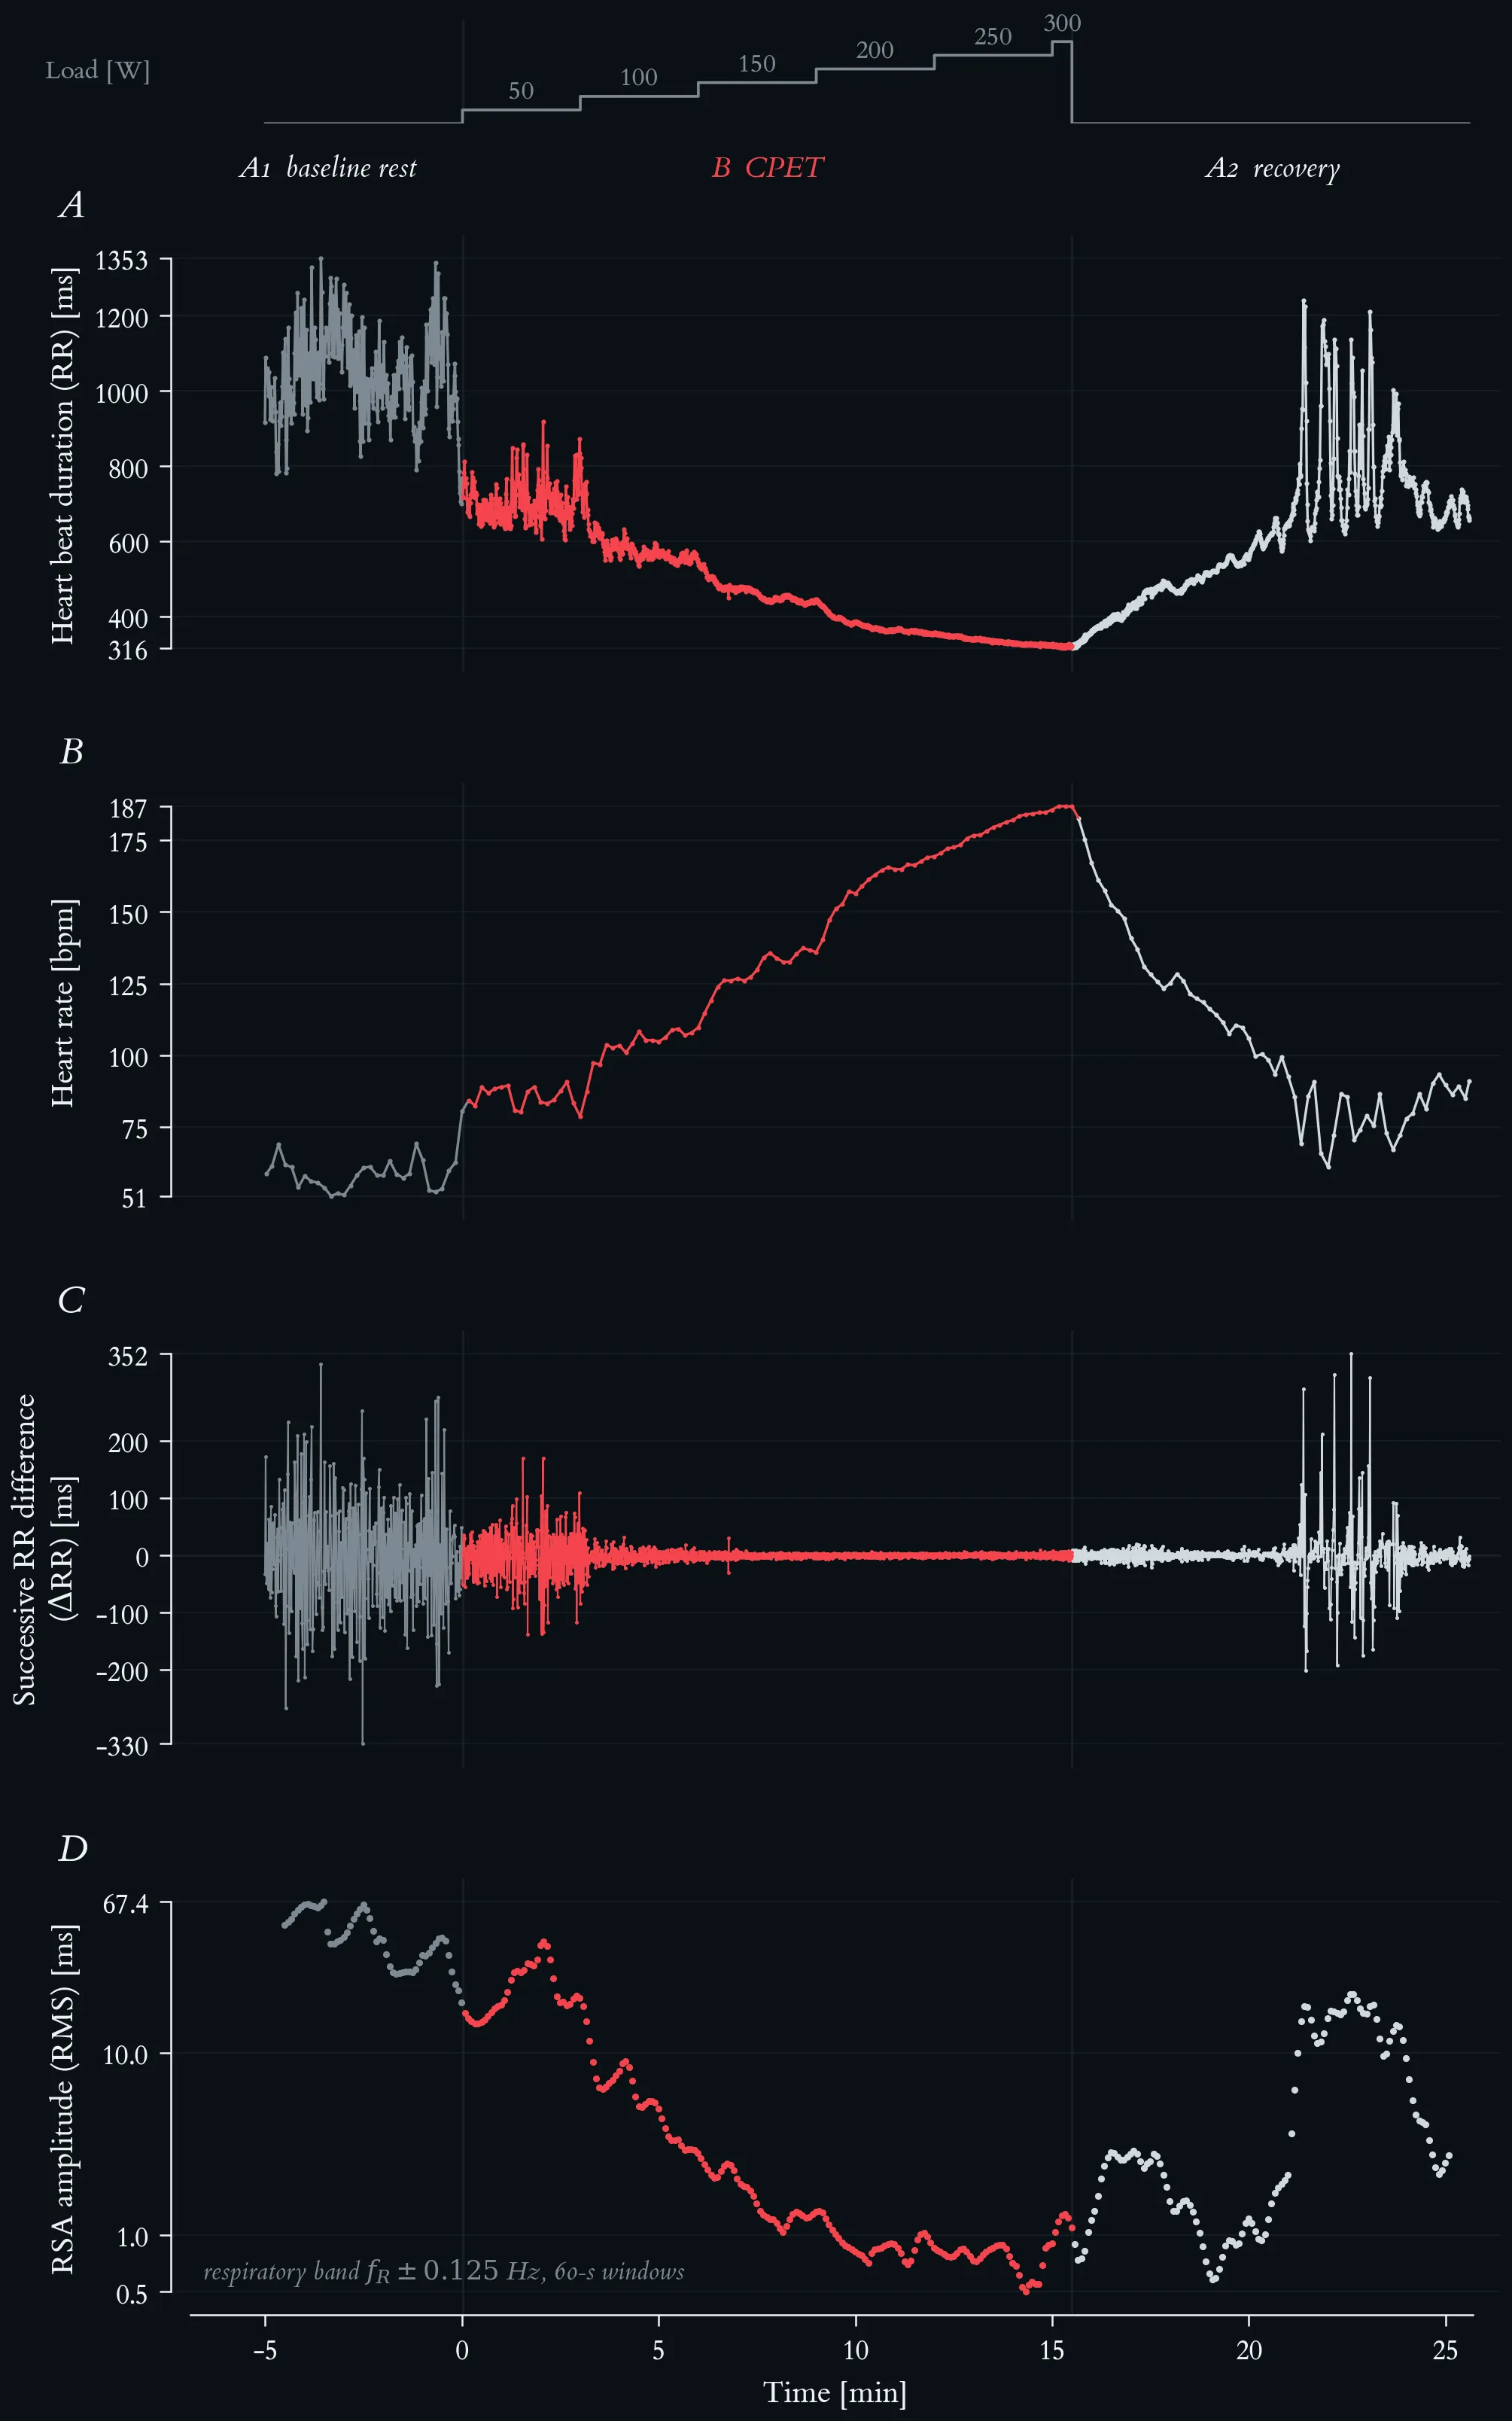
Beat-to-beat cardiac autonomic response across the ABA exercise protocol. Top strip: external work rate, stepped by 50 W every three minutes from 50 to 300 W. Phases are A1 baseline rest (5.0 min, 293 beats), B CPET (15.5 min, 2059 beats, red), and A2 recovery (10.1 min, 1070 beats); vertical hairlines mark the two transitions. (A) Beat-to-beat RR interval (n = 3422 beats). Mean RR falls from 1029 ms at rest to 452 ms under load and reaches its minimum of 316 ms at exhaustion. (B) Heart rate, the same recording averaged in 10-s bins, rising from 51 to 187 bpm. (C) Successive RR differences (ΔRR), the beat-to-beat change that panel A carries only implicitly. The scatter collapses from ±330 ms at rest to a near-flat band during the ramp — root mean square of successive differences 102 ms in A1, 16.9 ms across B, and 2.6 ms over the final five minutes of loading — and the large excursions return within the first minutes of A2, where isolated beats again differ by more than 300 ms. (D) RSA amplitude: the RMS of the RR oscillation inside a respiration-guided band, f_R ± 0.125 Hz, with f_R taken from the concurrent measured breathing frequency; 60-s windows stepped by 5 s, logarithmic axis. Because breathing frequency rises from 0.22 to 0.98 Hz over this test, the classic high-frequency band (0.15–0.40 Hz) would miss the respiratory peak from the 150 W stage onward and underestimate it by a factor of five at 250 W.
Breathing frequency across the maximal incremental step test. Top strip: external work rate, incremented by 50 W every three minutes from 50 W to a final 300 W stage terminated after 30 s at volitional exhaustion. Lactate-based reference loads: aerobic threshold 117 W, individual anaerobic threshold 145 W. Phases are A1 baseline rest, B step test (red) and A2 passive recovery; vertical hairlines mark the two transitions. Breathing frequency (fb) as 10-s averages from the metabolic cart, 196 samples.
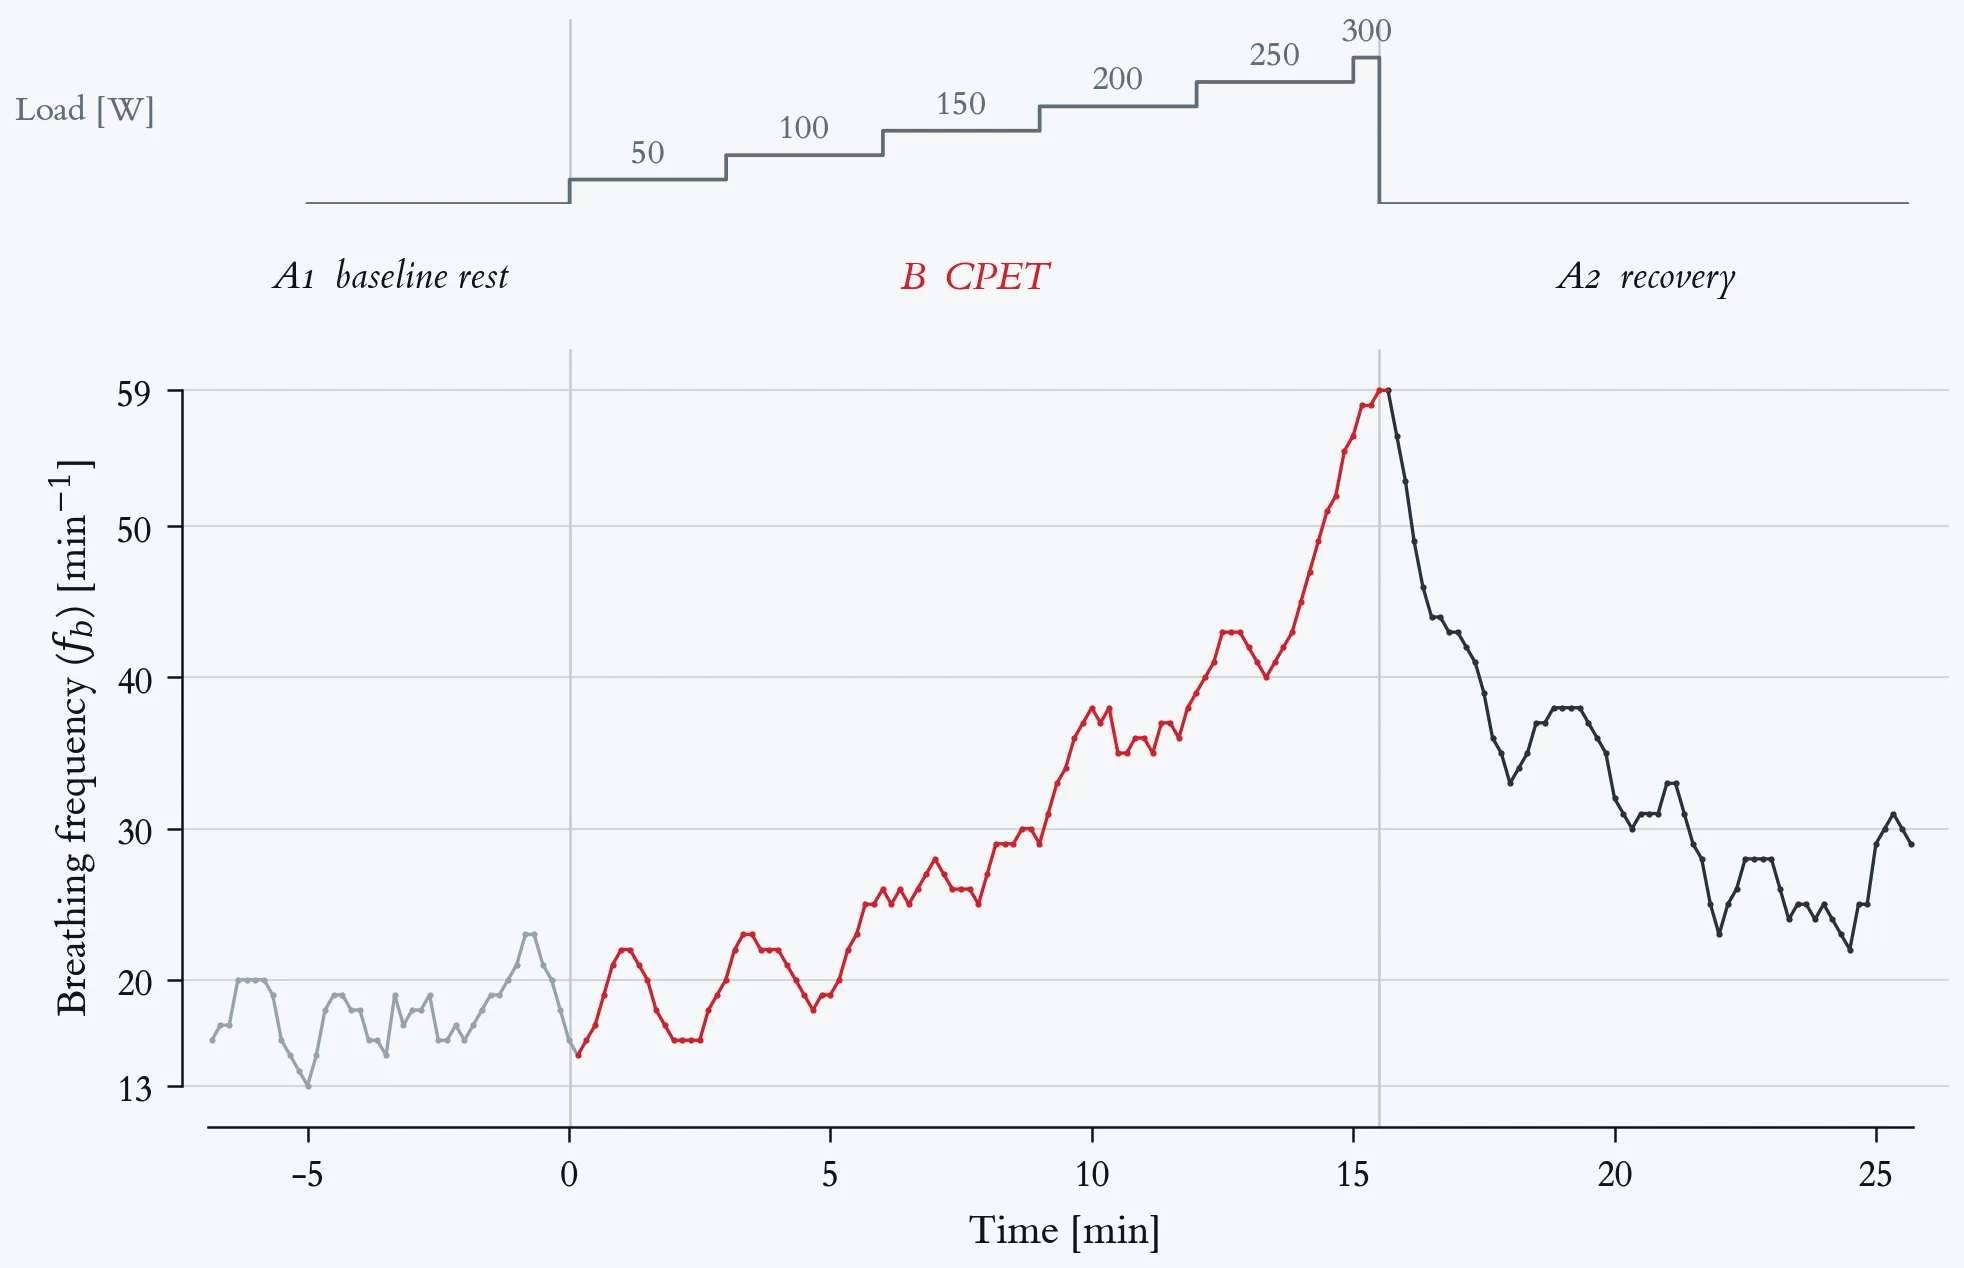
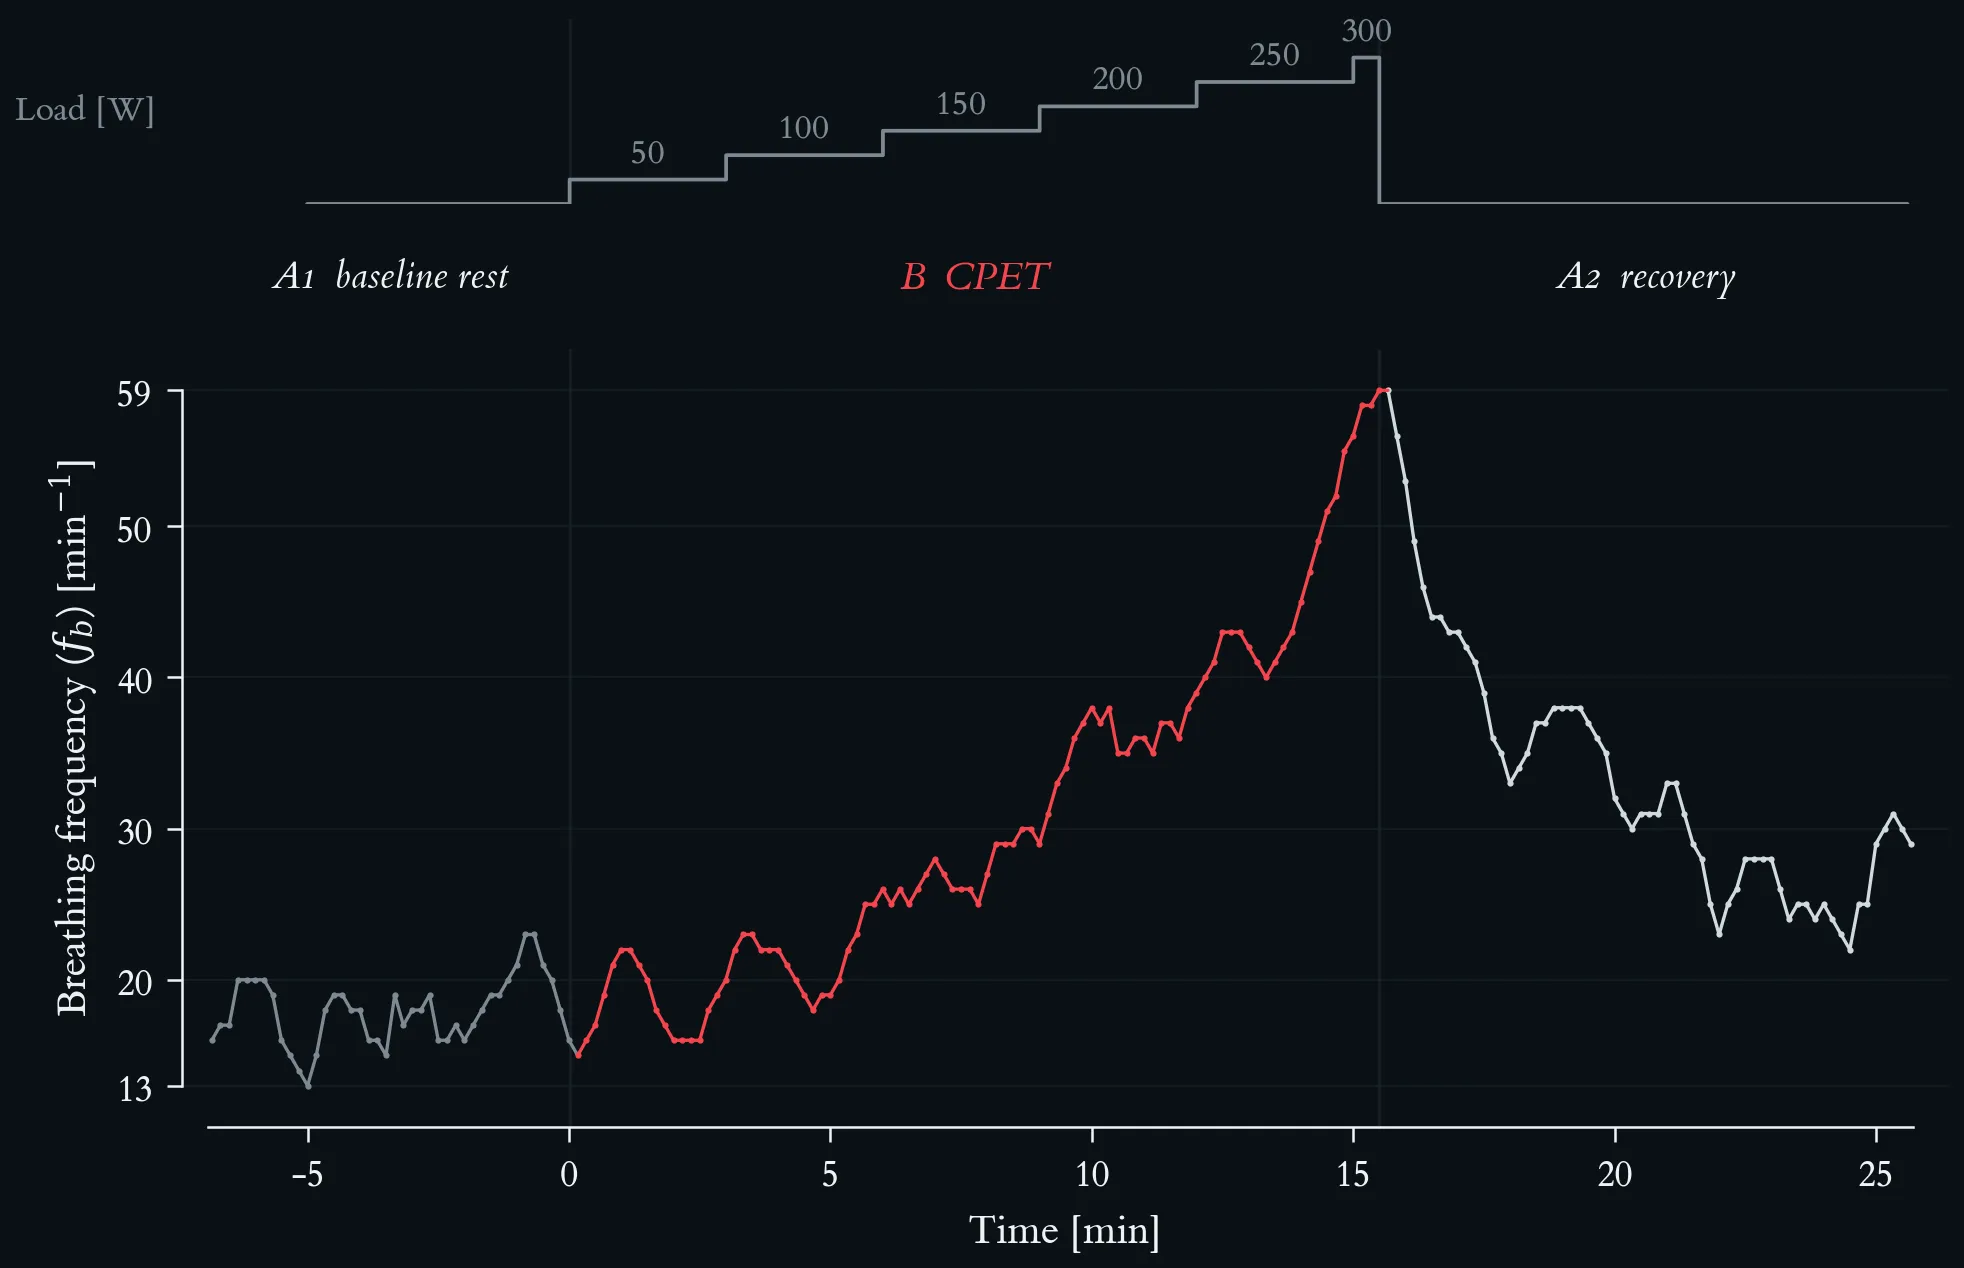
Breathing frequency across the maximal incremental step test. Top strip: external work rate, incremented by 50 W every three minutes from 50 W to a final 300 W stage terminated after 30 s at volitional exhaustion. Lactate-based reference loads: aerobic threshold 117 W, individual anaerobic threshold 145 W. Phases are A1 baseline rest, B step test (red) and A2 passive recovery; vertical hairlines mark the two transitions. Breathing frequency (fb) as 10-s averages from the metabolic cart, 196 samples.
Mass-related oxygen uptake and respiratory exchange ratio across the maximal incremental step test. Top strip: external work rate, incremented by 50 W every three minutes from 50 W to a final 300 W stage terminated after 30 s at volitional exhaustion. Lactate-based reference loads: aerobic threshold 117 W, individual anaerobic threshold 145 W. Phases are A1 baseline rest, B step test (red) and A2 passive recovery; vertical hairlines mark the two transitions. Both series are 10-s averages from the metabolic cart, 196 samples. (A) Mass-related oxygen uptake, V̇O₂ per body mass (69 kg), in ml · min⁻¹ · kg⁻¹, rising from 2.8 at rest to a peak of 40.7 in the first recovery sample. (B) Respiratory exchange ratio (RER), with a hairline at 1.00.
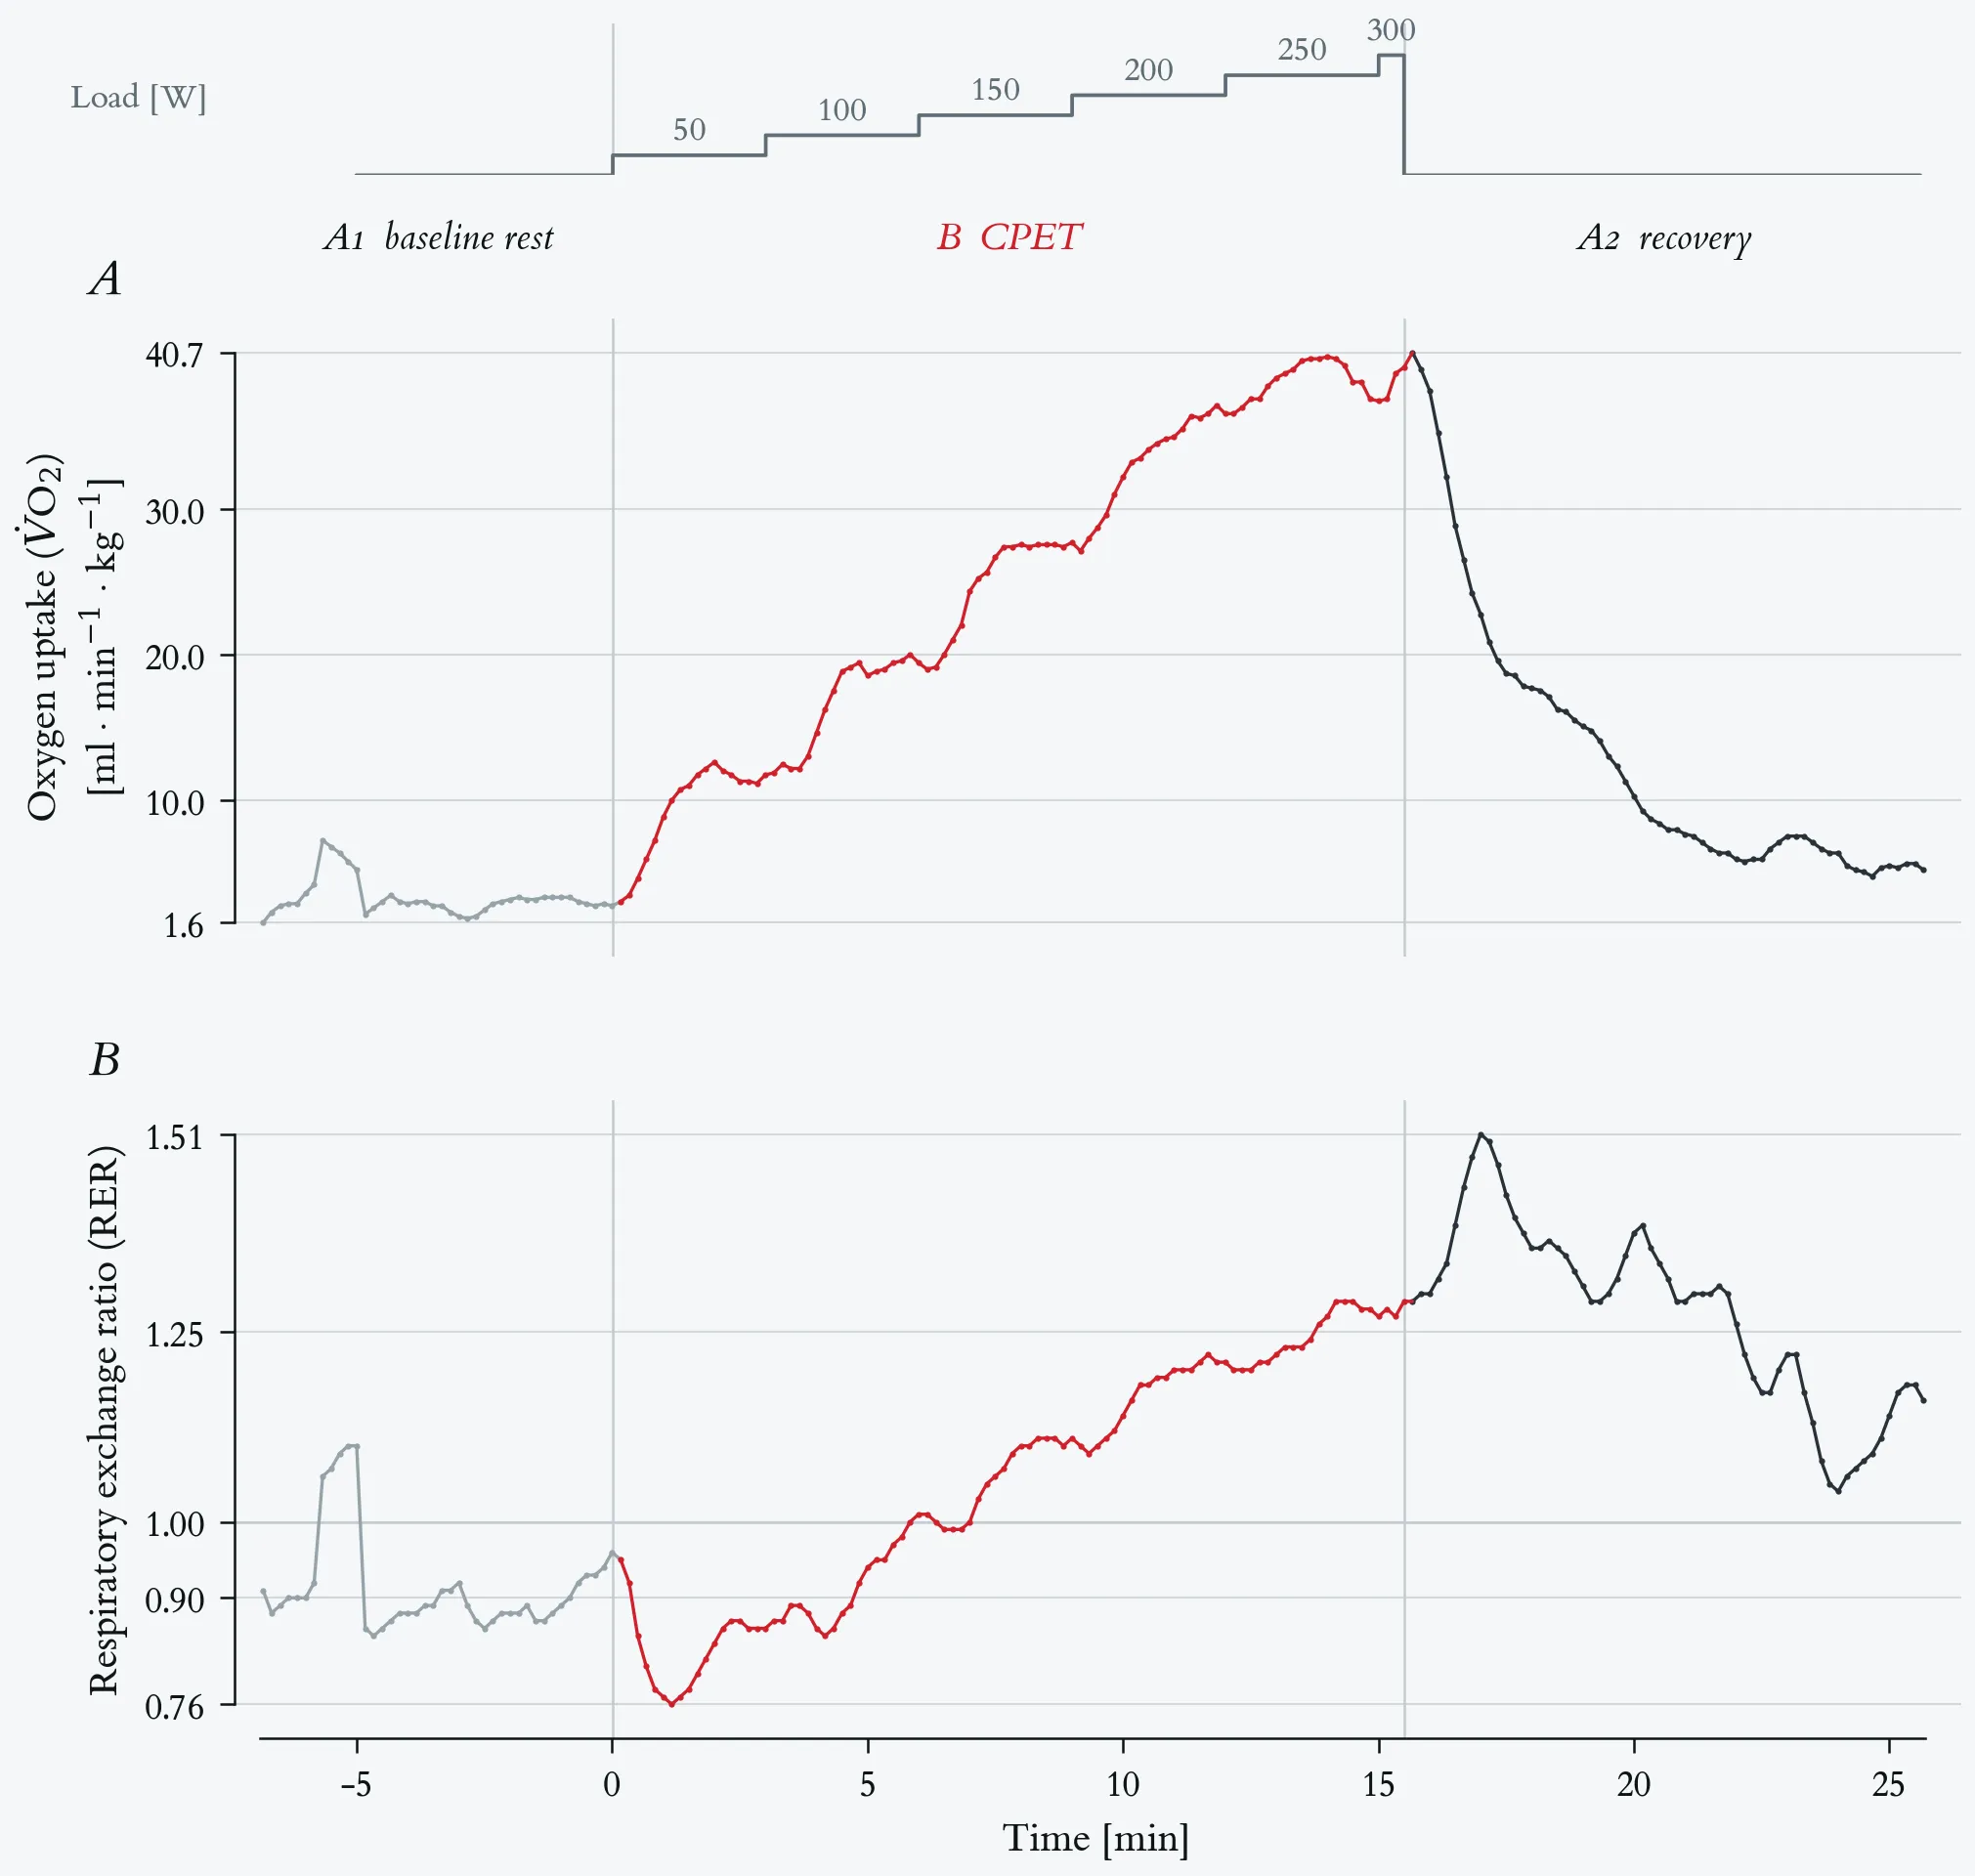
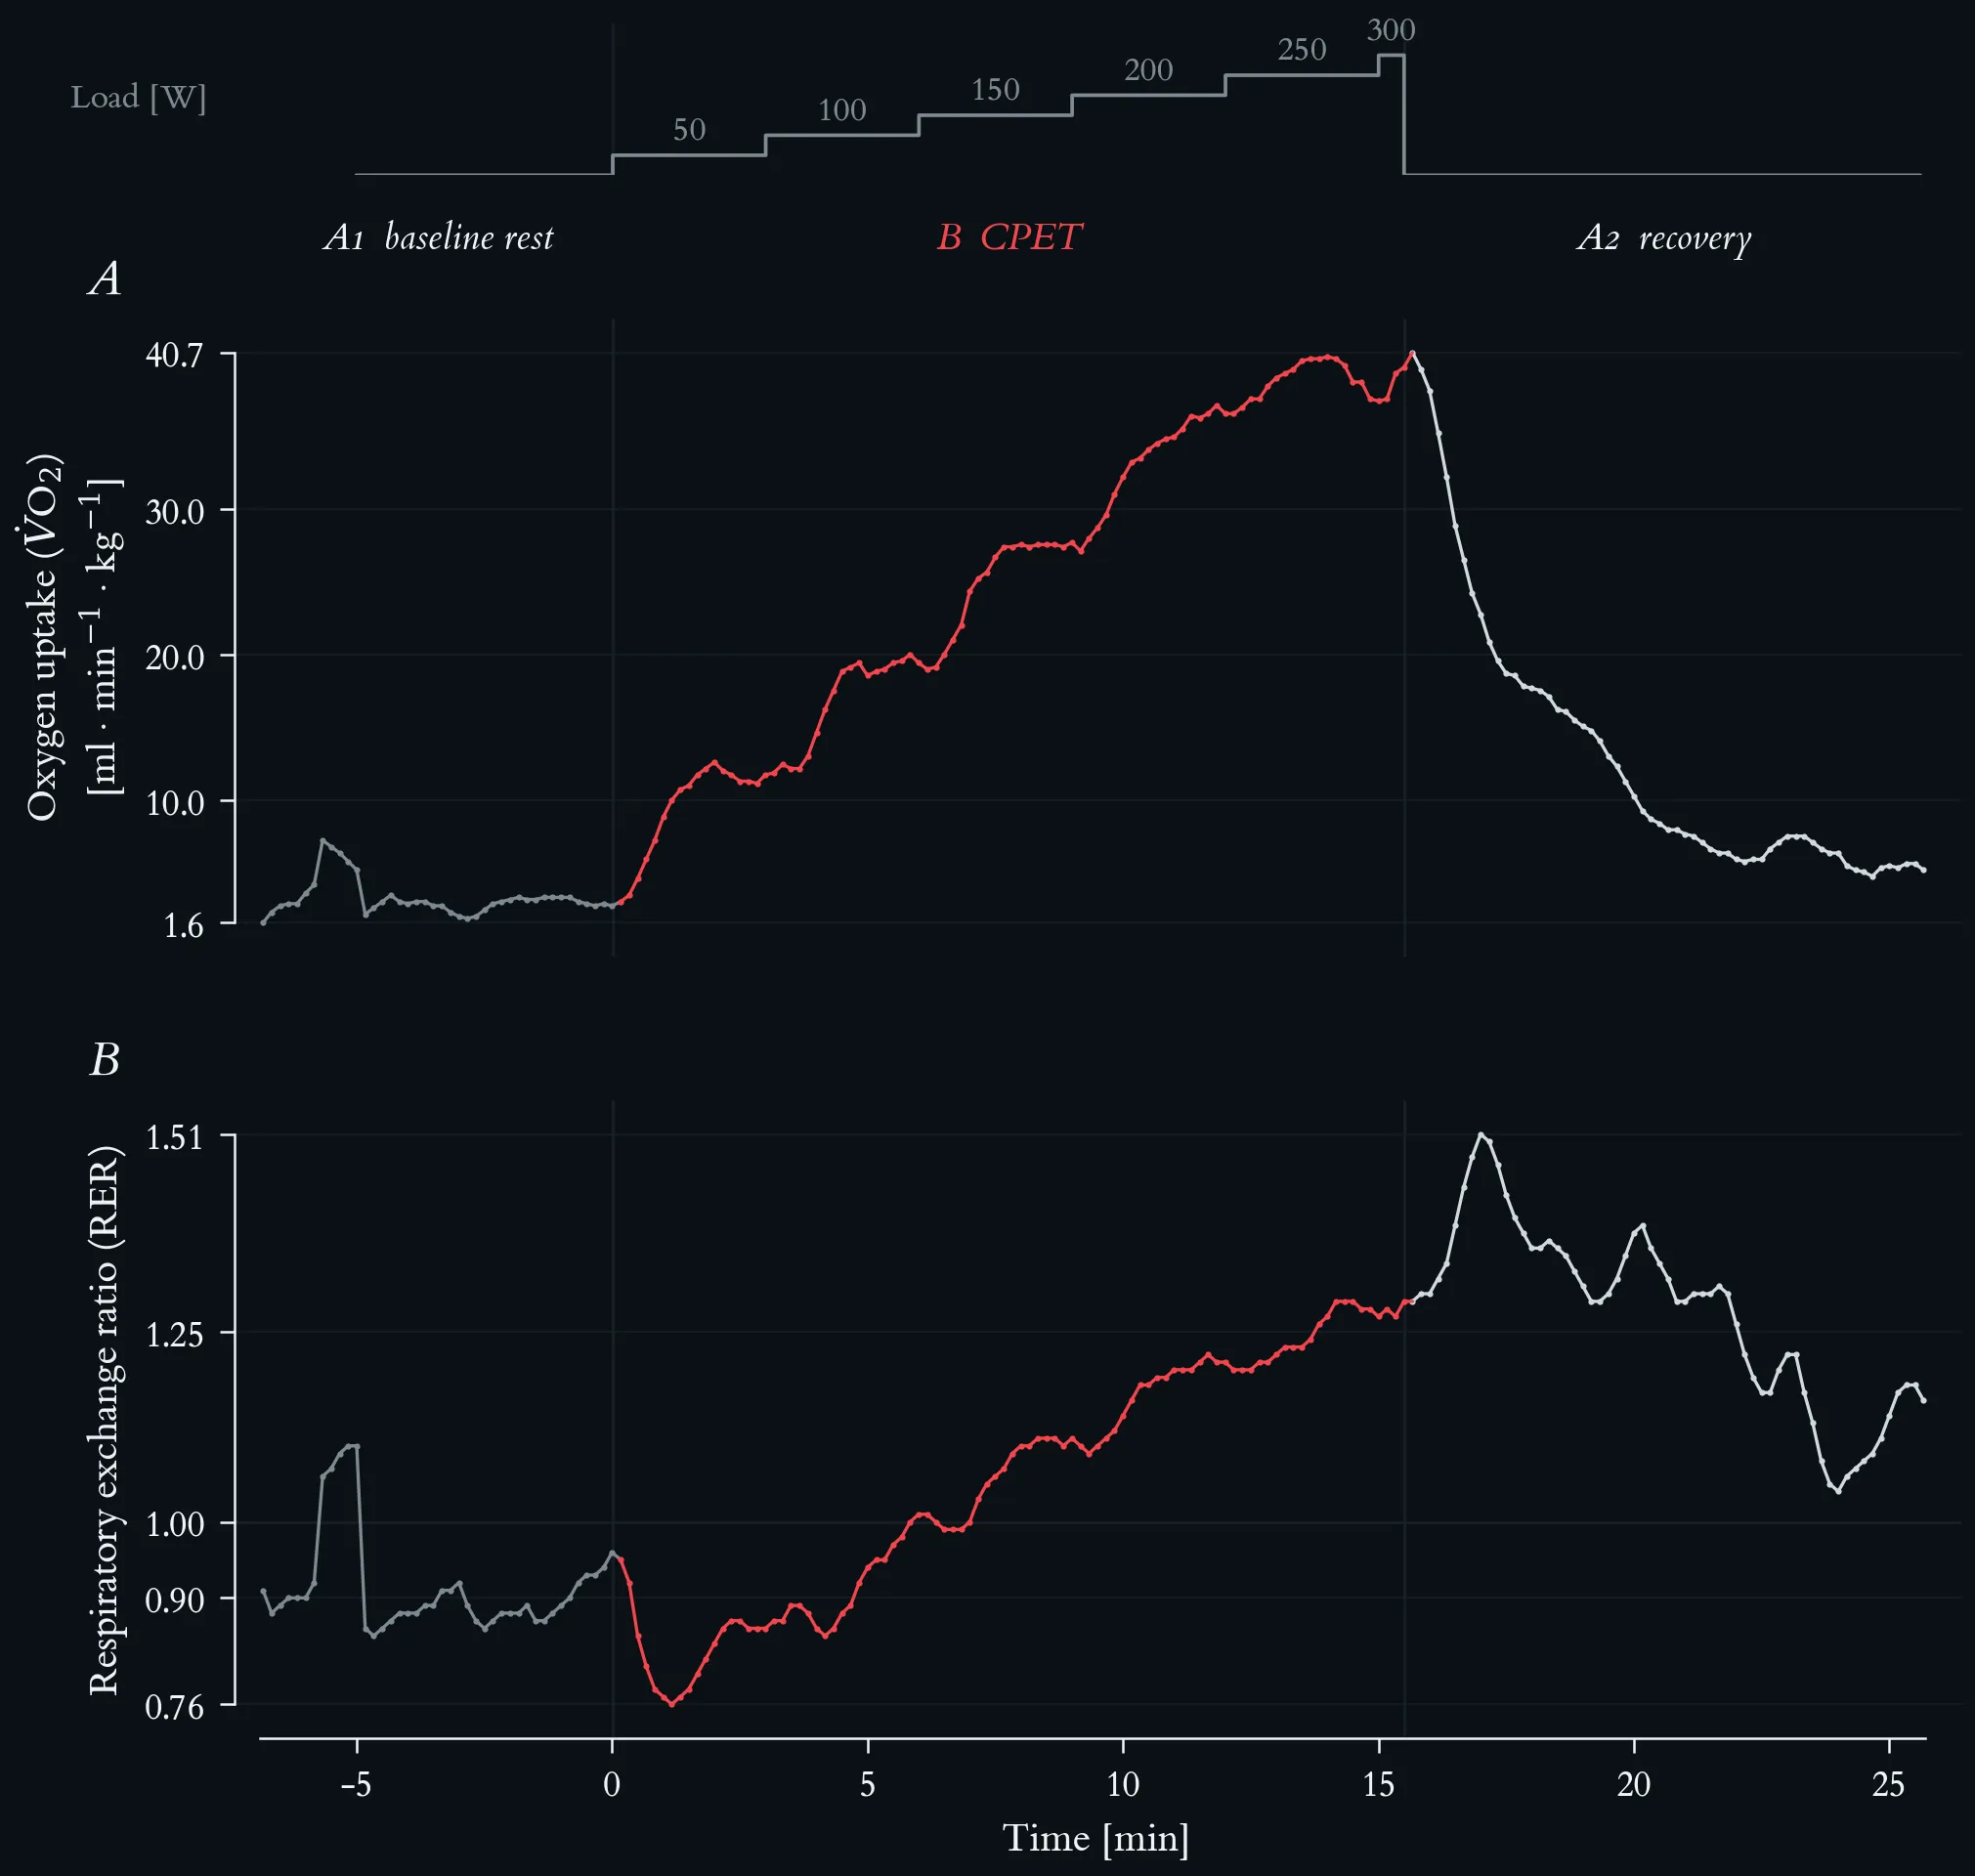
Mass-related oxygen uptake and respiratory exchange ratio across the maximal incremental step test. Top strip: external work rate, incremented by 50 W every three minutes from 50 W to a final 300 W stage terminated after 30 s at volitional exhaustion. Lactate-based reference loads: aerobic threshold 117 W, individual anaerobic threshold 145 W. Phases are A1 baseline rest, B step test (red) and A2 passive recovery; vertical hairlines mark the two transitions. Both series are 10-s averages from the metabolic cart, 196 samples. (A) Mass-related oxygen uptake, V̇O₂ per body mass (69 kg), in ml · min⁻¹ · kg⁻¹, rising from 2.8 at rest to a peak of 40.7 in the first recovery sample. (B) Respiratory exchange ratio (RER), with a hairline at 1.00.
Homeostasis time-course: the IL-6 peak, delayed IL-10/IL-1Ra counter-response, functional capacity dip, and the set-point reference line, with annotated phase zones.
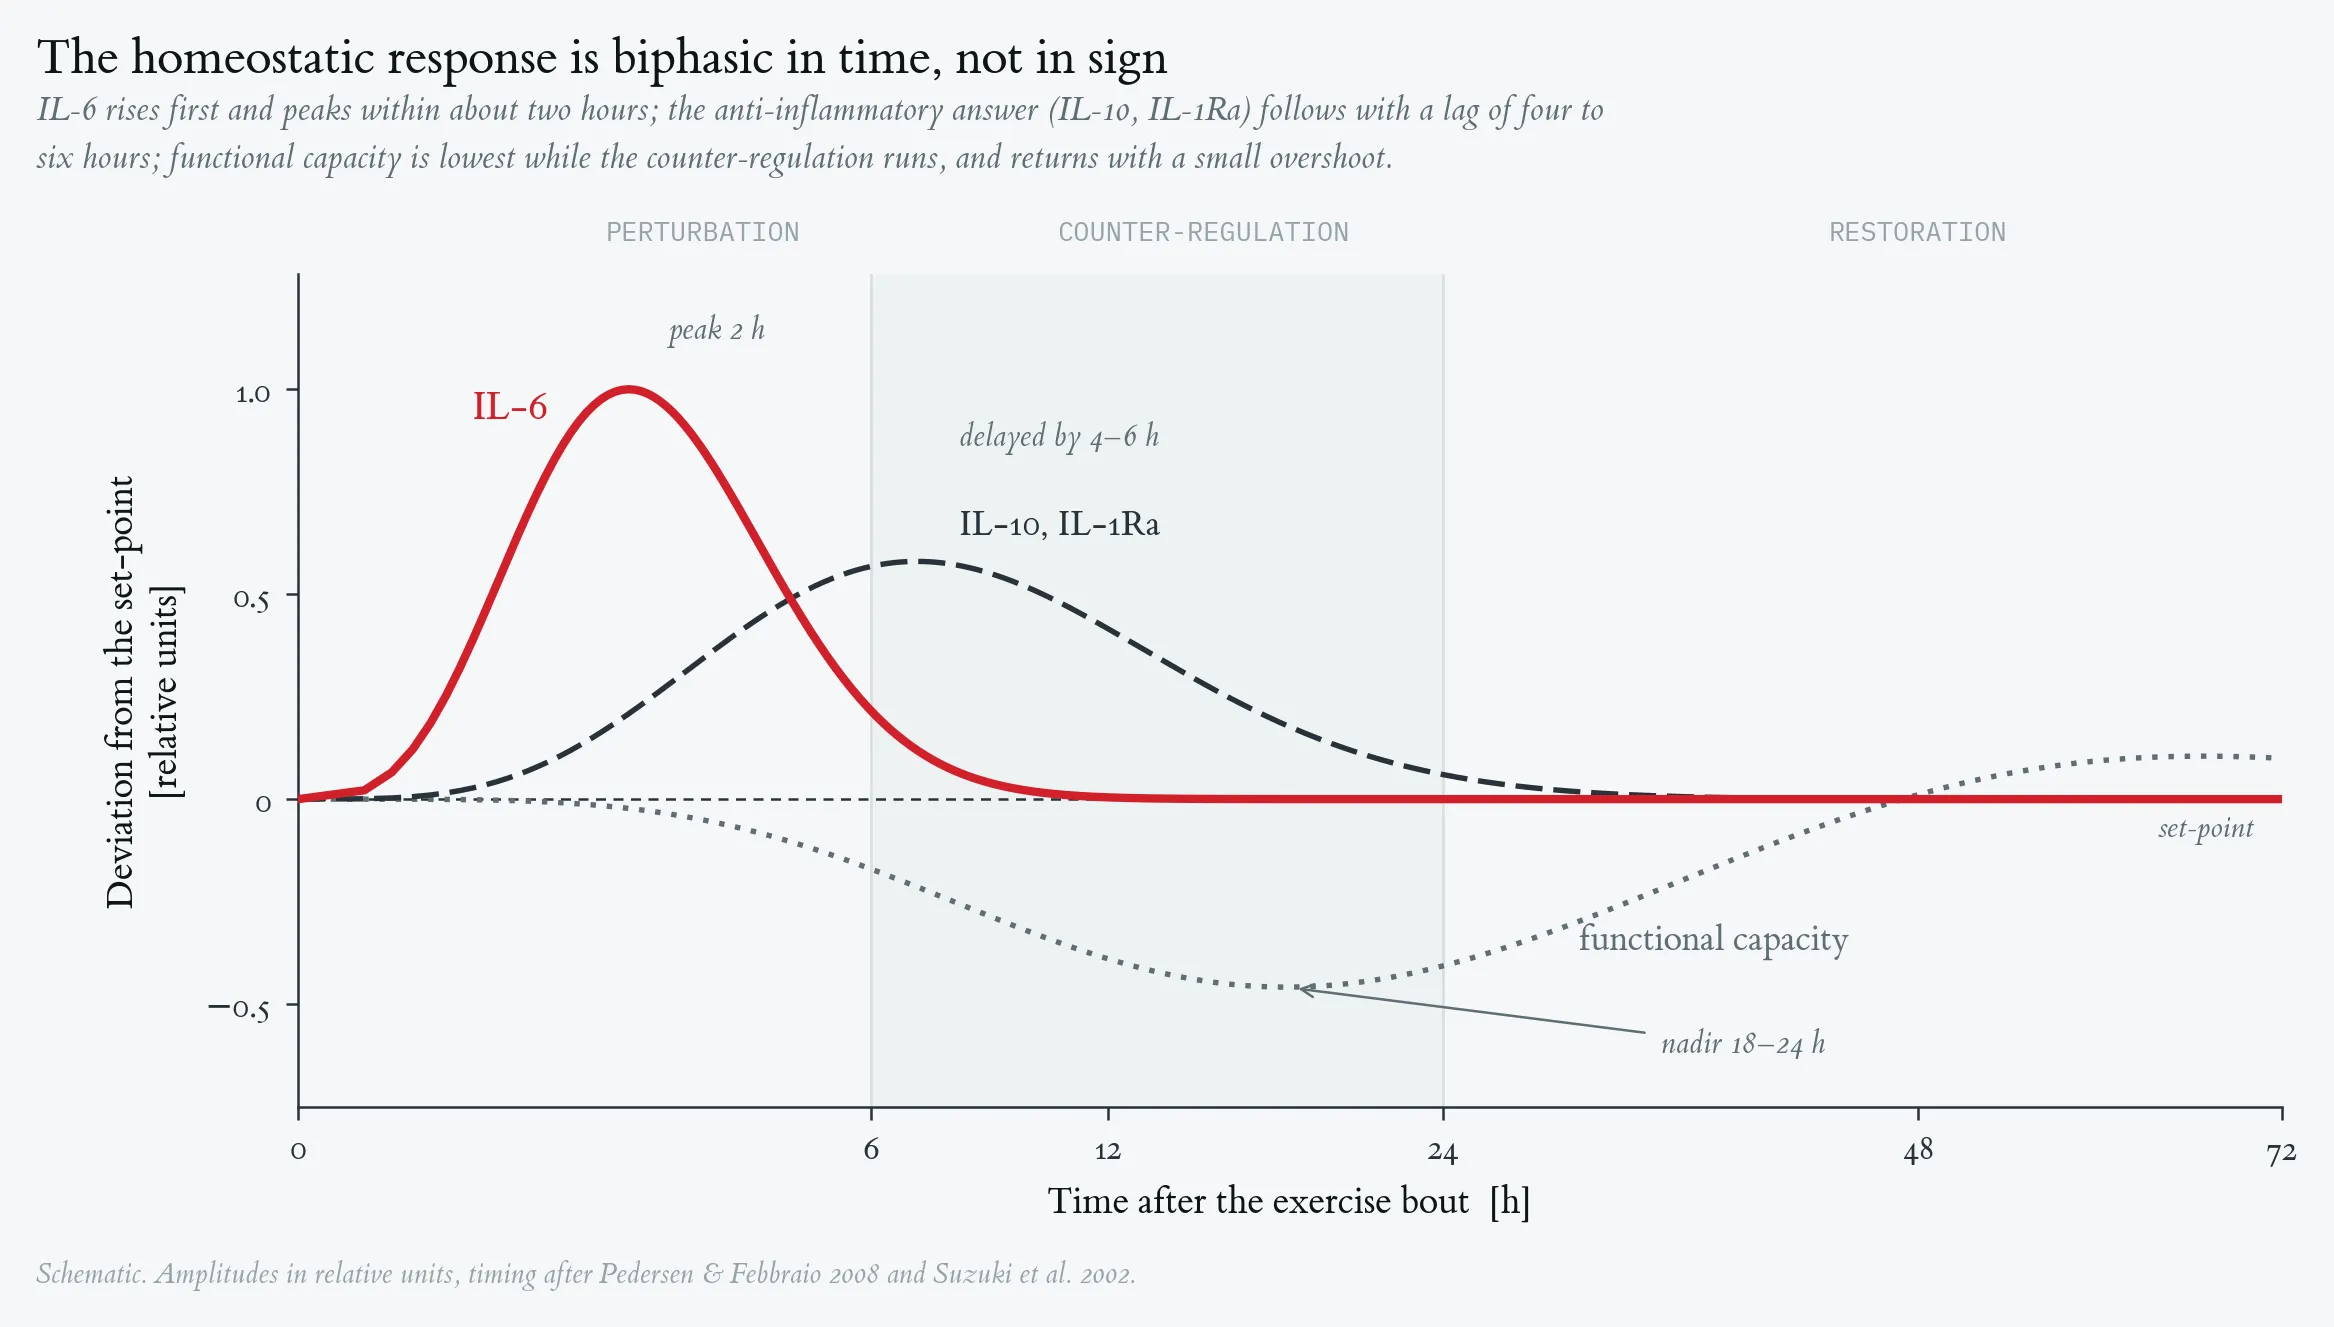
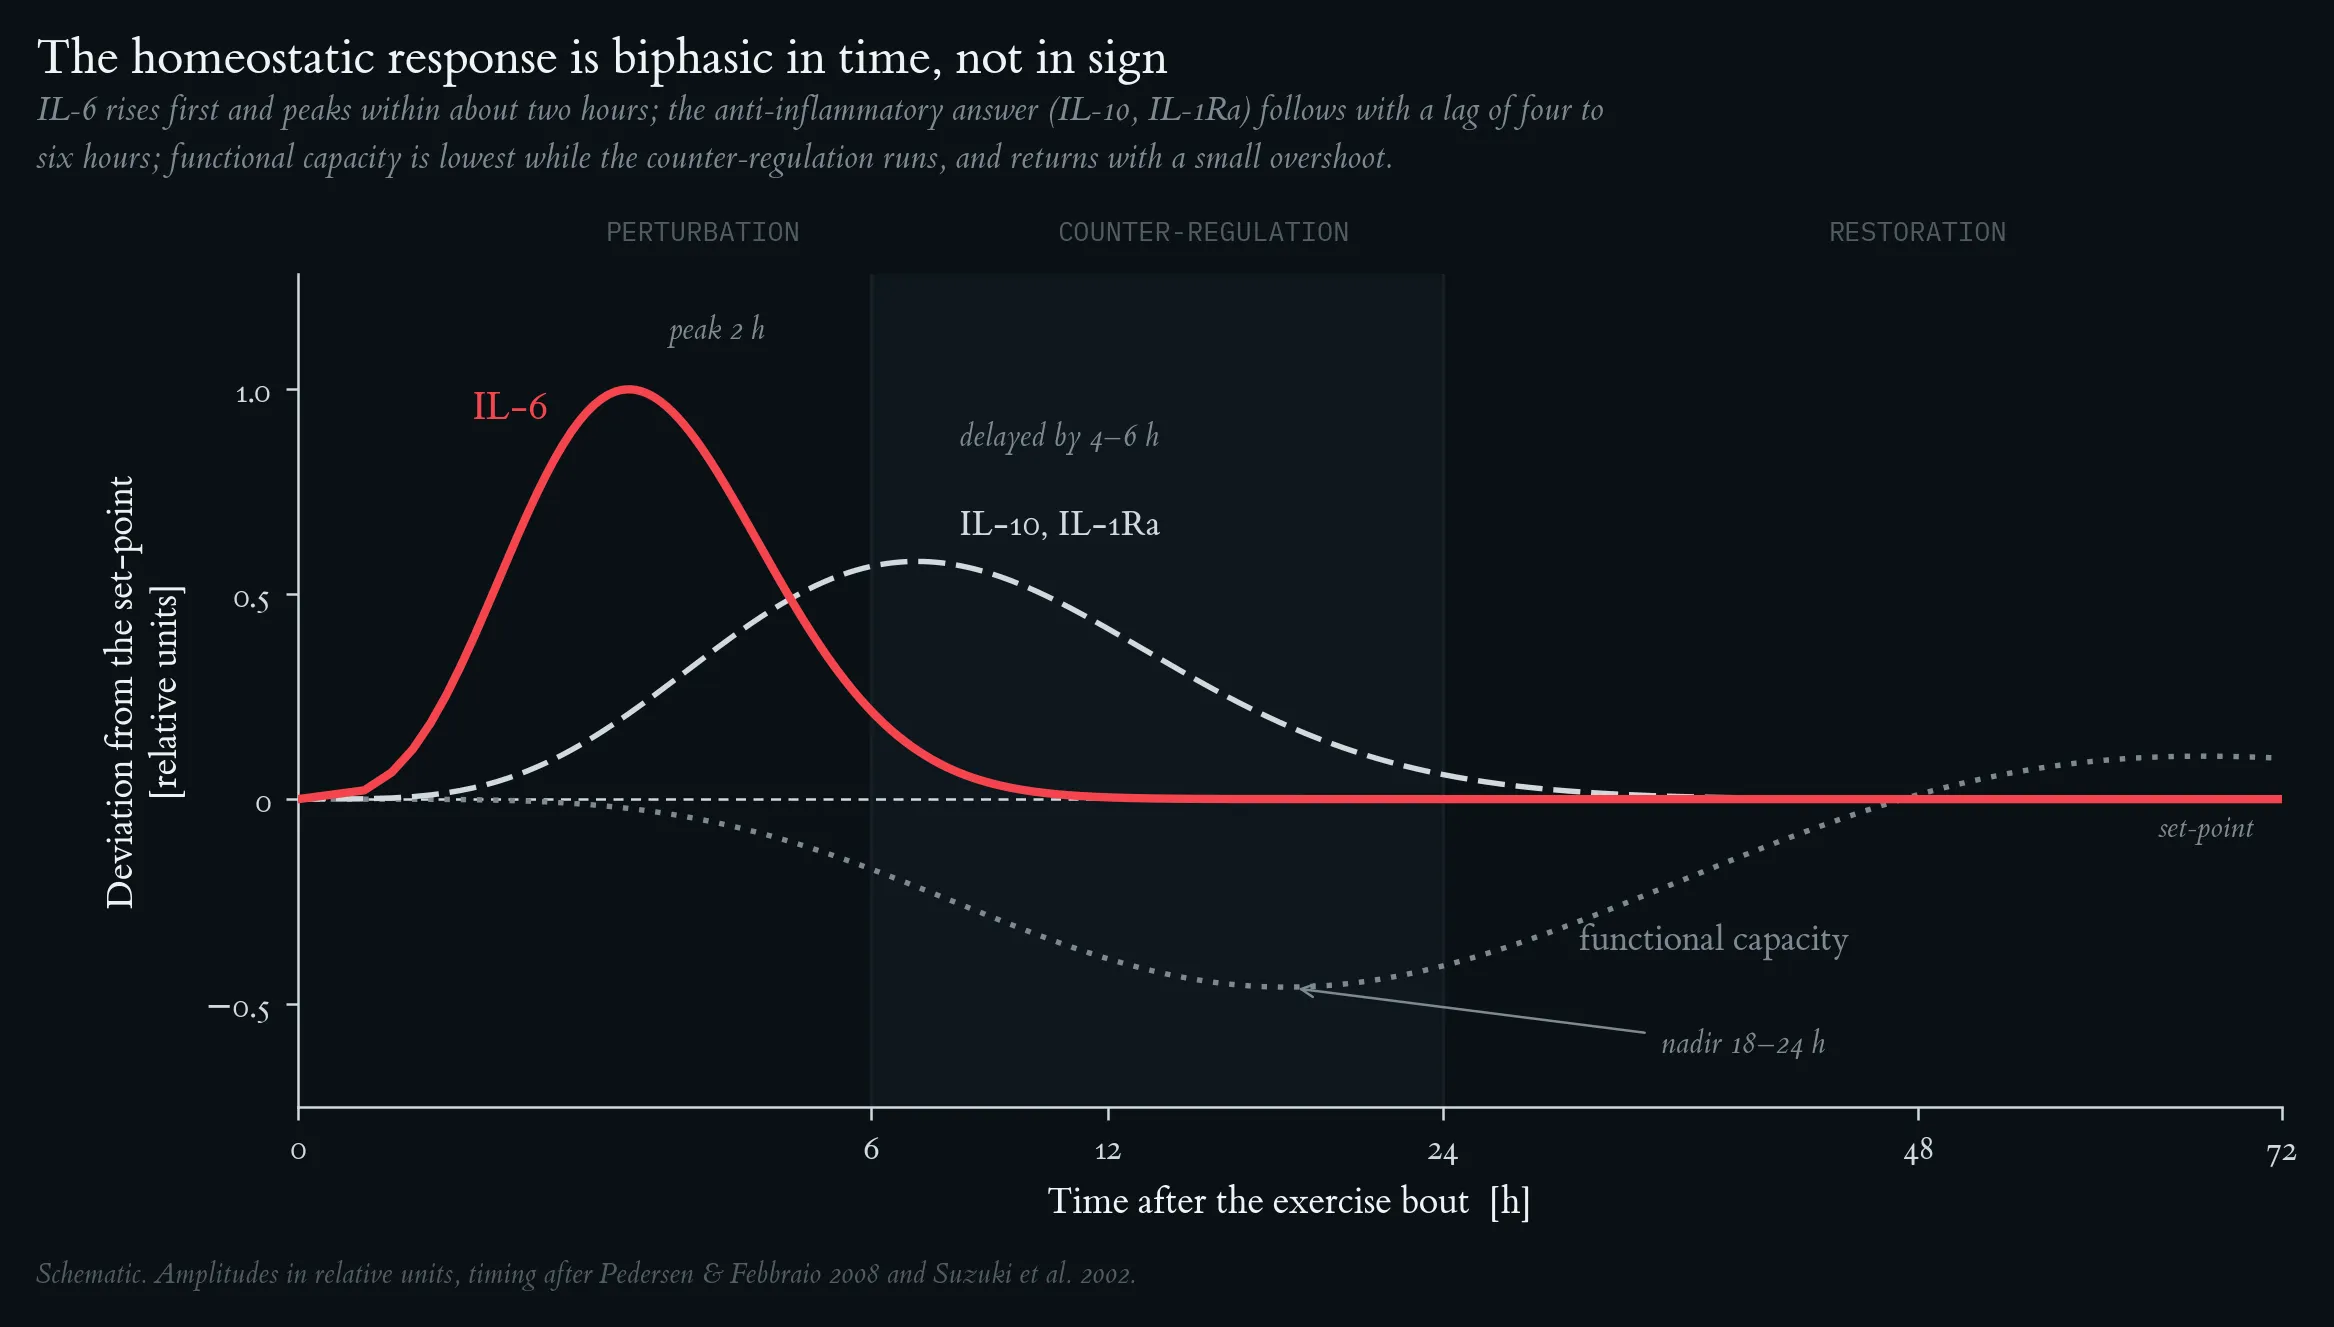
Homeostasis time-course: the IL-6 peak, delayed IL-10/IL-1Ra counter-response, functional capacity dip, and the set-point reference line, with annotated phase zones.
Hormesis dose-response: the full J-curve (URTI risk), bell-shaped adaptive benefit, and monotonically rising inflammatory load, with the three dose zones (sub-threshold / hormetic / overload) shaded.
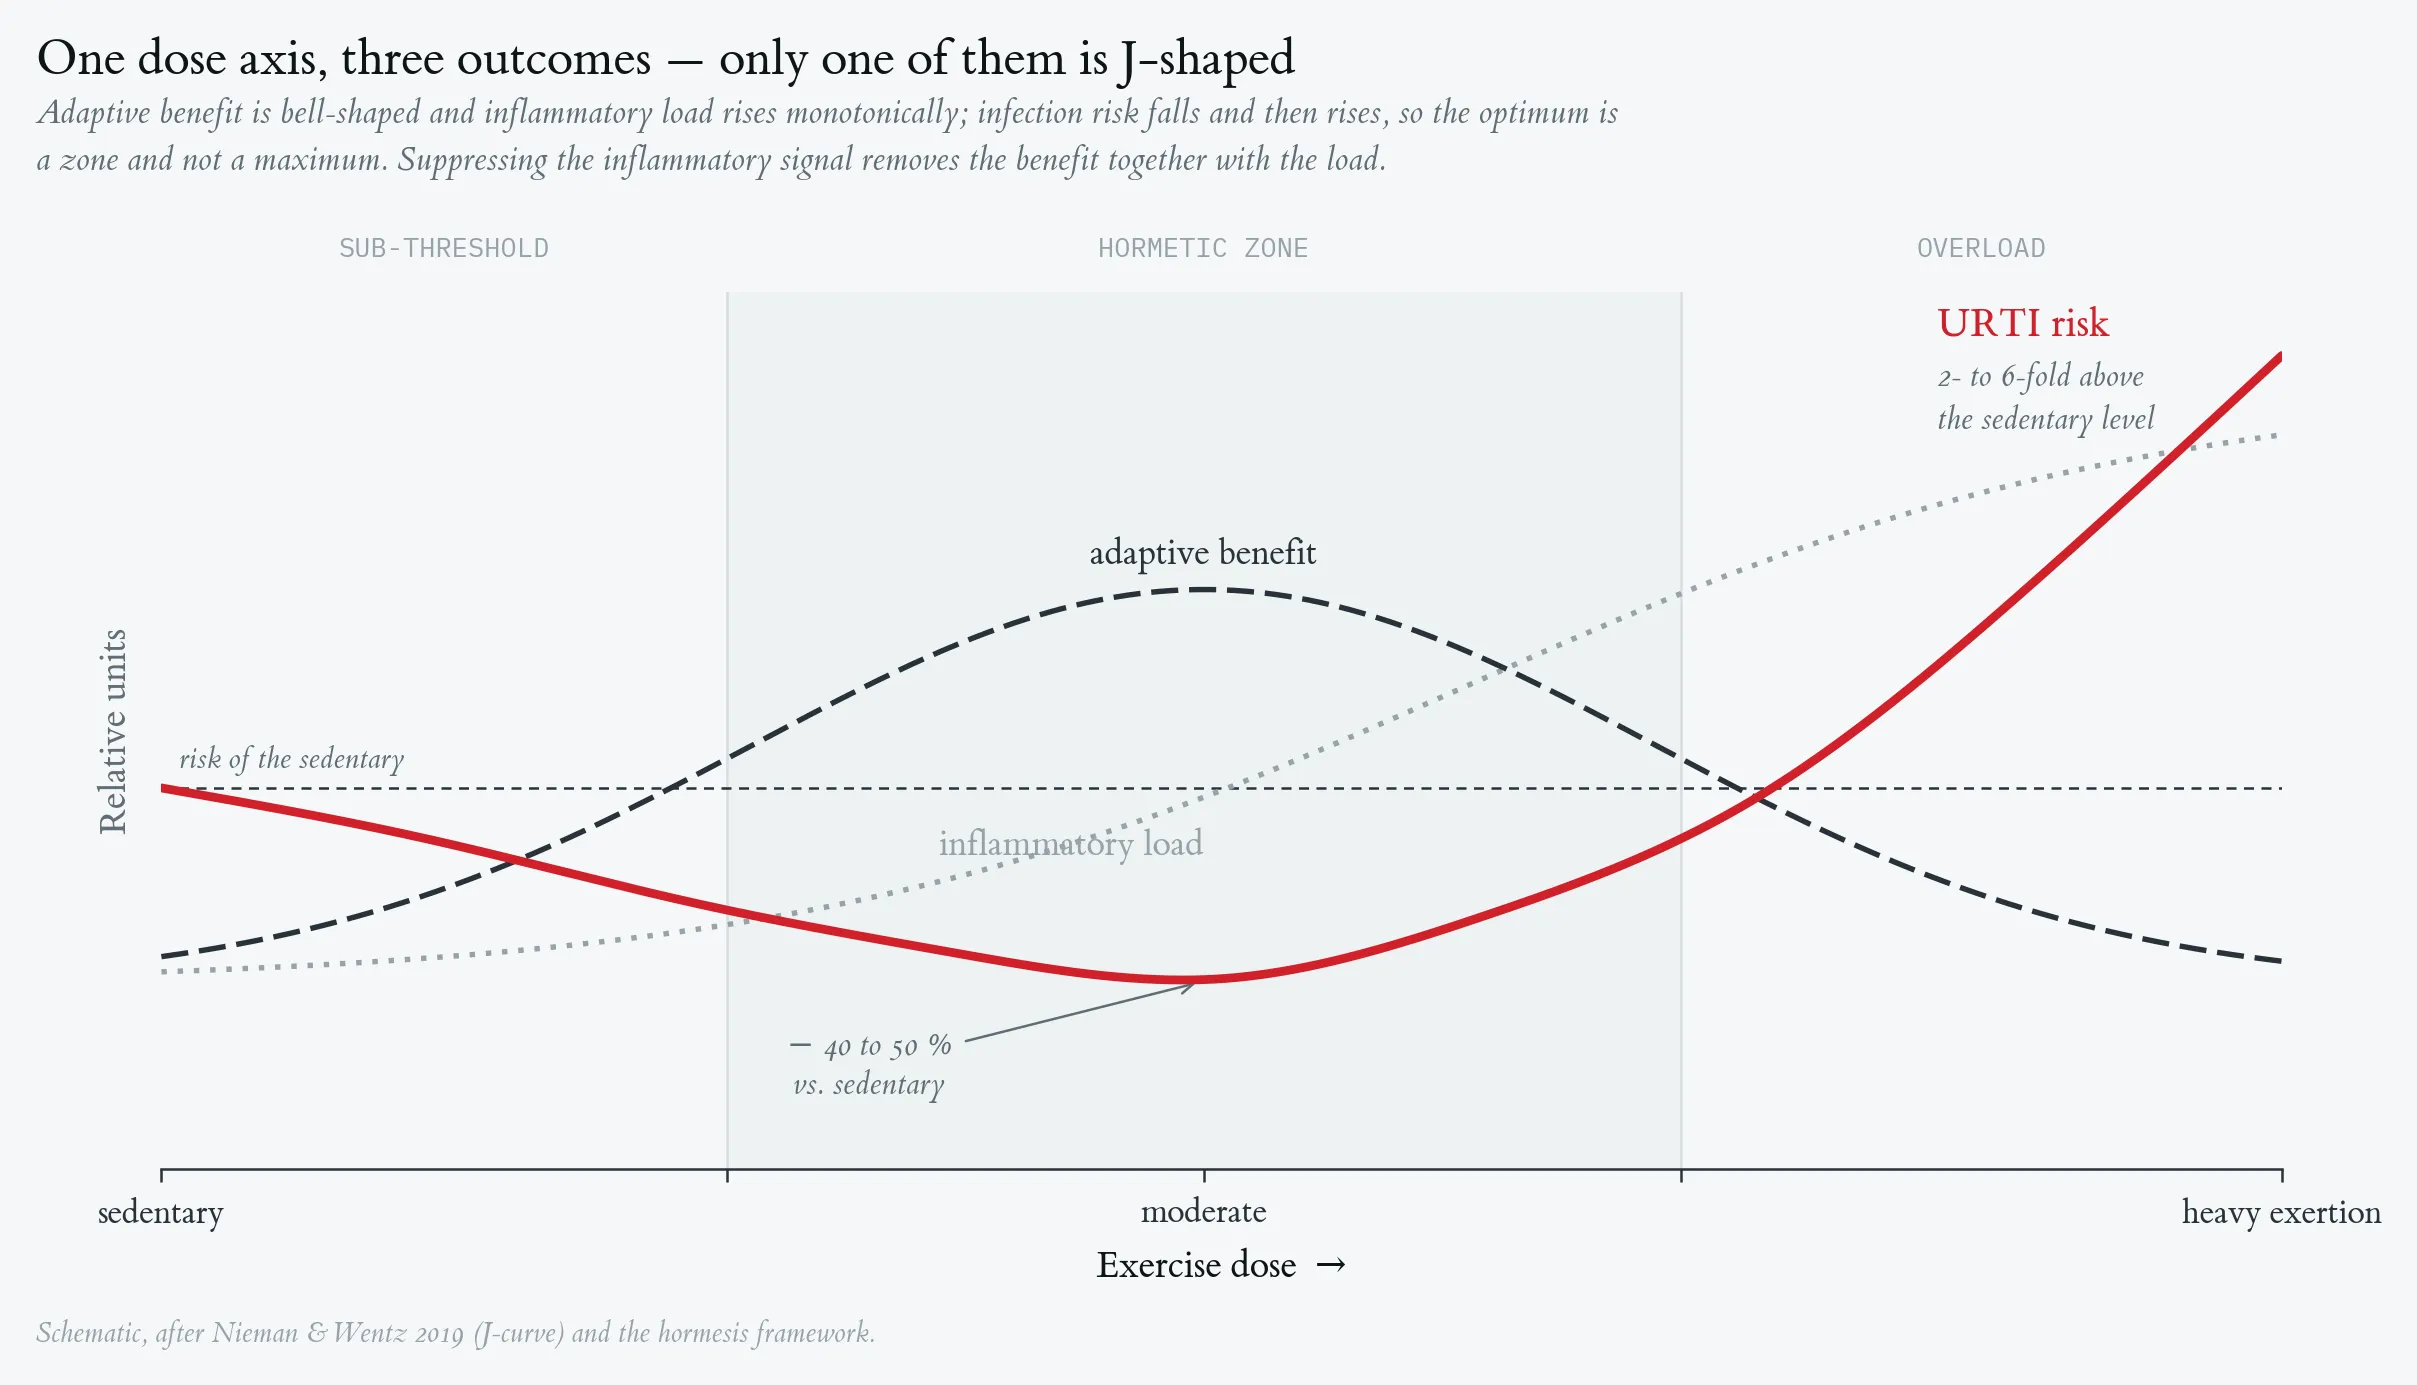
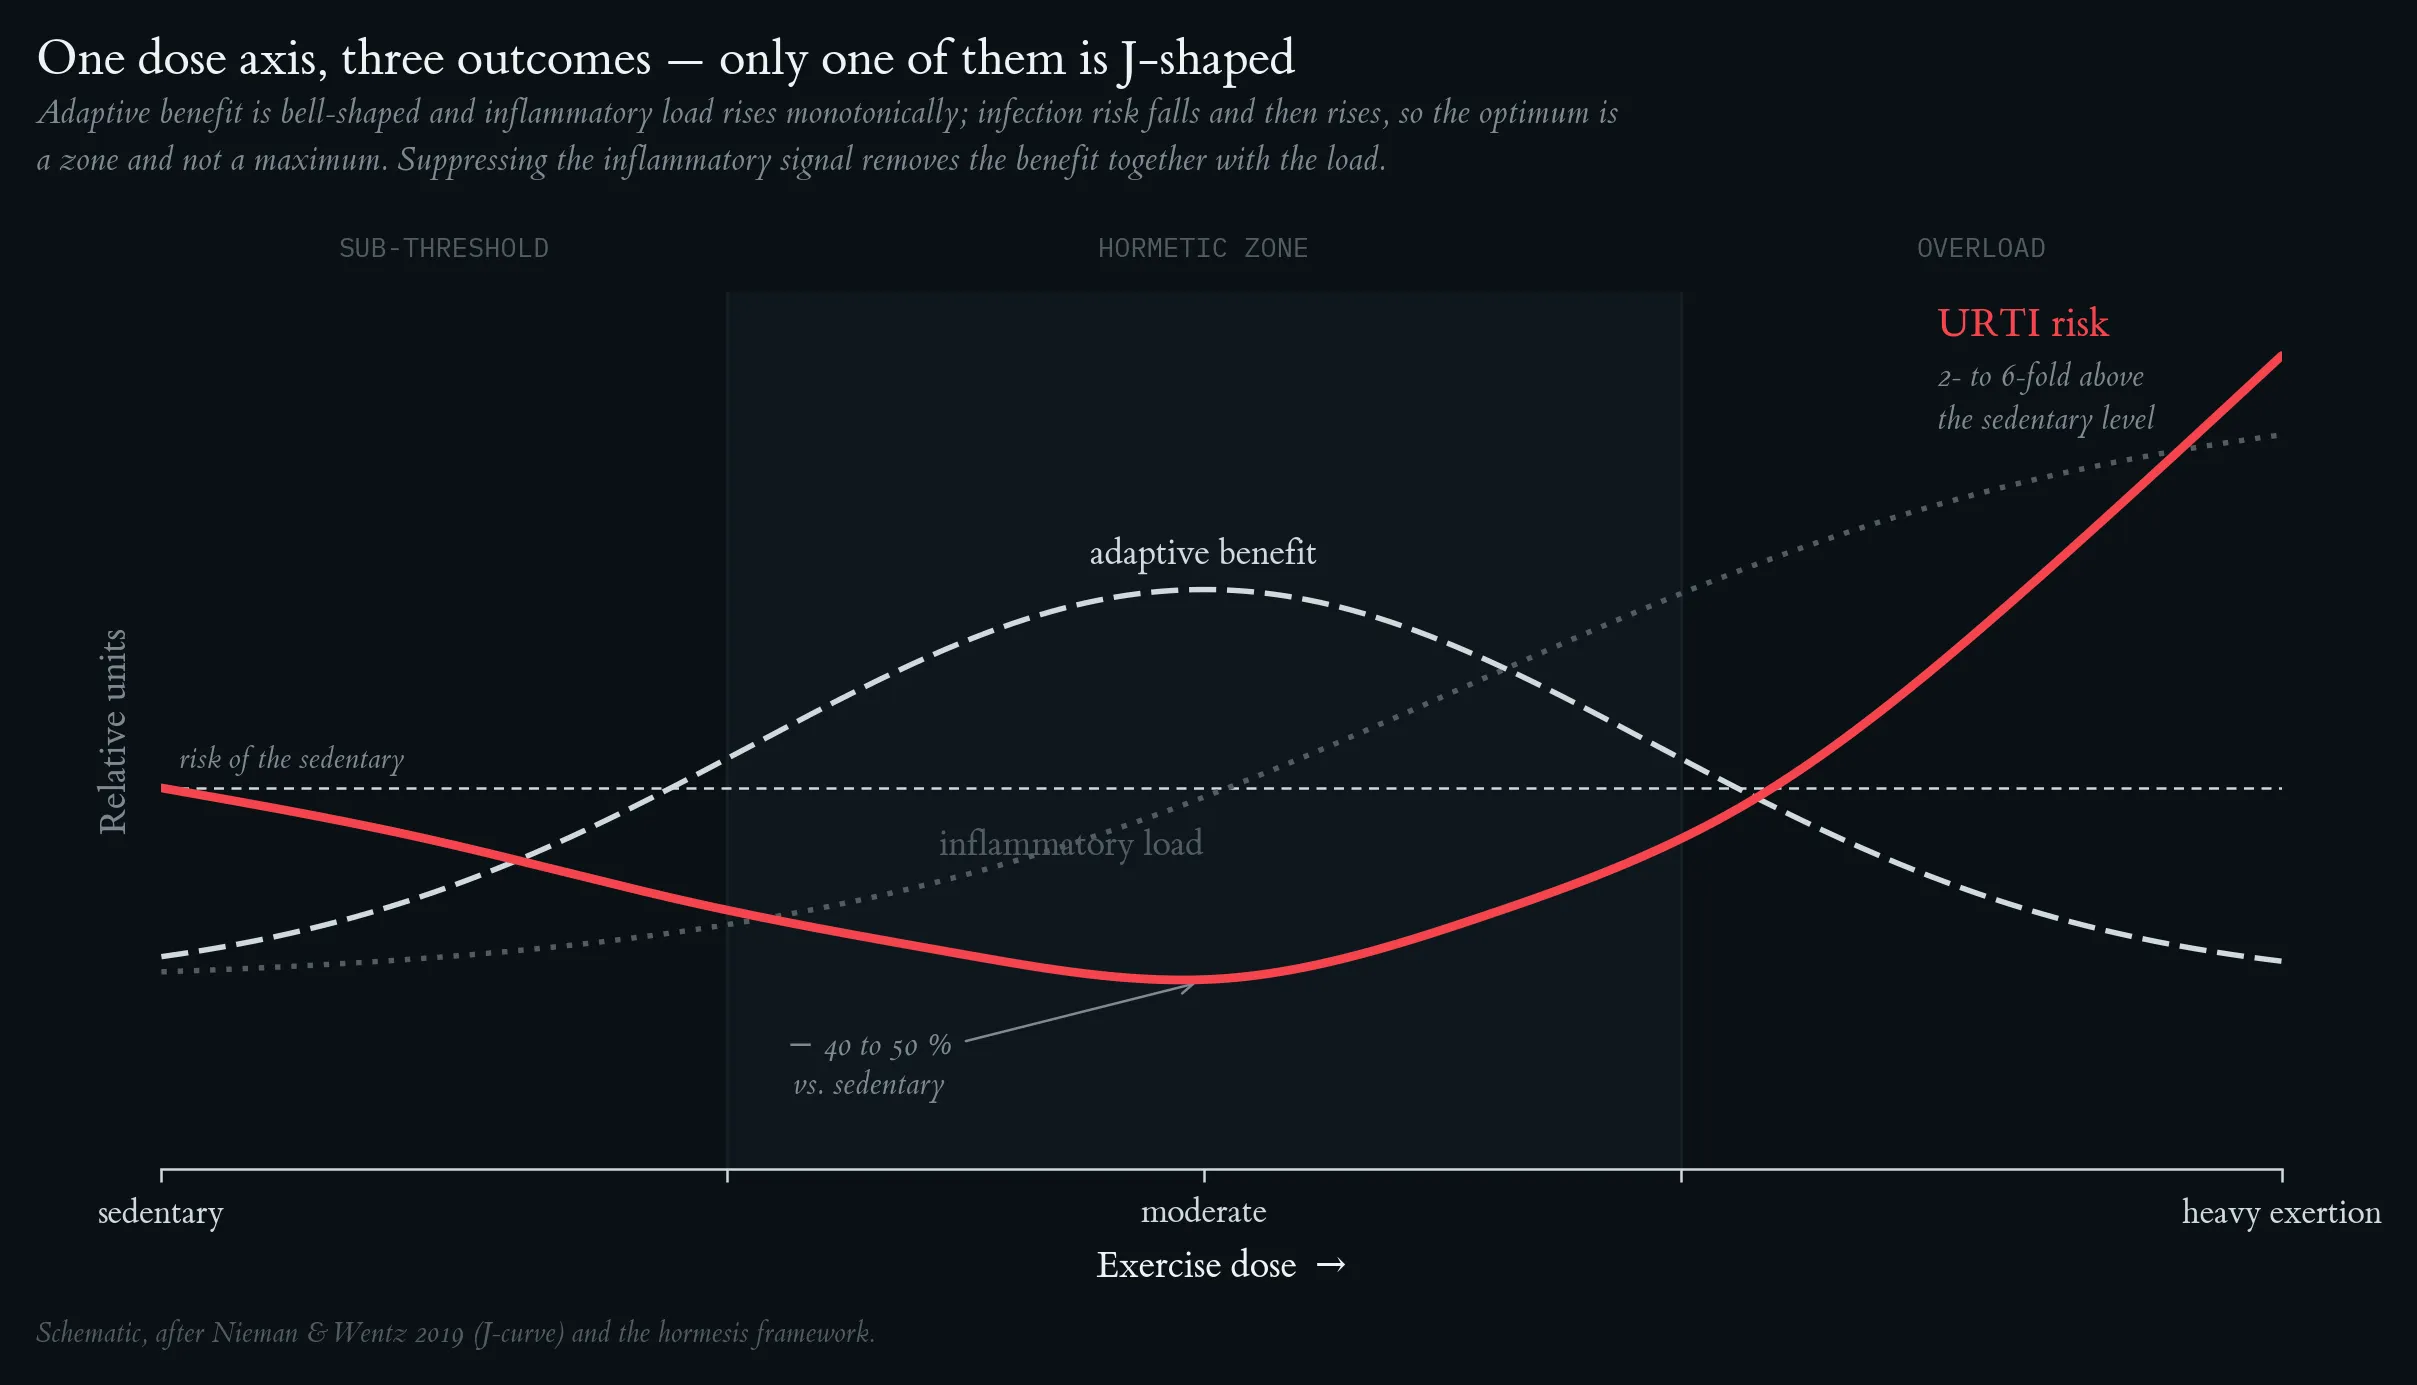
Hormesis dose-response: the full J-curve (URTI risk), bell-shaped adaptive benefit, and monotonically rising inflammatory load, with the three dose zones (sub-threshold / hormetic / overload) shaded.
Lecture 2: Exercise and Immune System, Limits of Performance, Energy Balance
Limits of performance with age: relating MET, V̇O₂max, physical-activity behaviour and mortality/morbidity [%] across the lifespan — from physical inactivity (1 MET, 3.5 mL·min⁻¹·kg⁻¹) to very fast running (~26 METs, ~90 mL·min⁻¹·kg⁻¹) — demonstrates age-dependent changes in maximal performance capacity.
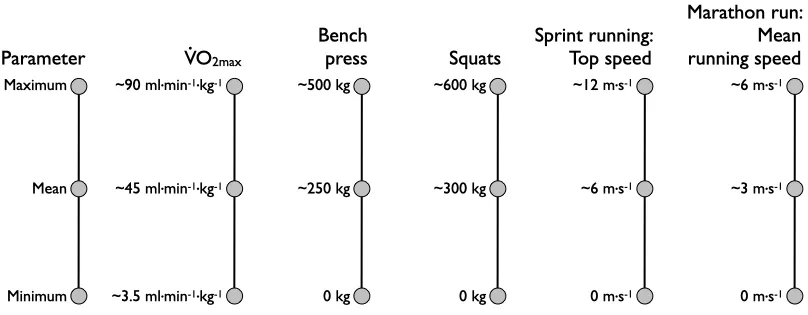
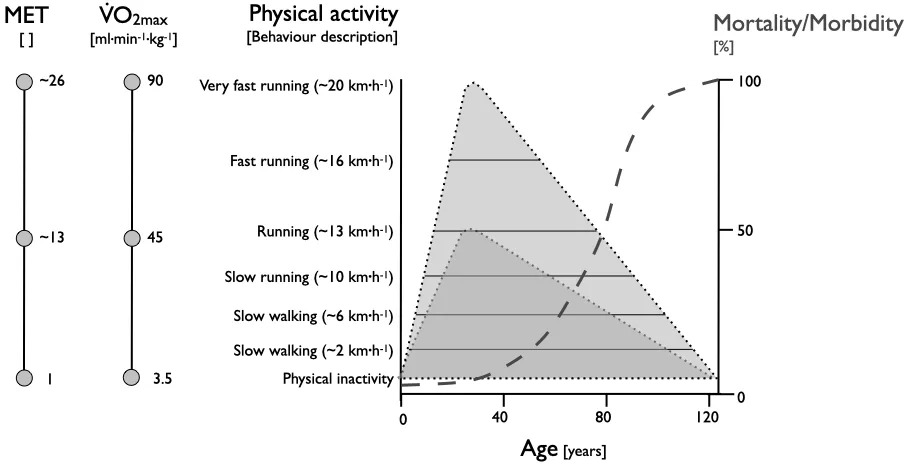
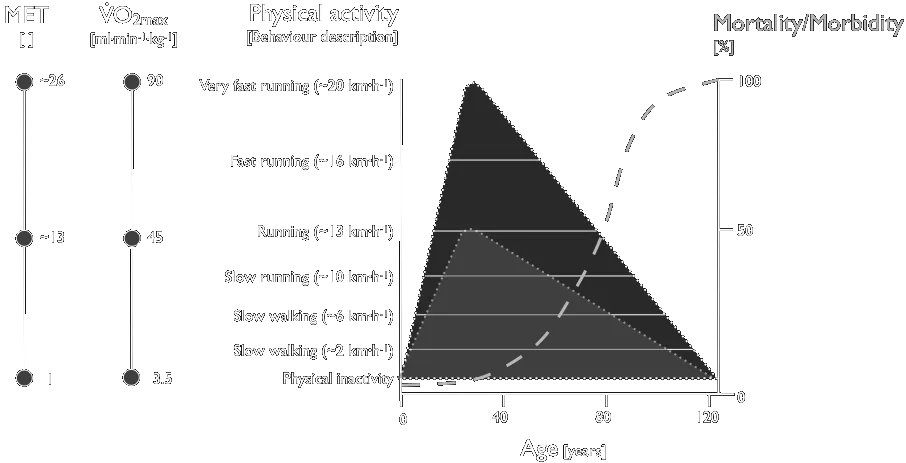
Limits of performance with age: relating MET, V̇O₂max, physical-activity behaviour and mortality/morbidity [%] across the lifespan — from physical inactivity (1 MET, 3.5 mL·min⁻¹·kg⁻¹) to very fast running (~26 METs, ~90 mL·min⁻¹·kg⁻¹) — demonstrates age-dependent changes in maximal performance capacity.
Adenosine-triphosphate (ATP) flow rates versus time. P — cycling performance on a bicycle ergometer; RPE — ratings of perceived exertion (Borg scale 6–20).
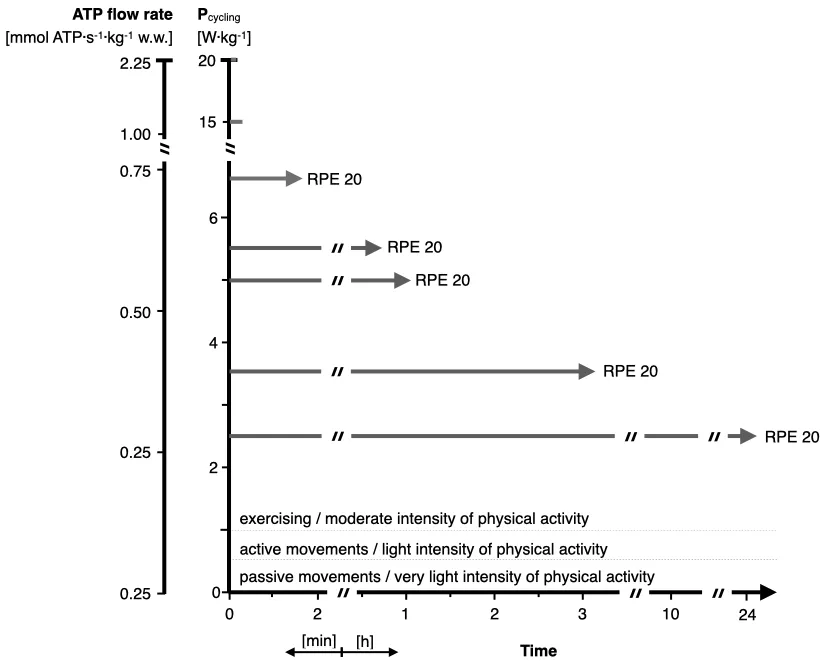
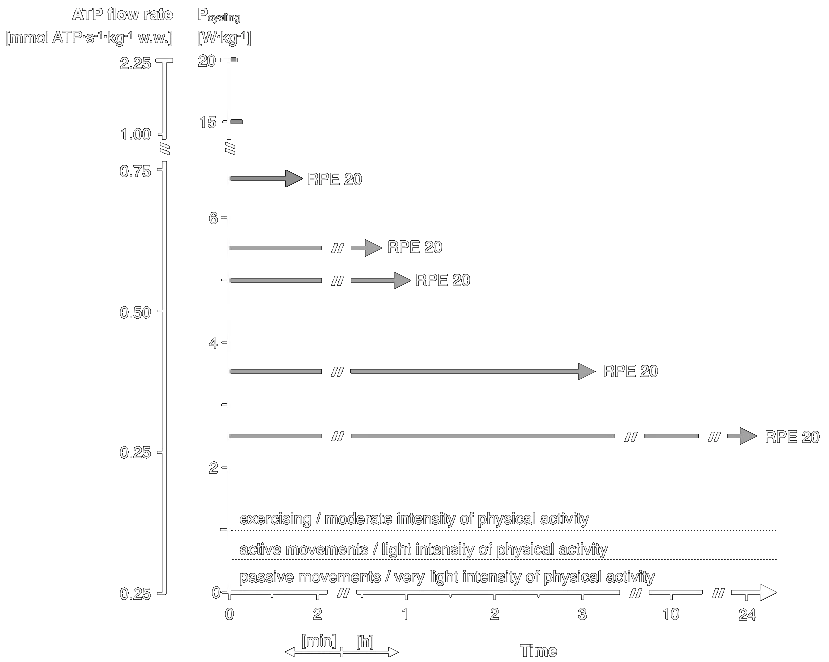
Adenosine-triphosphate (ATP) flow rates versus time. P — cycling performance on a bicycle ergometer; RPE — ratings of perceived exertion (Borg scale 6–20).
Time course of energy generation.
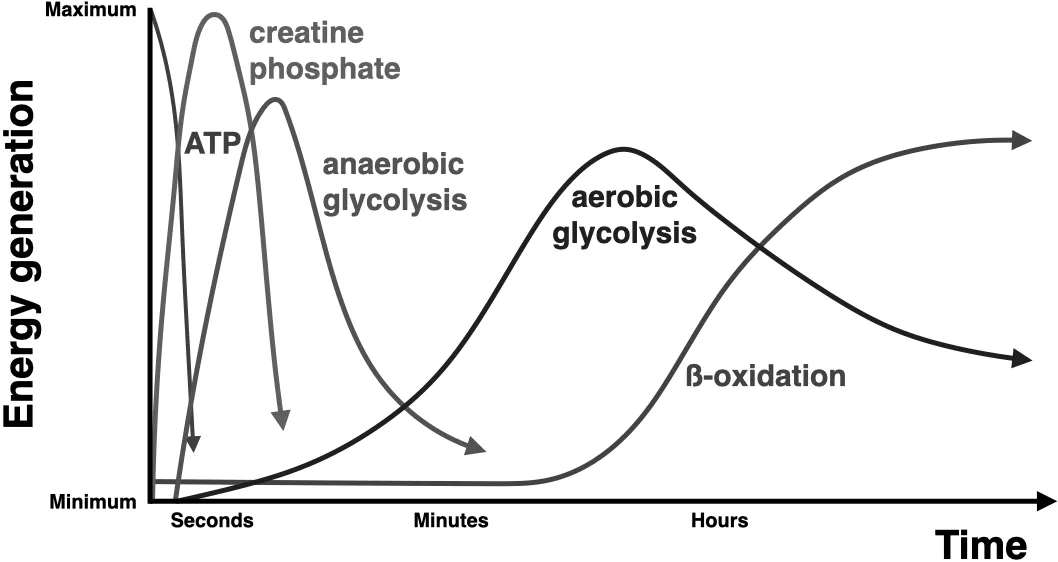
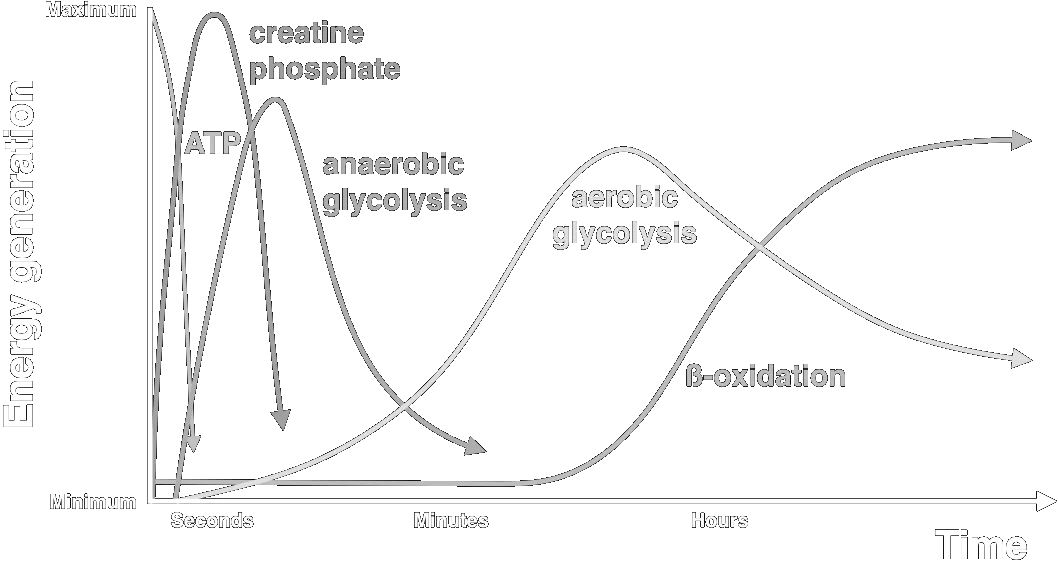
Time course of energy generation.
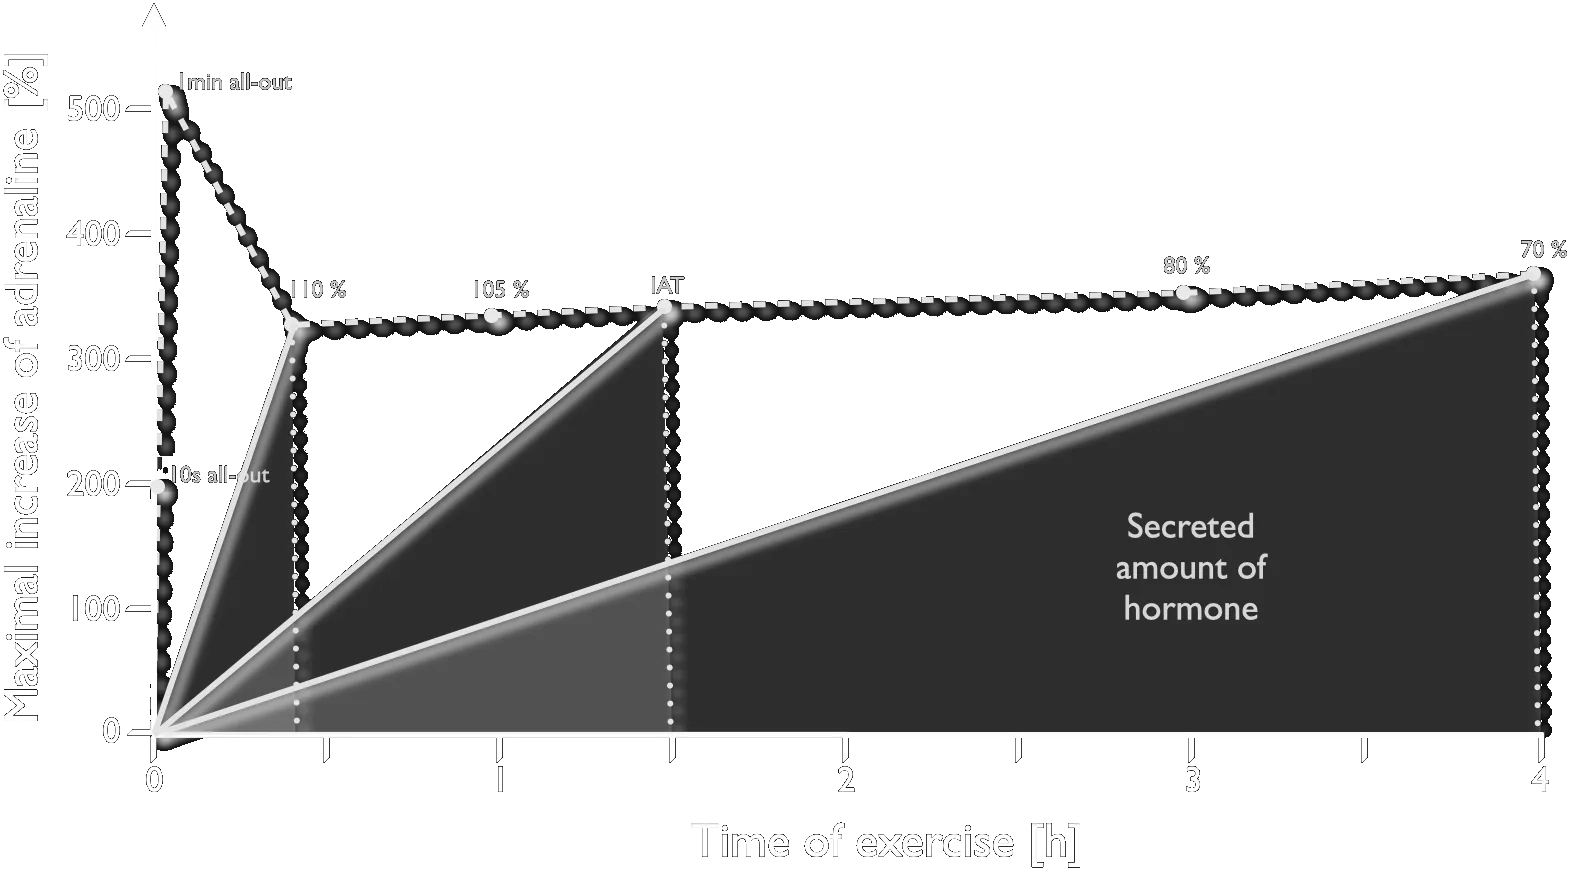
Cycle-ergometer exercise of different intensities and durations, showing performance, lactate generation and hormone secretion built up step by step. Male subjects with a V̇O₂max of 60–65 mL·min⁻¹·kg⁻¹.
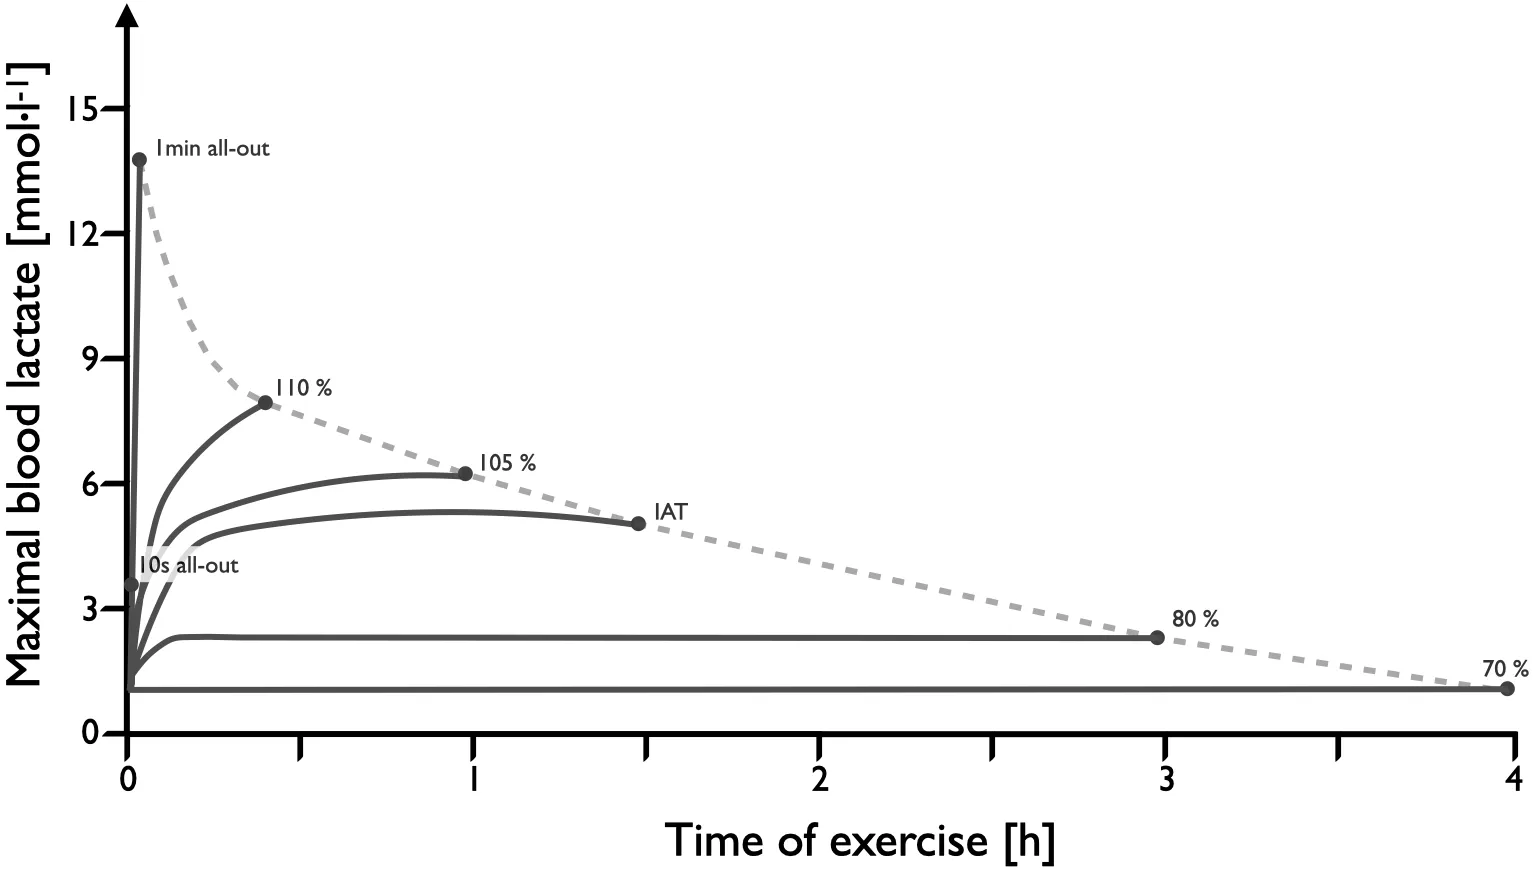
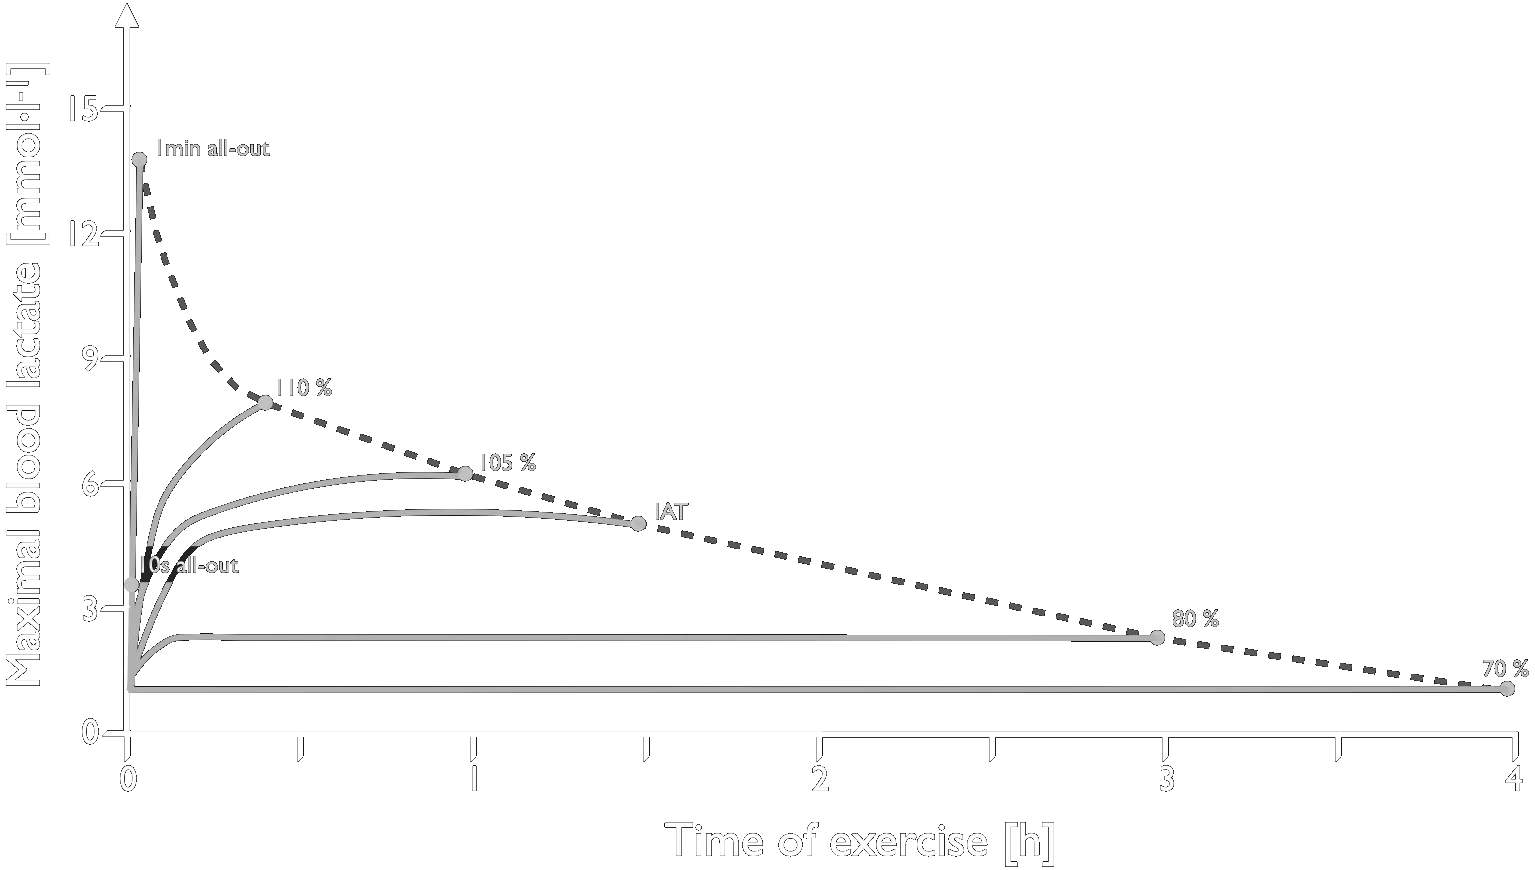
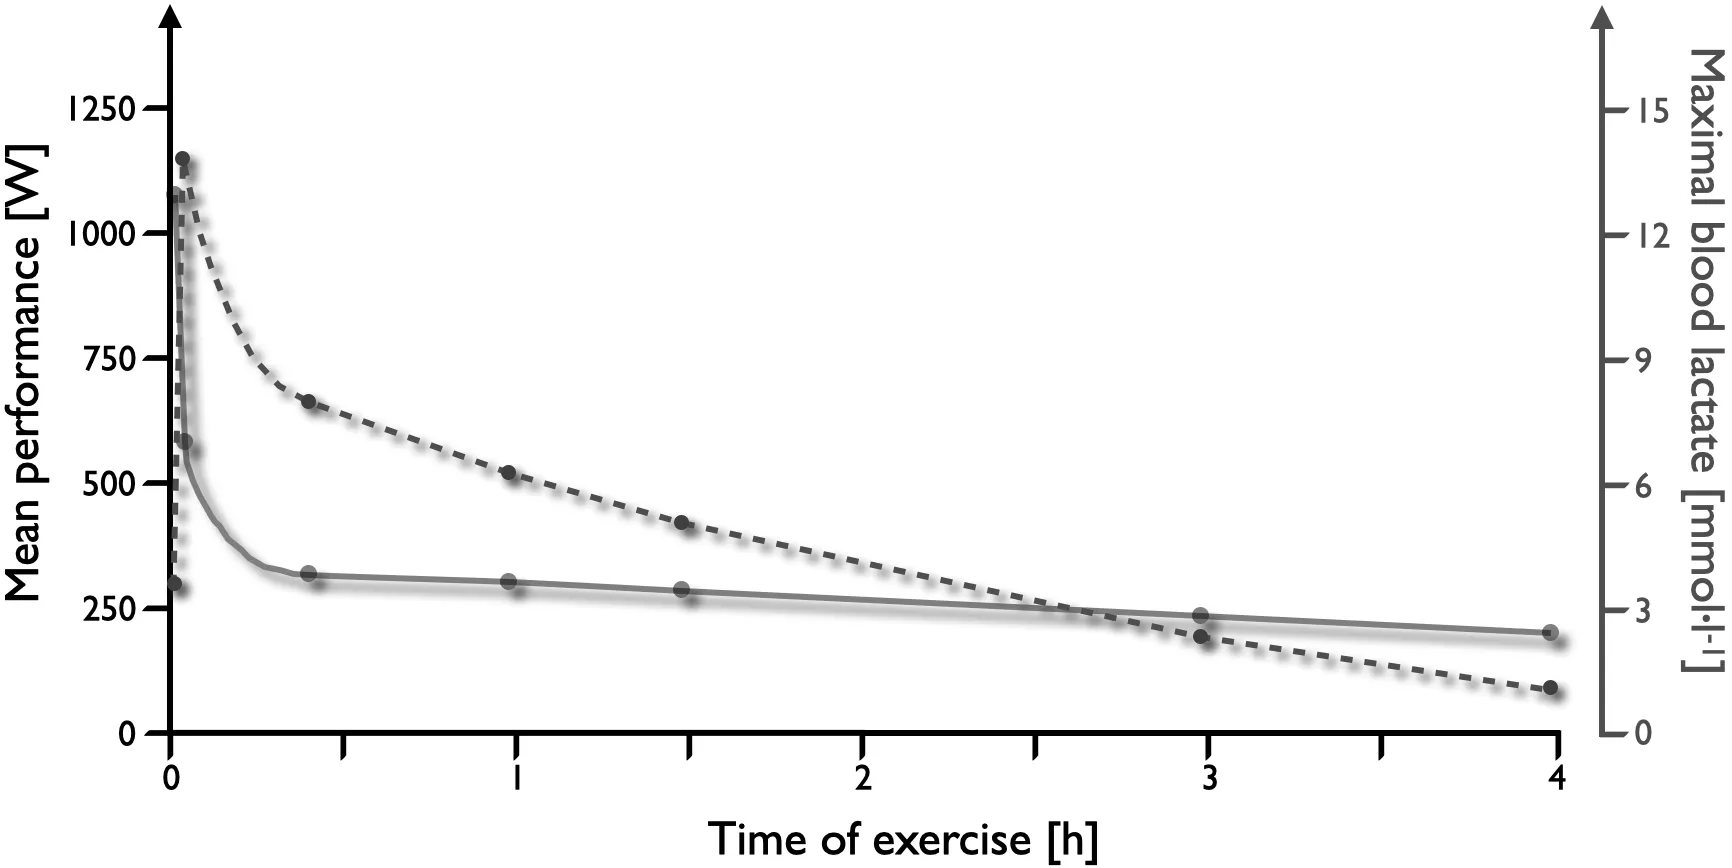
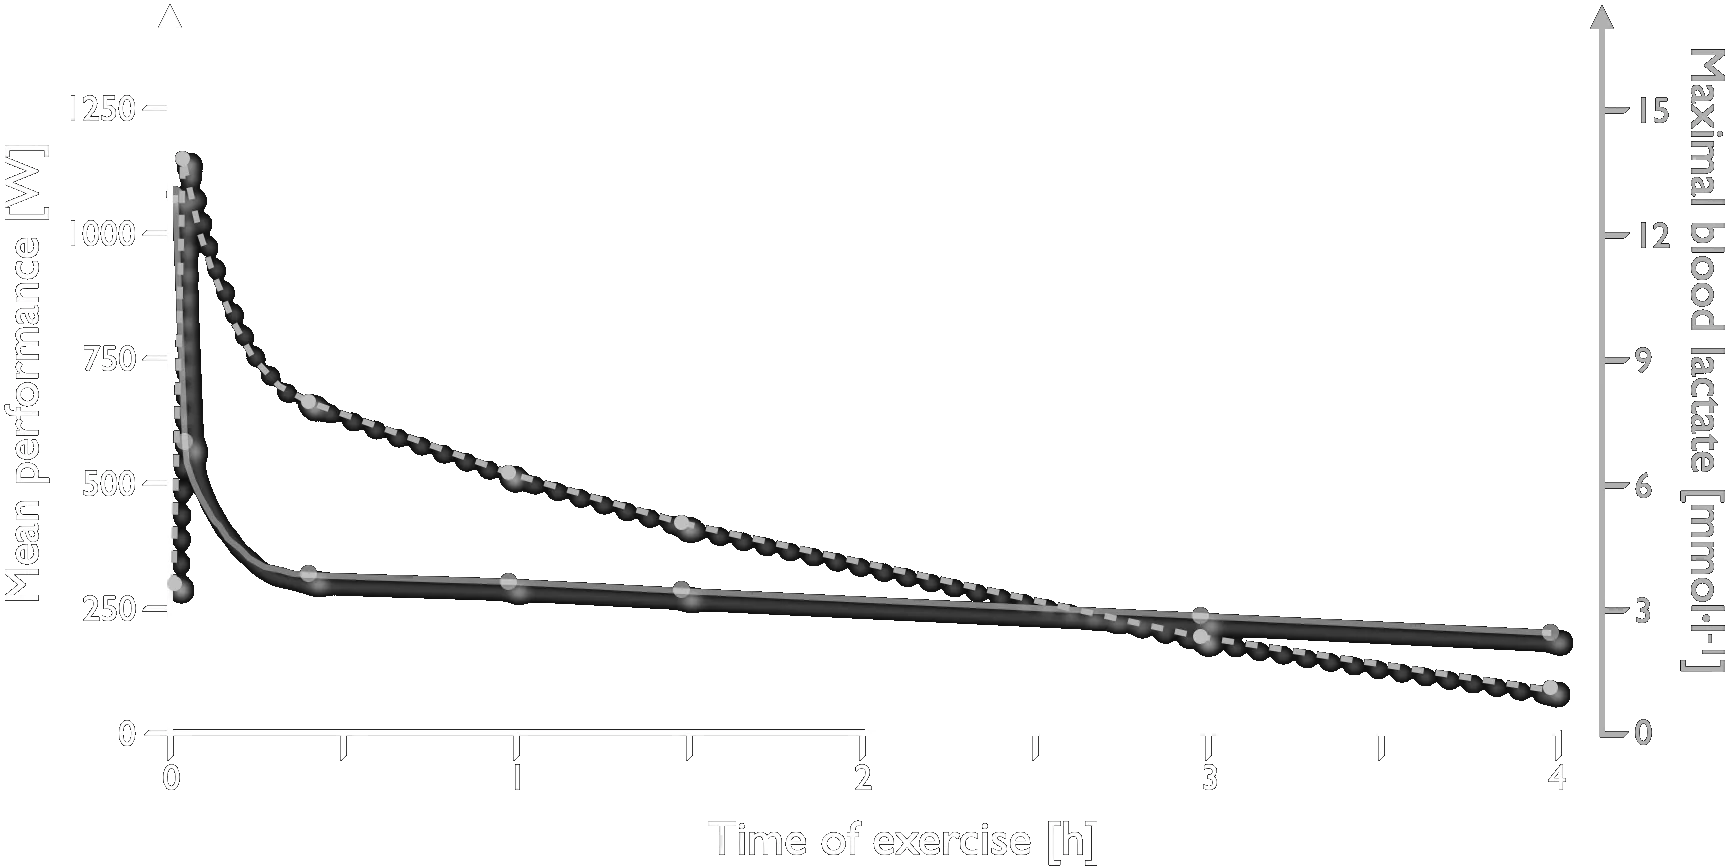
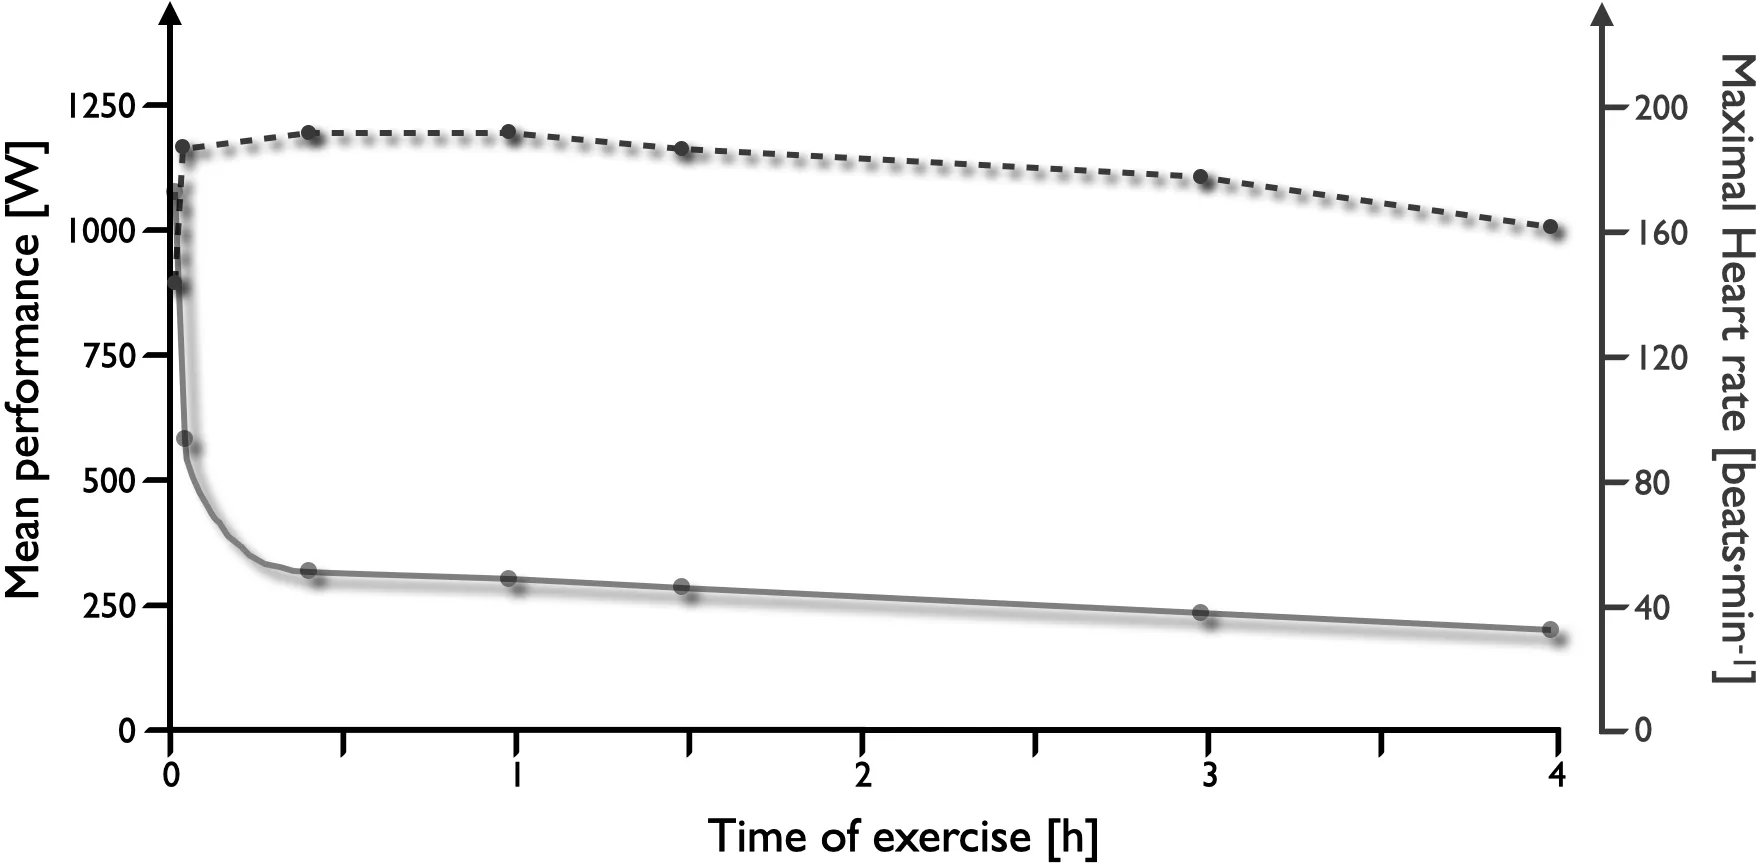
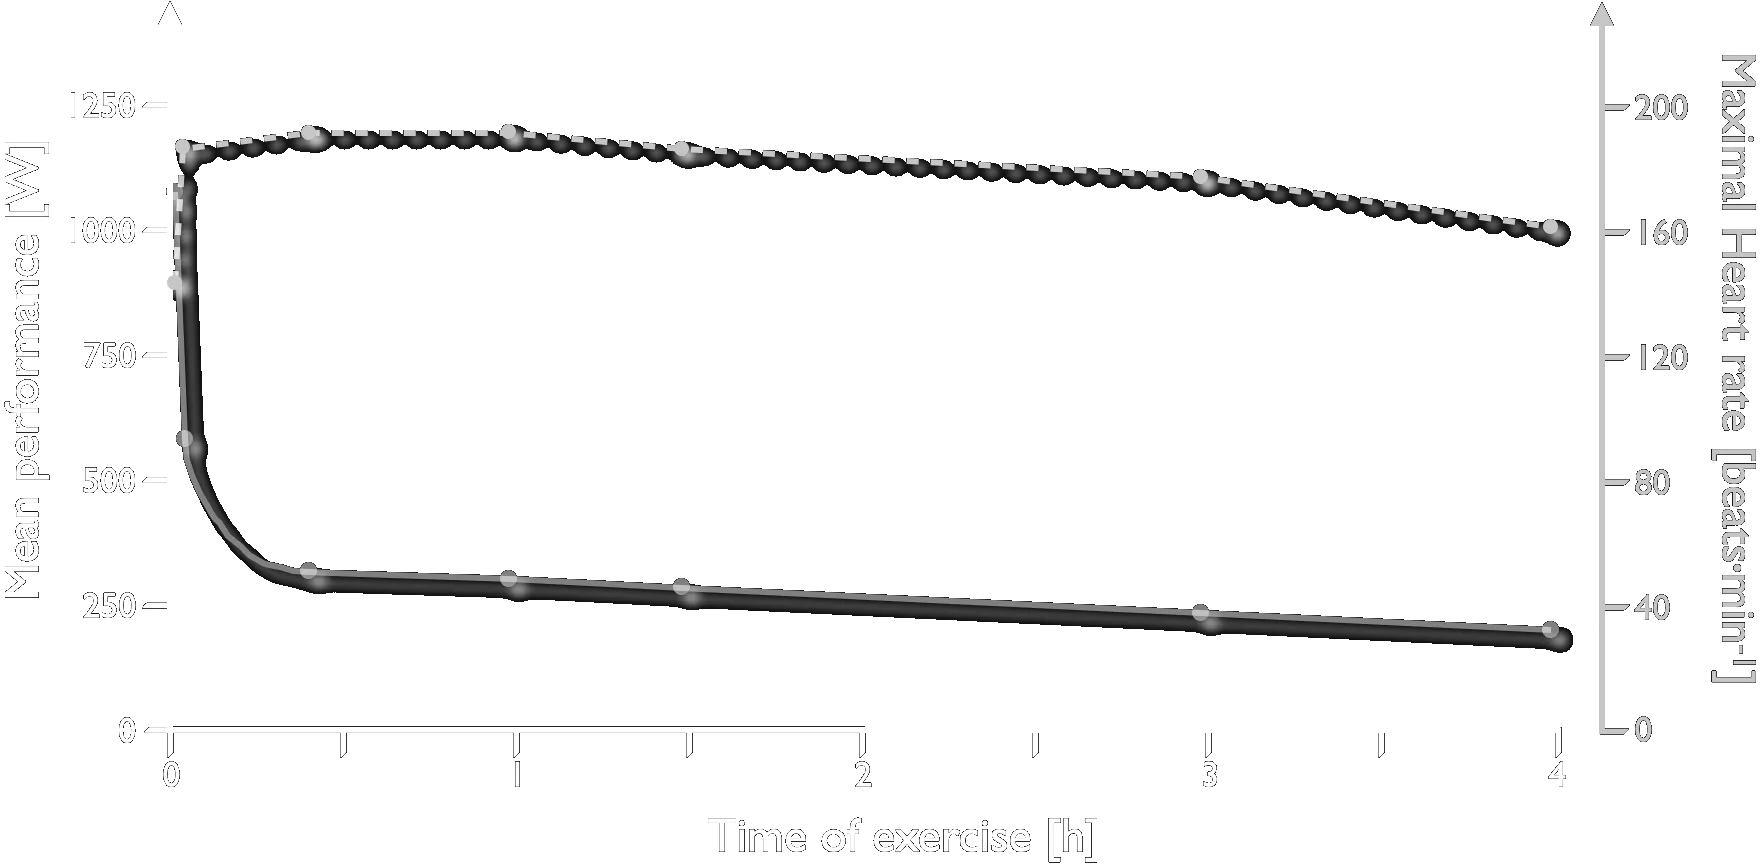
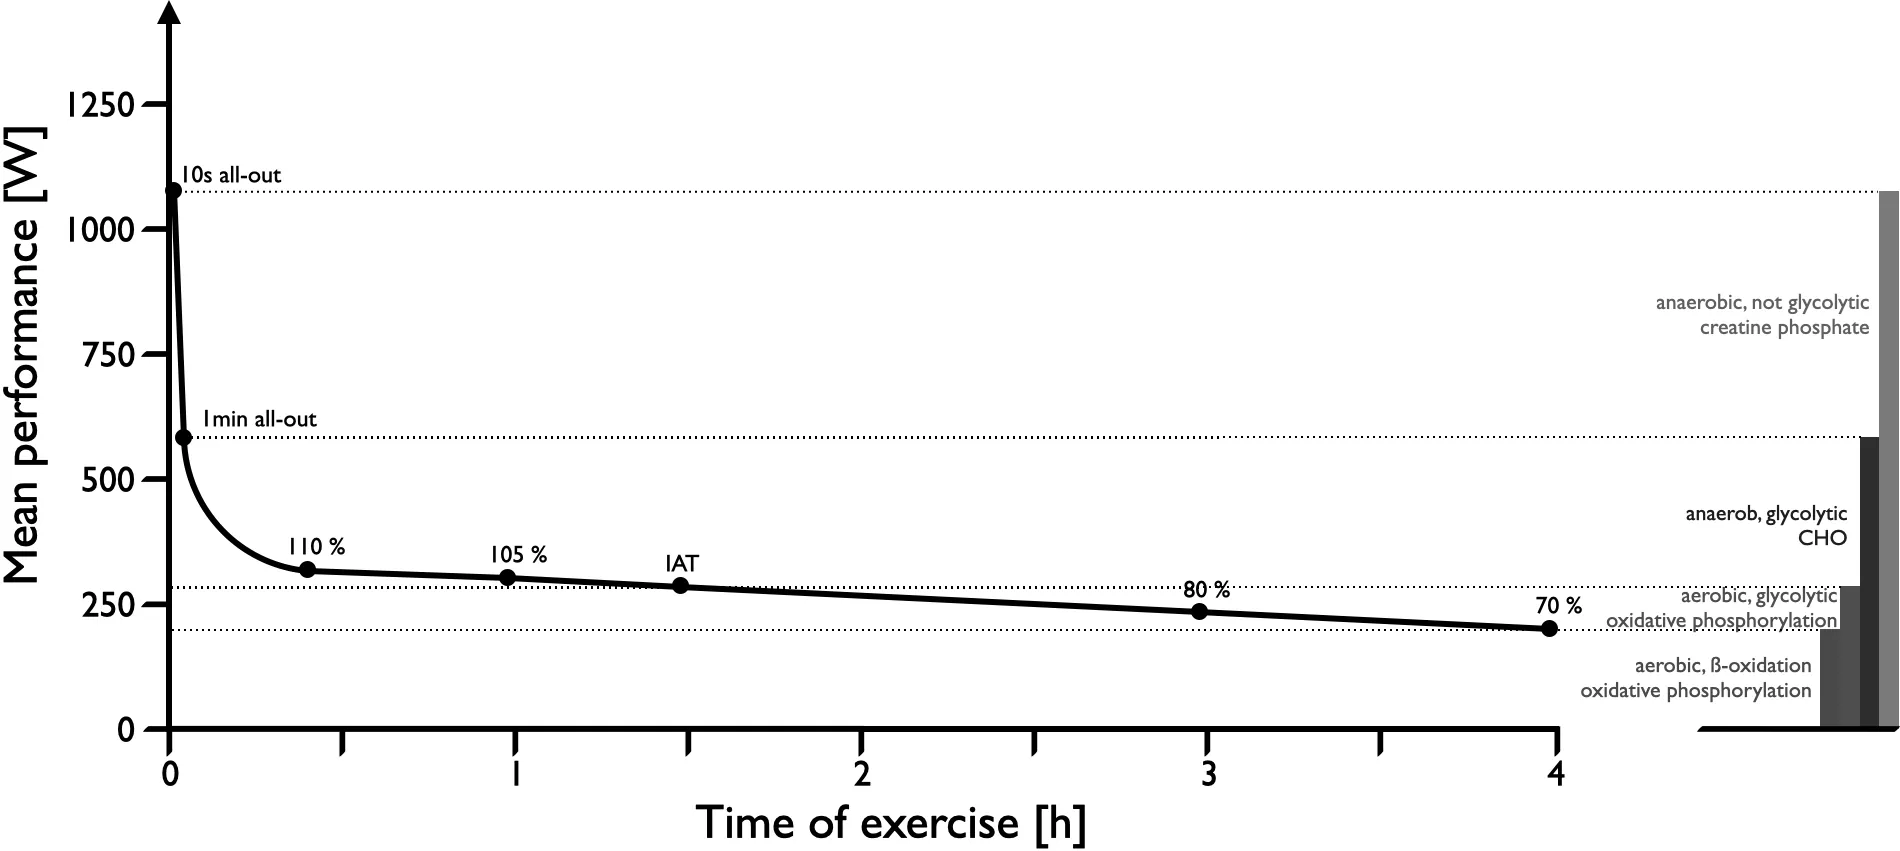
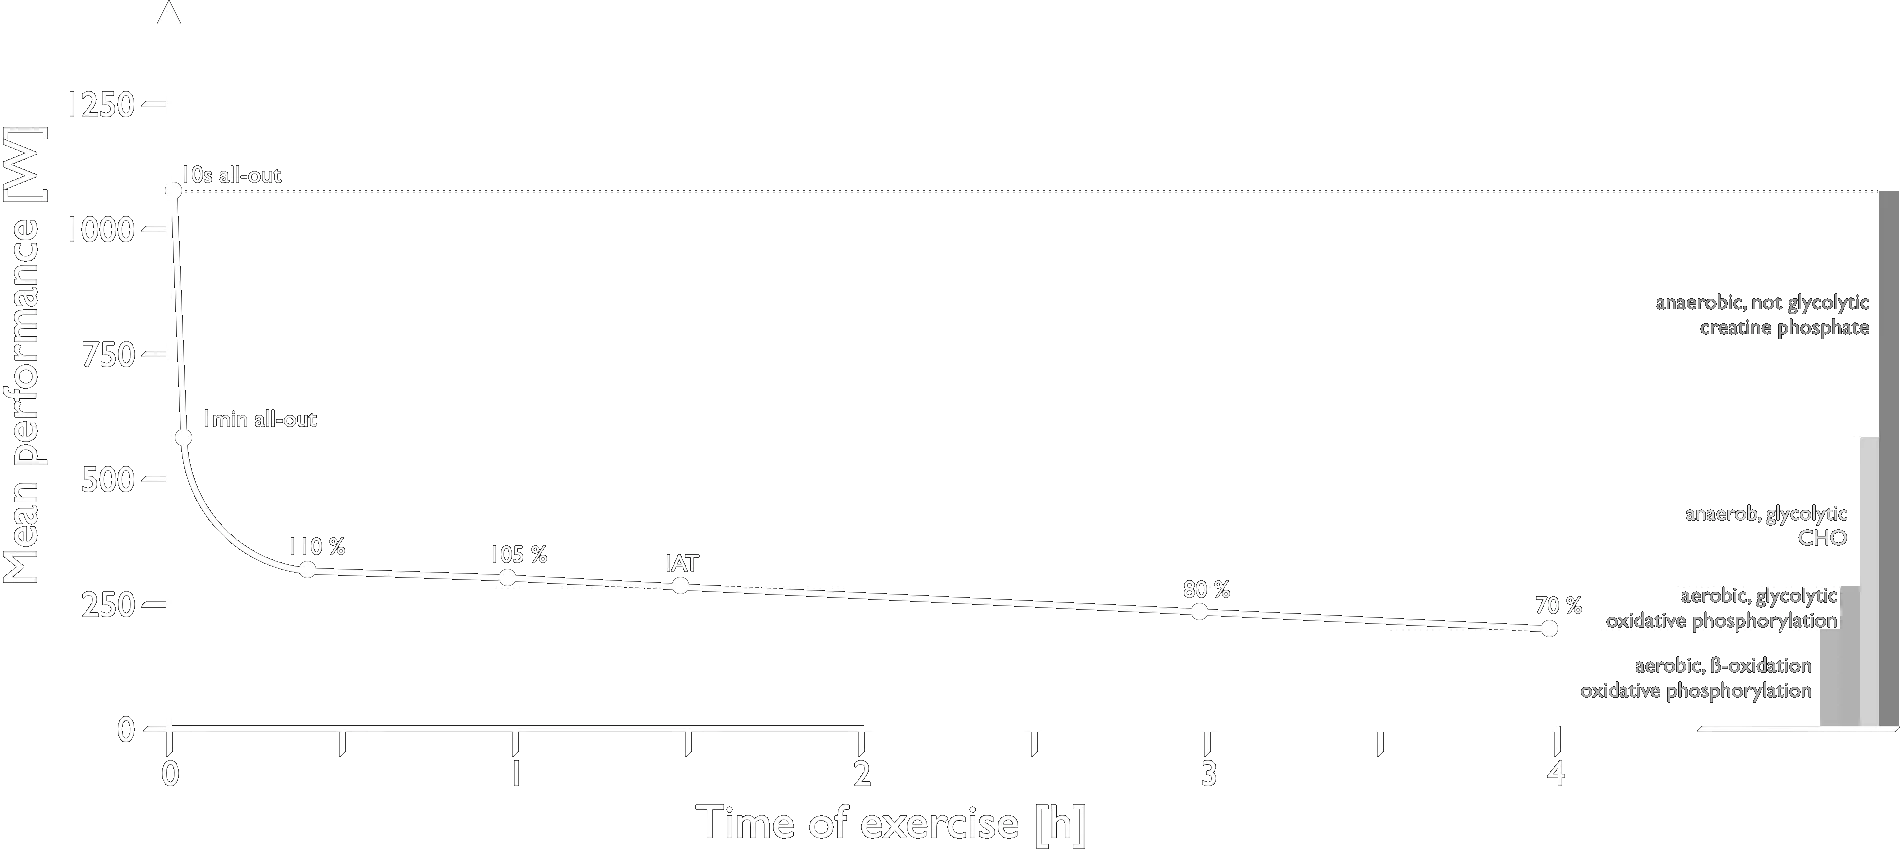
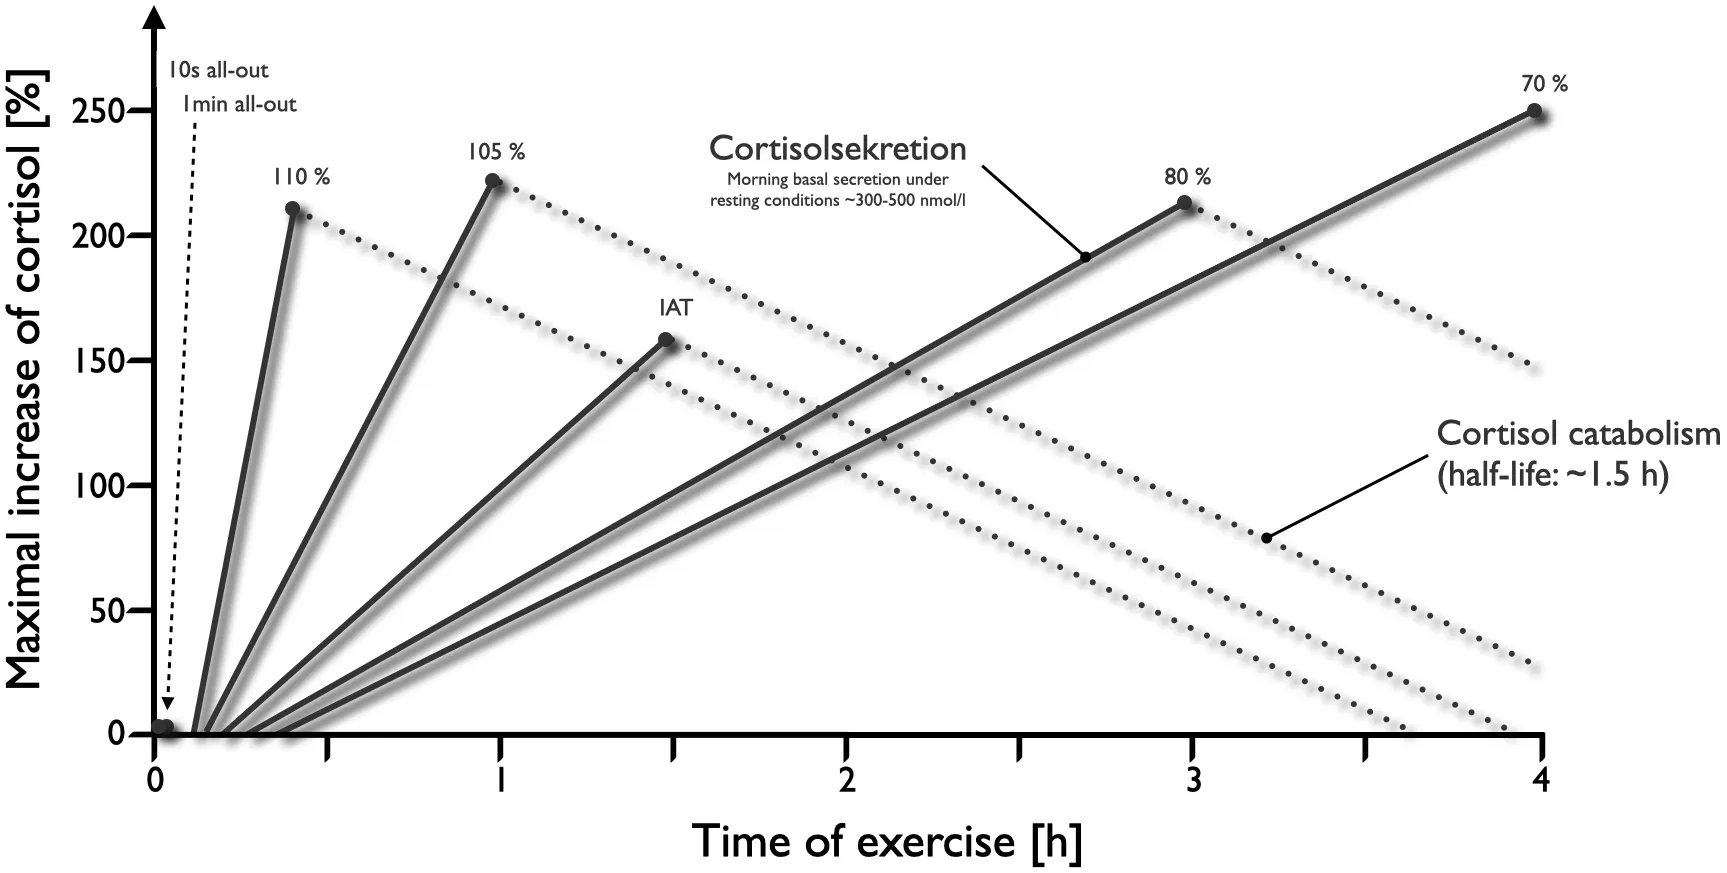
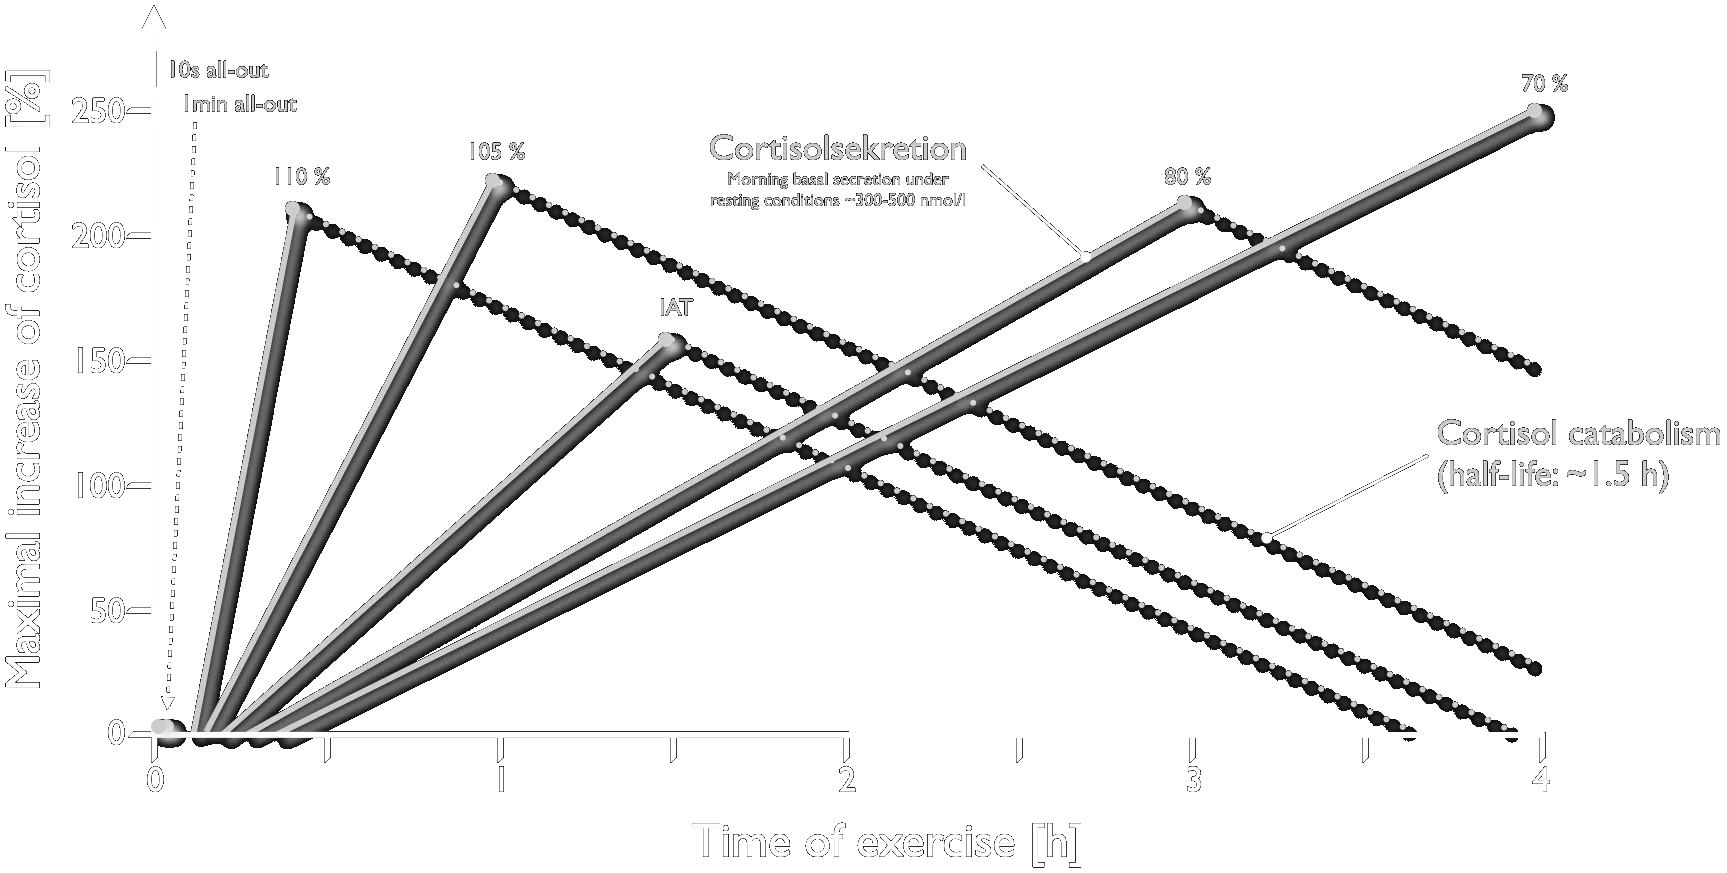
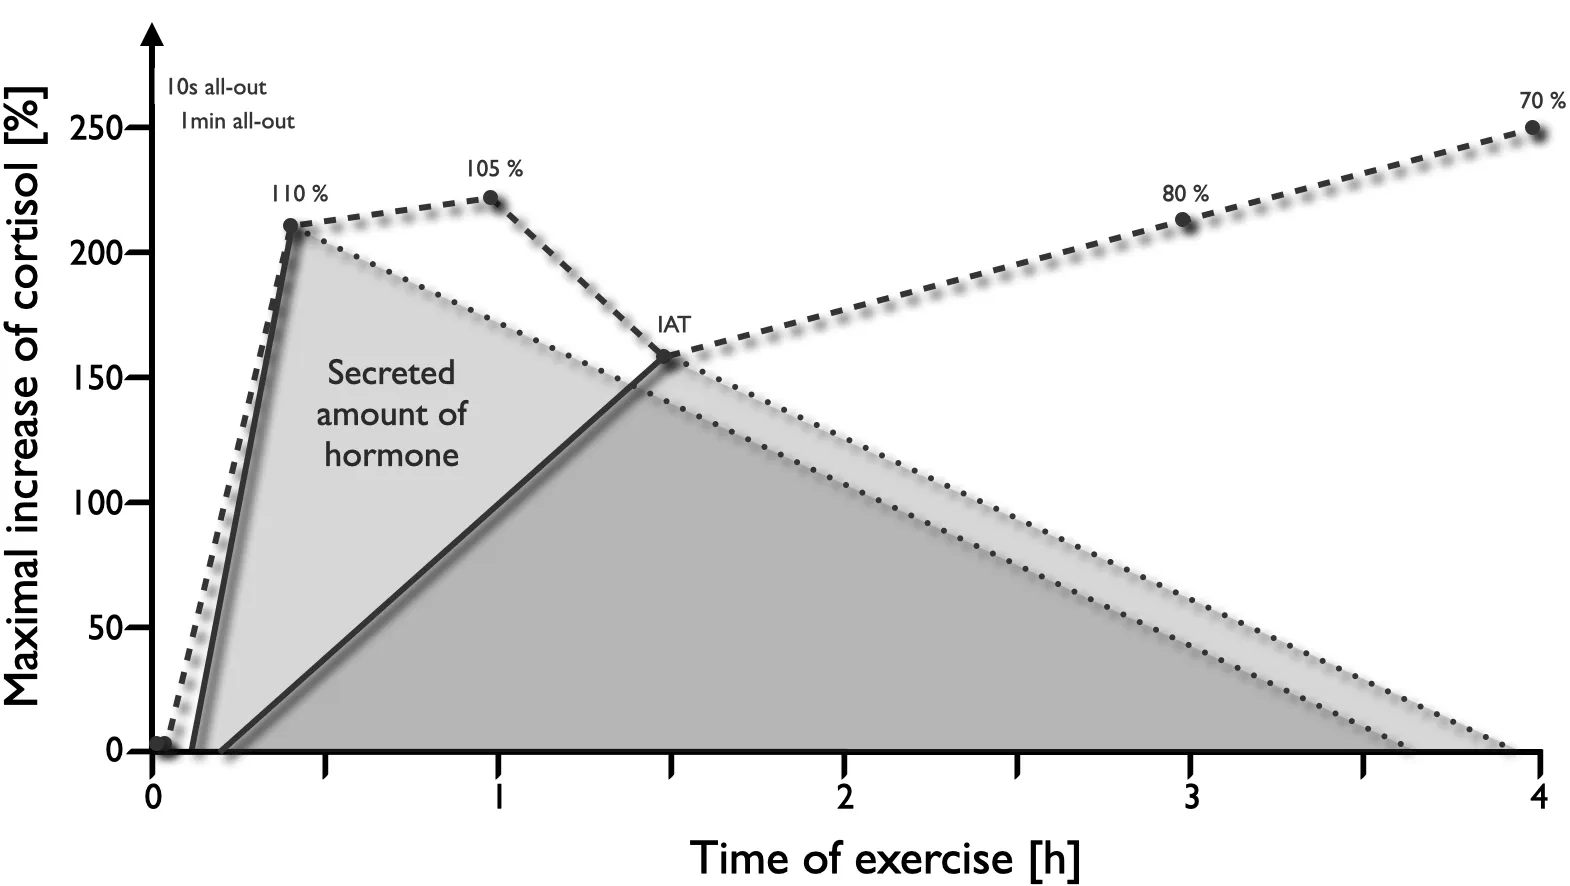
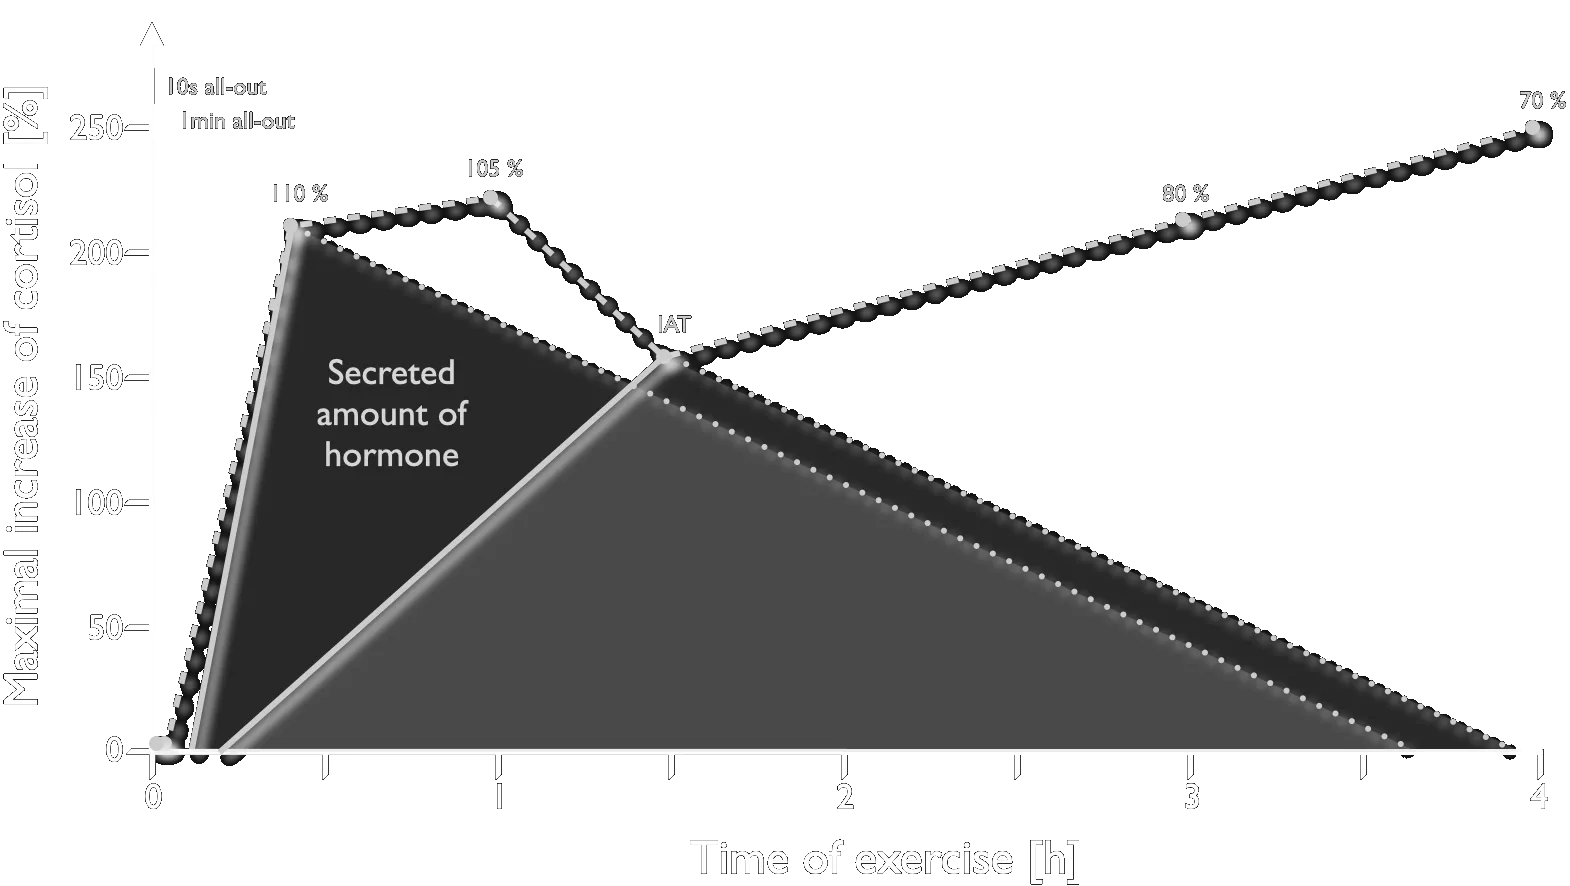
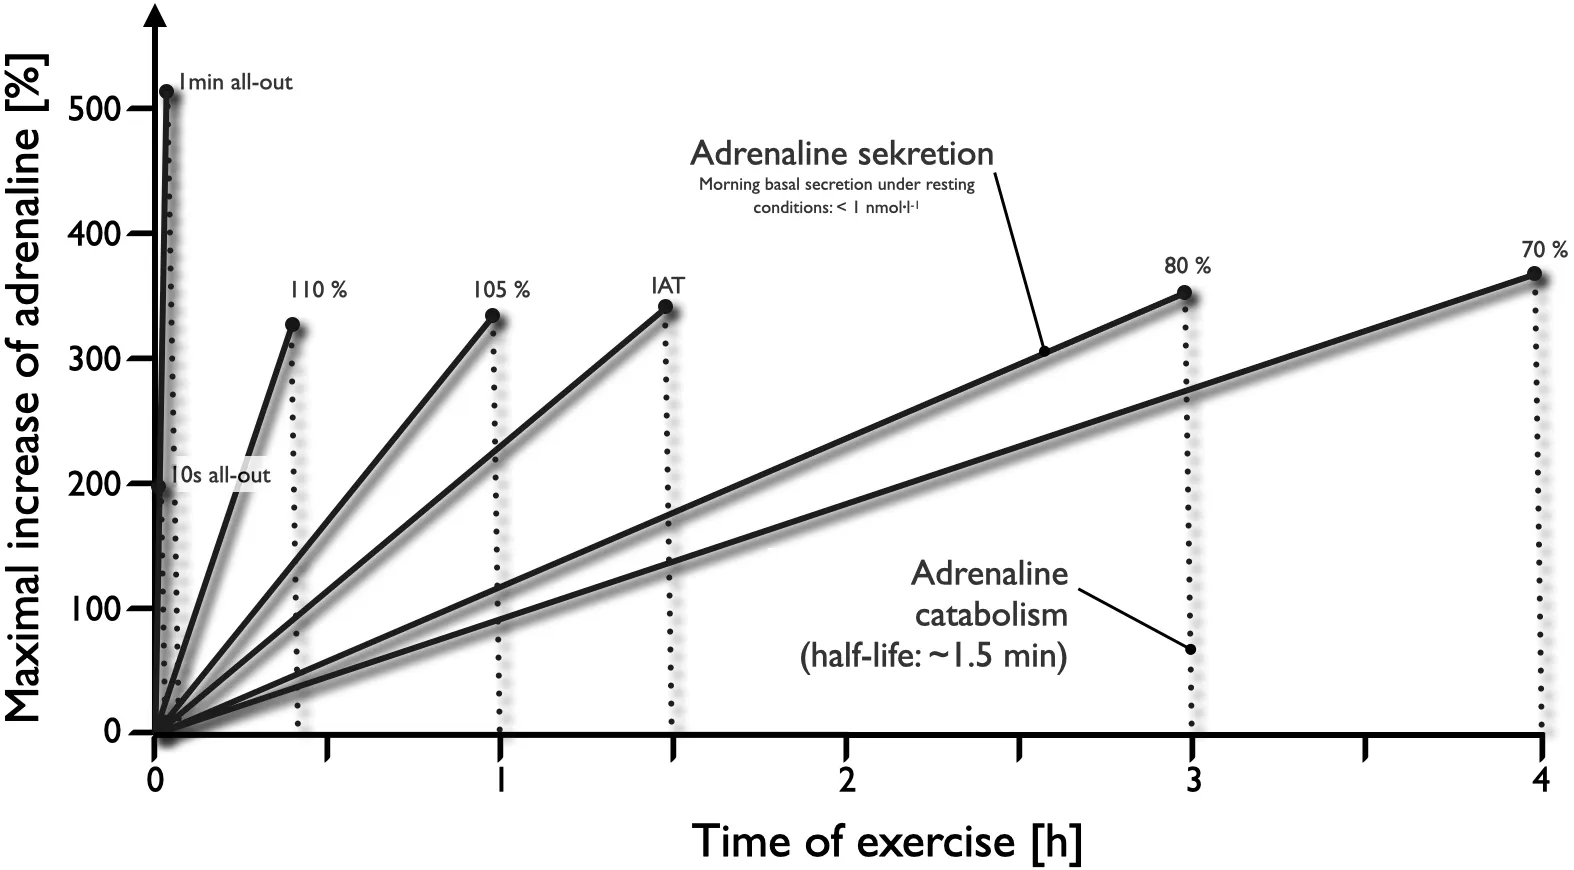
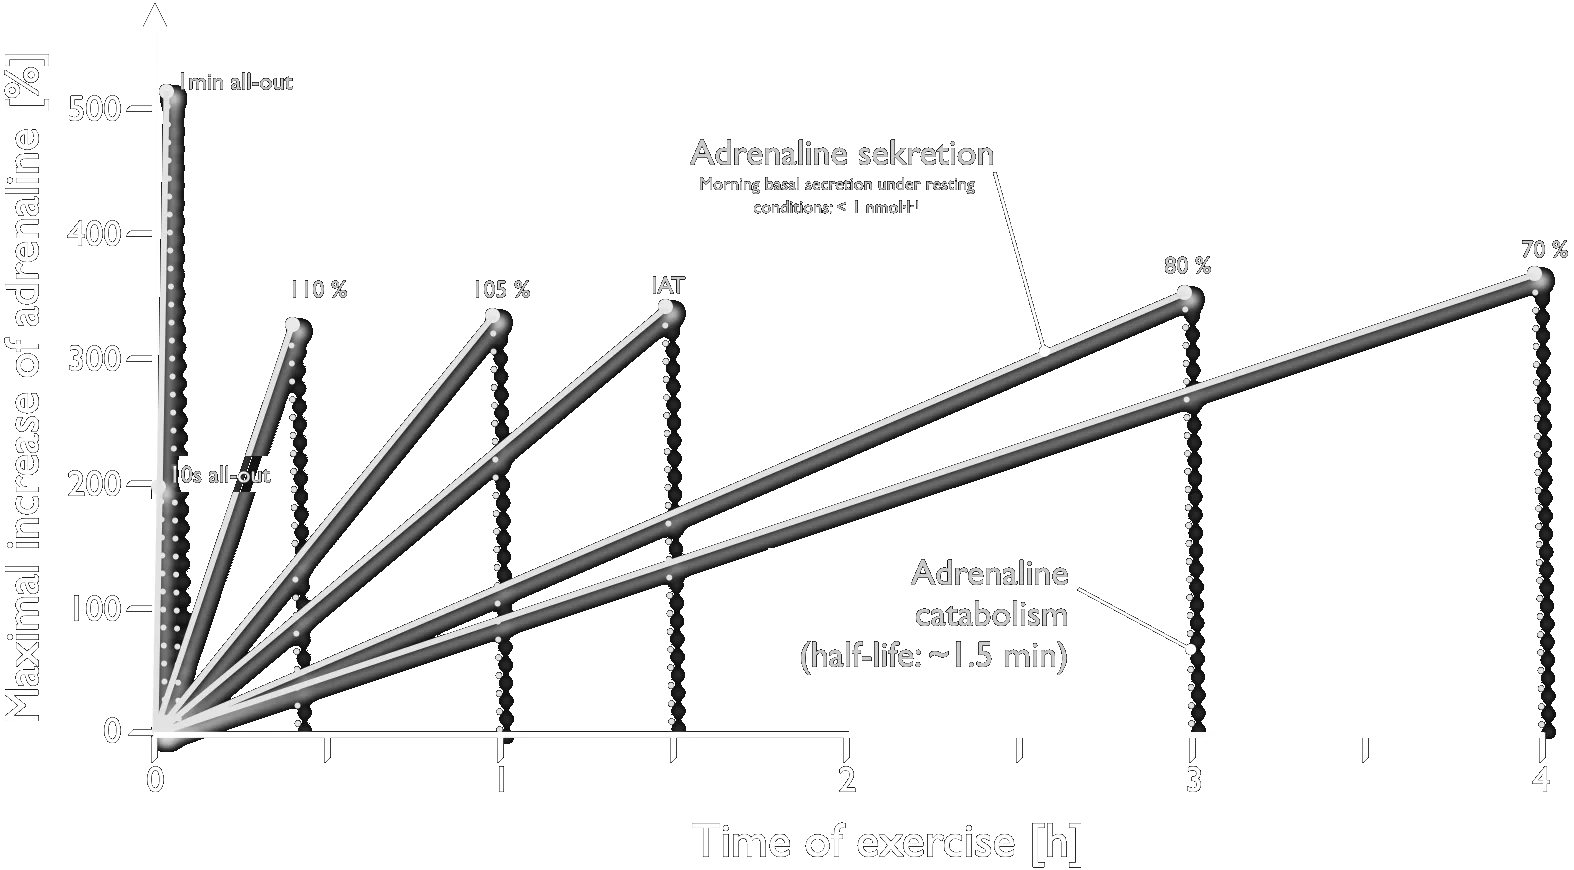
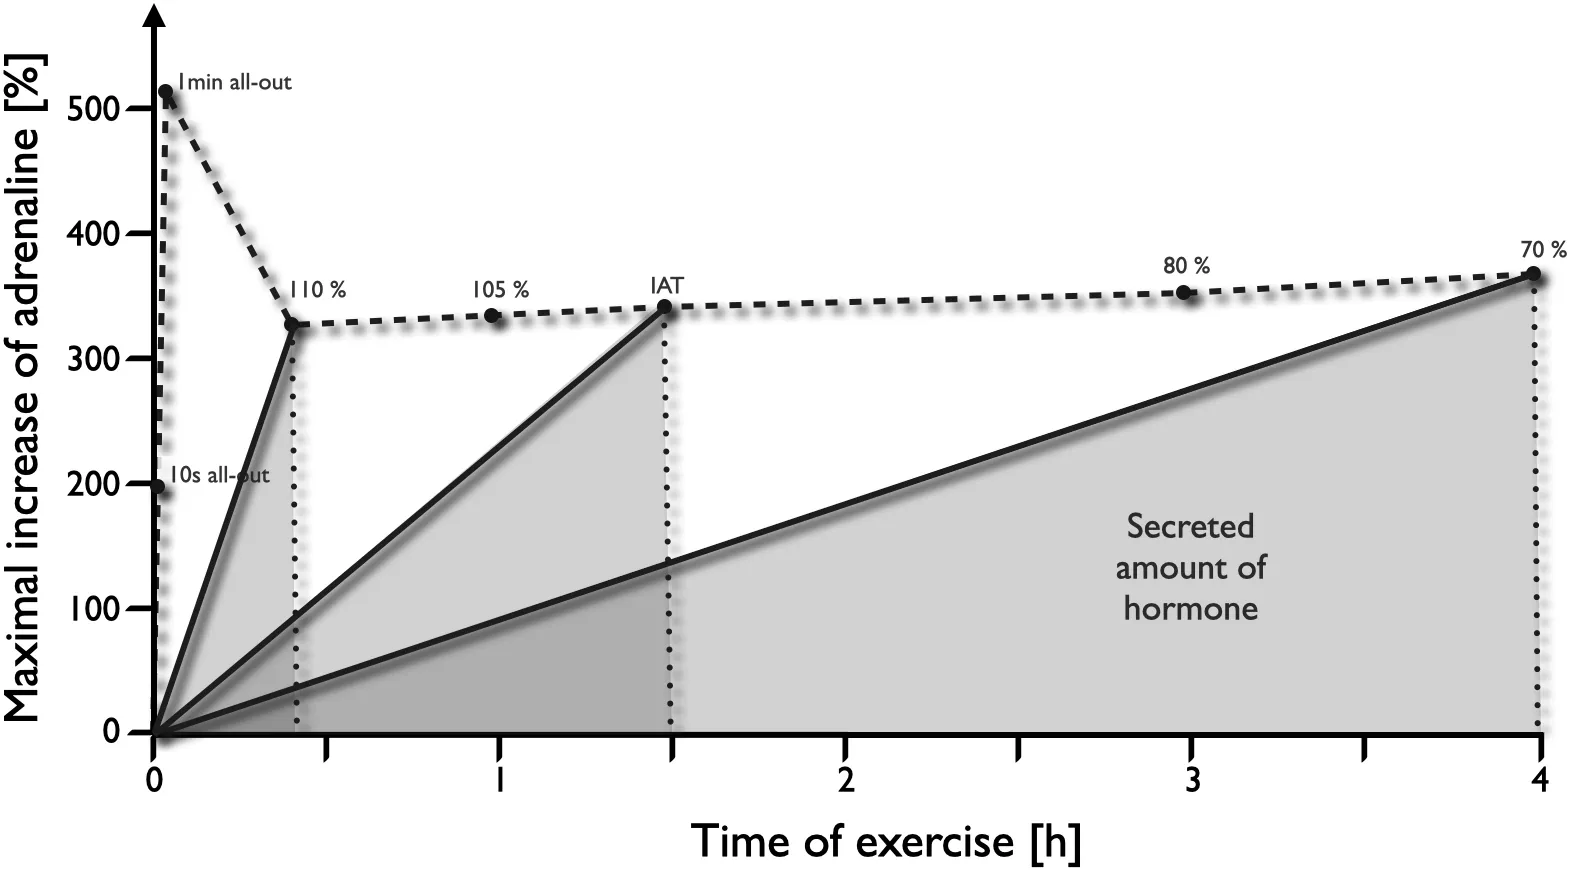
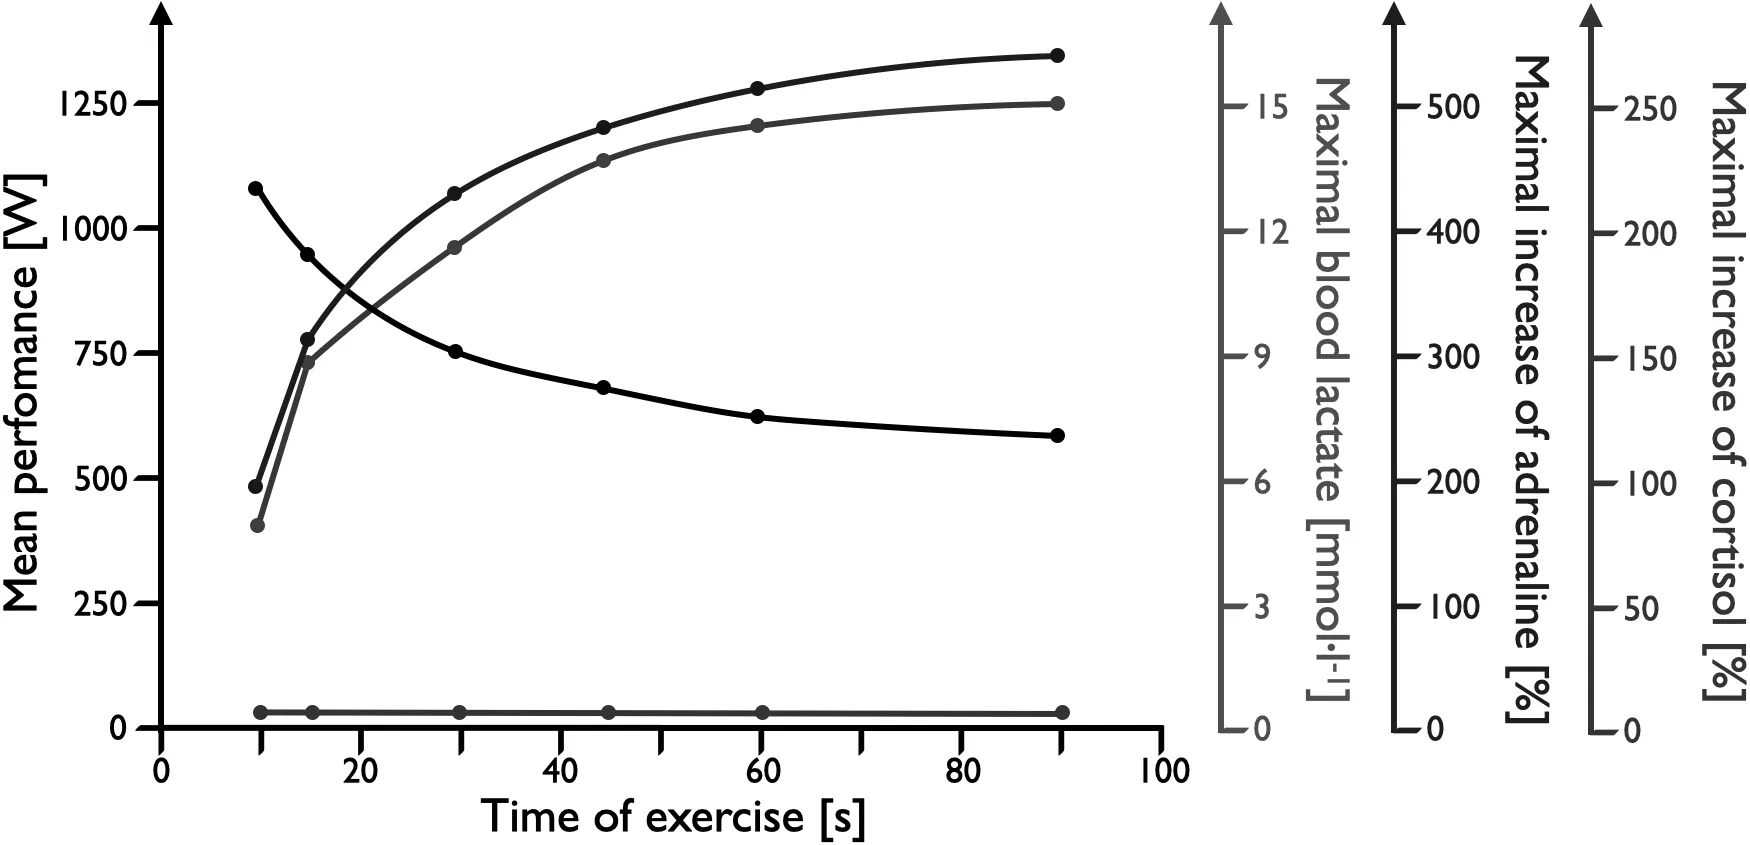
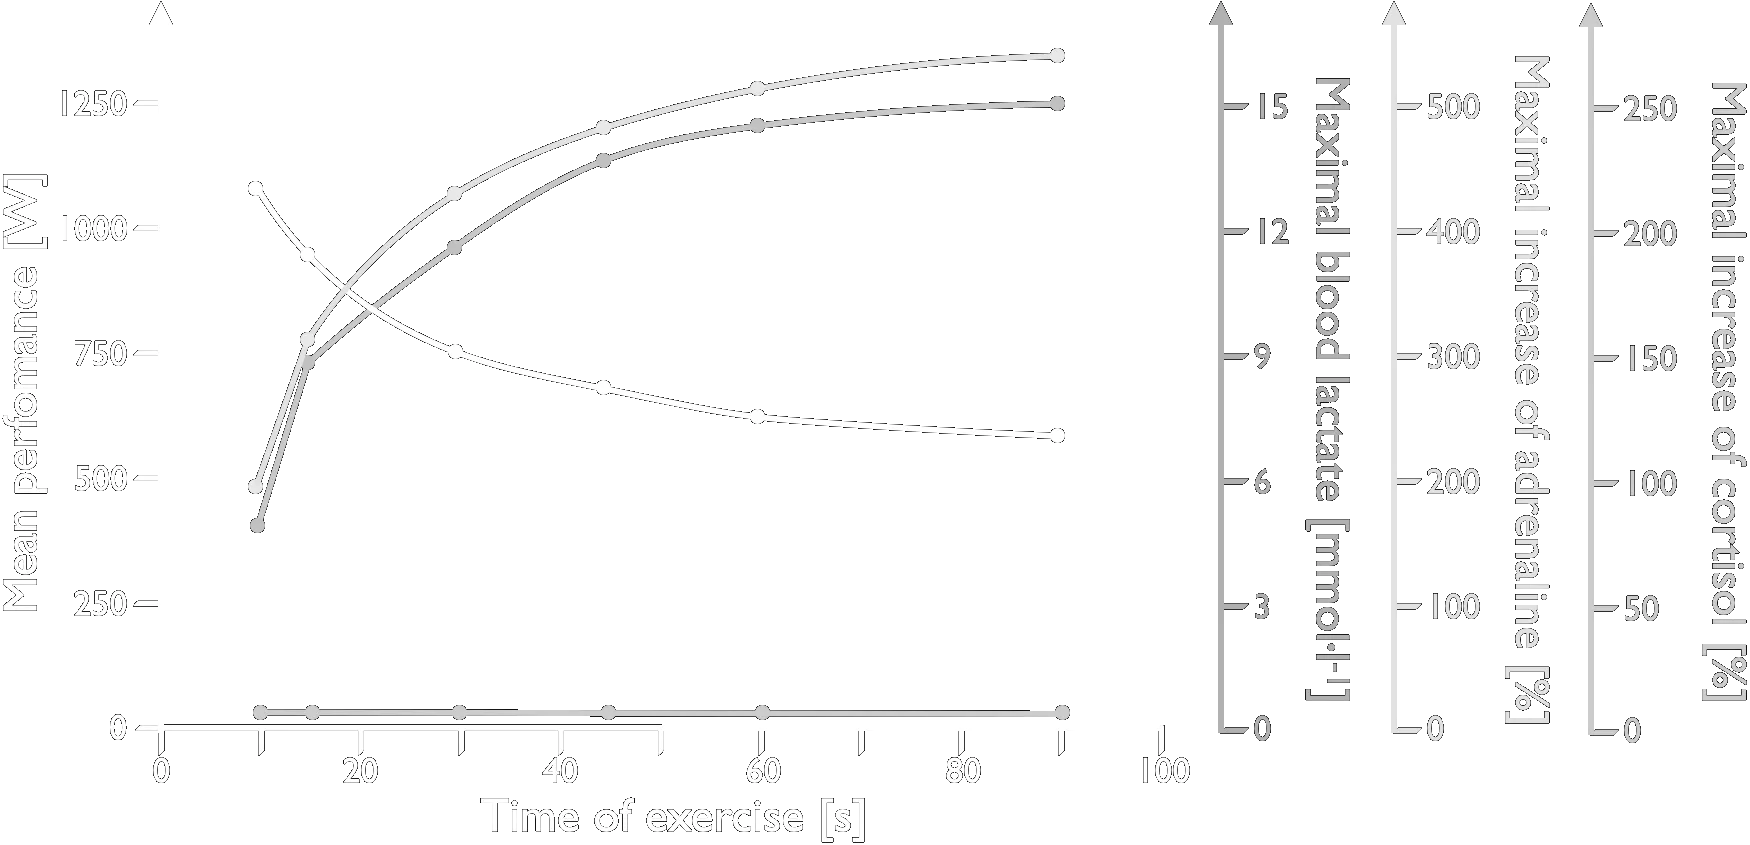
Cycle-ergometer exercise of different intensities and durations, showing performance, lactate generation and hormone secretion built up step by step. Male subjects with a V̇O₂max of 60–65 mL·min⁻¹·kg⁻¹.
Overview of hormonal regulation and energy supply at different loads and load durations. RPE — rating of perceived exertion (Borg scale value).
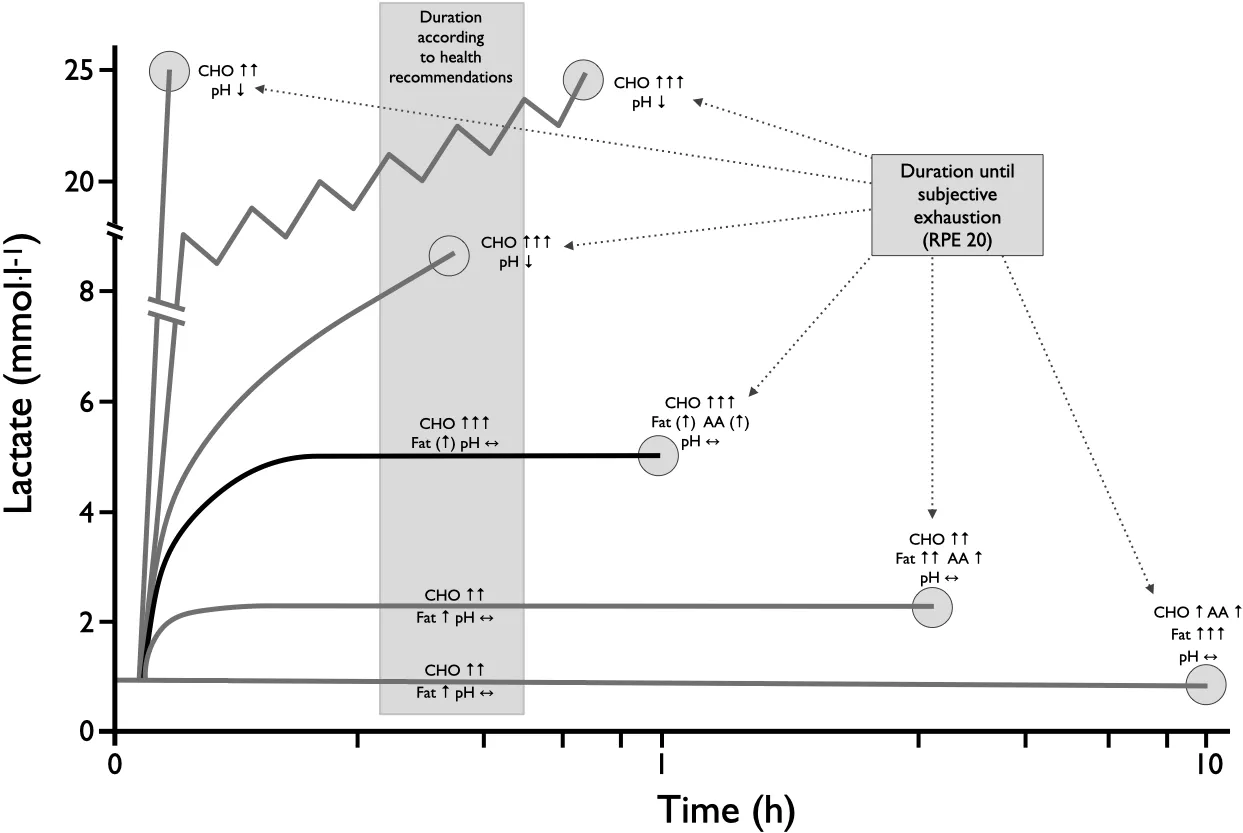
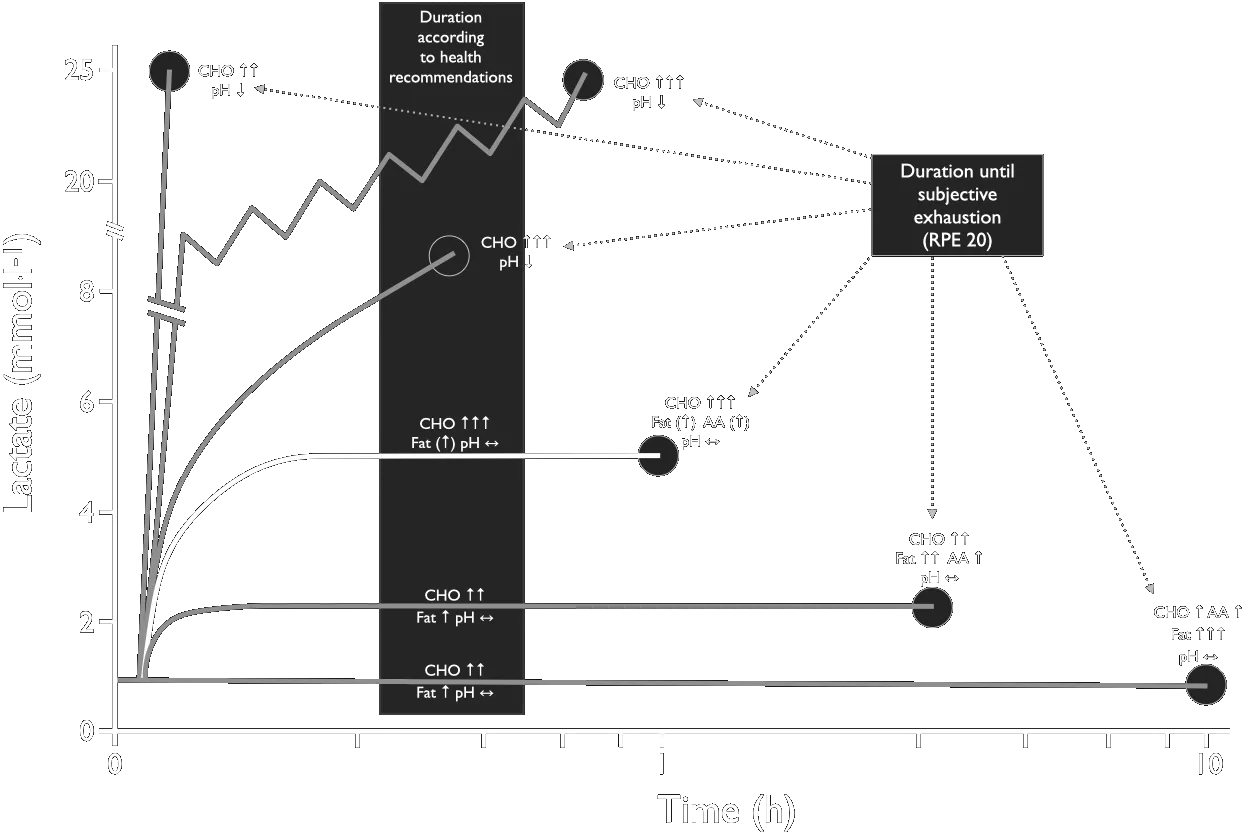
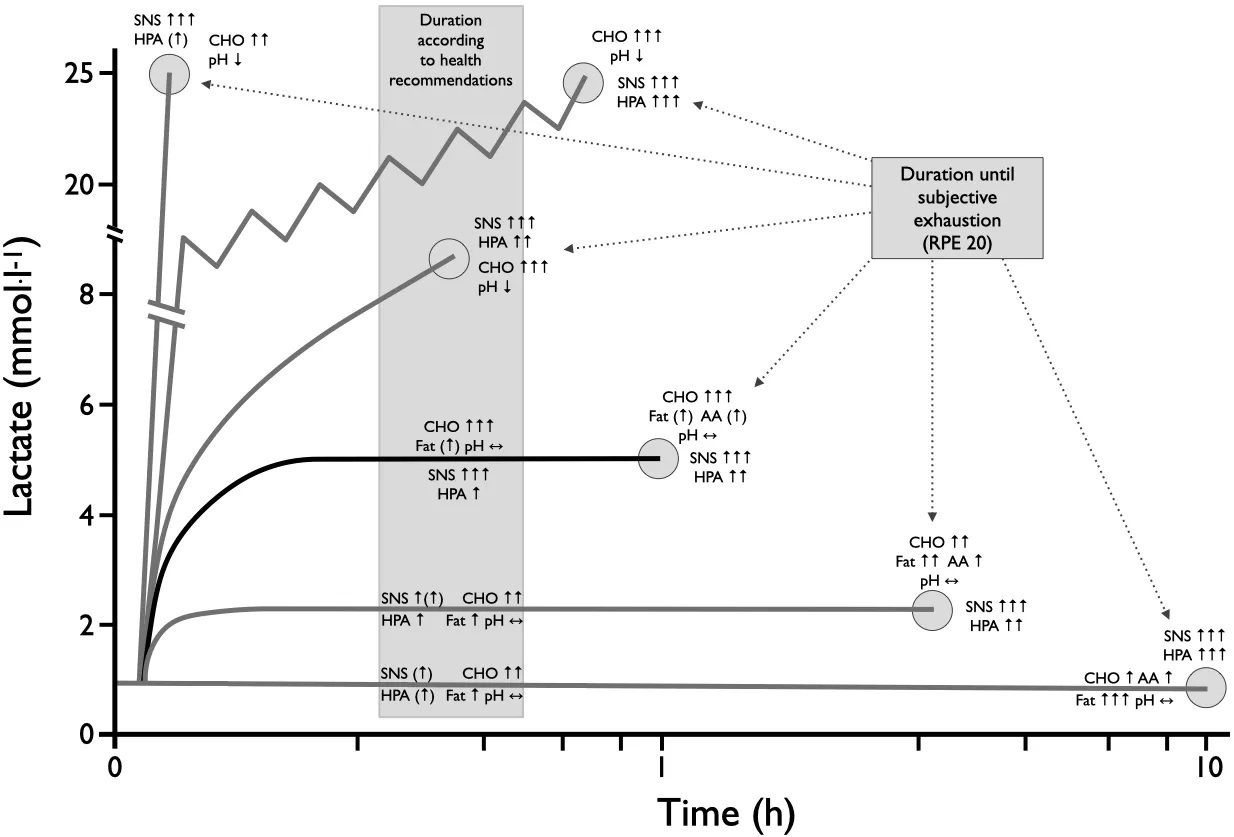
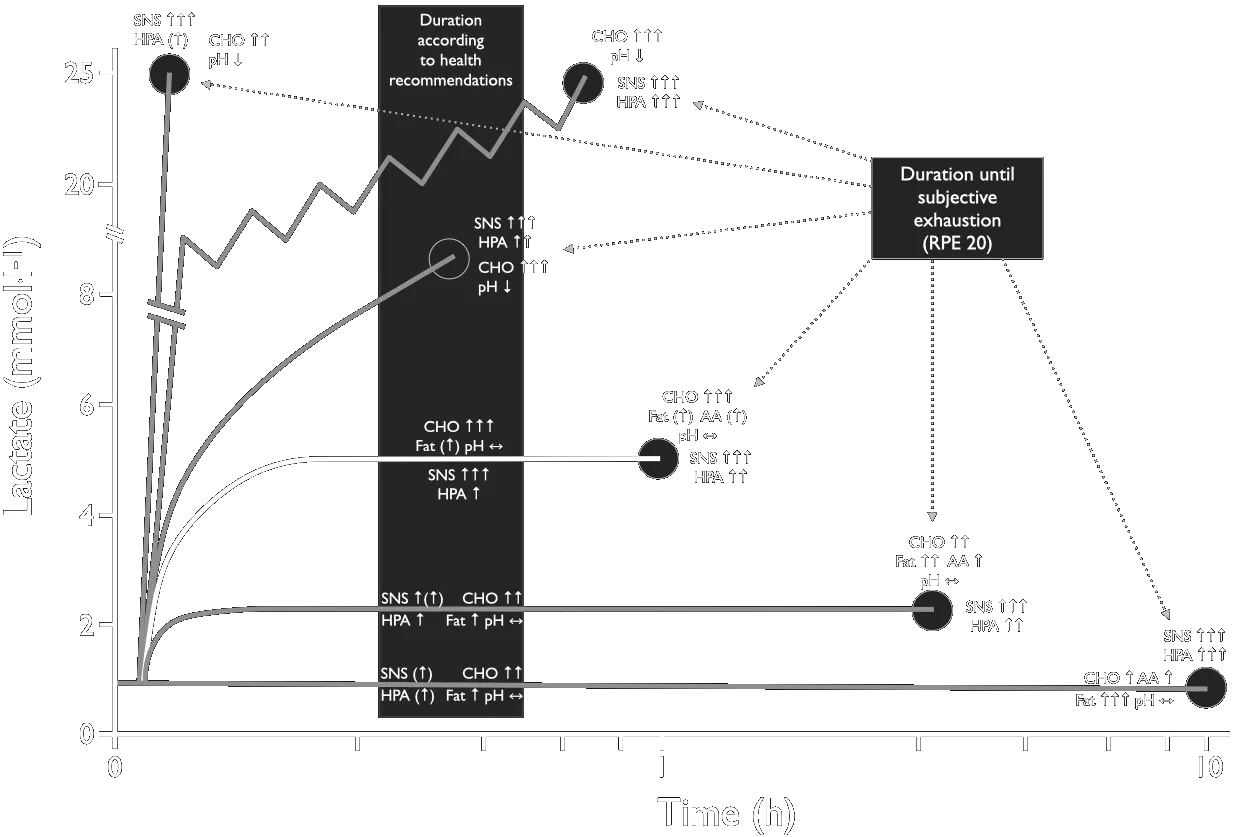
Overview of hormonal regulation and energy supply at different loads and load durations. RPE — rating of perceived exertion (Borg scale value).
Lecture 3: Heart Rate as a Biomarker — The Resting Value, the Ceiling and the Fall
Relative risk per 10 bpm higher resting heart rate, by outcome, pooled from eighty-seven prospective studies (Aune et al. 2017). All-cause mortality is highlighted.
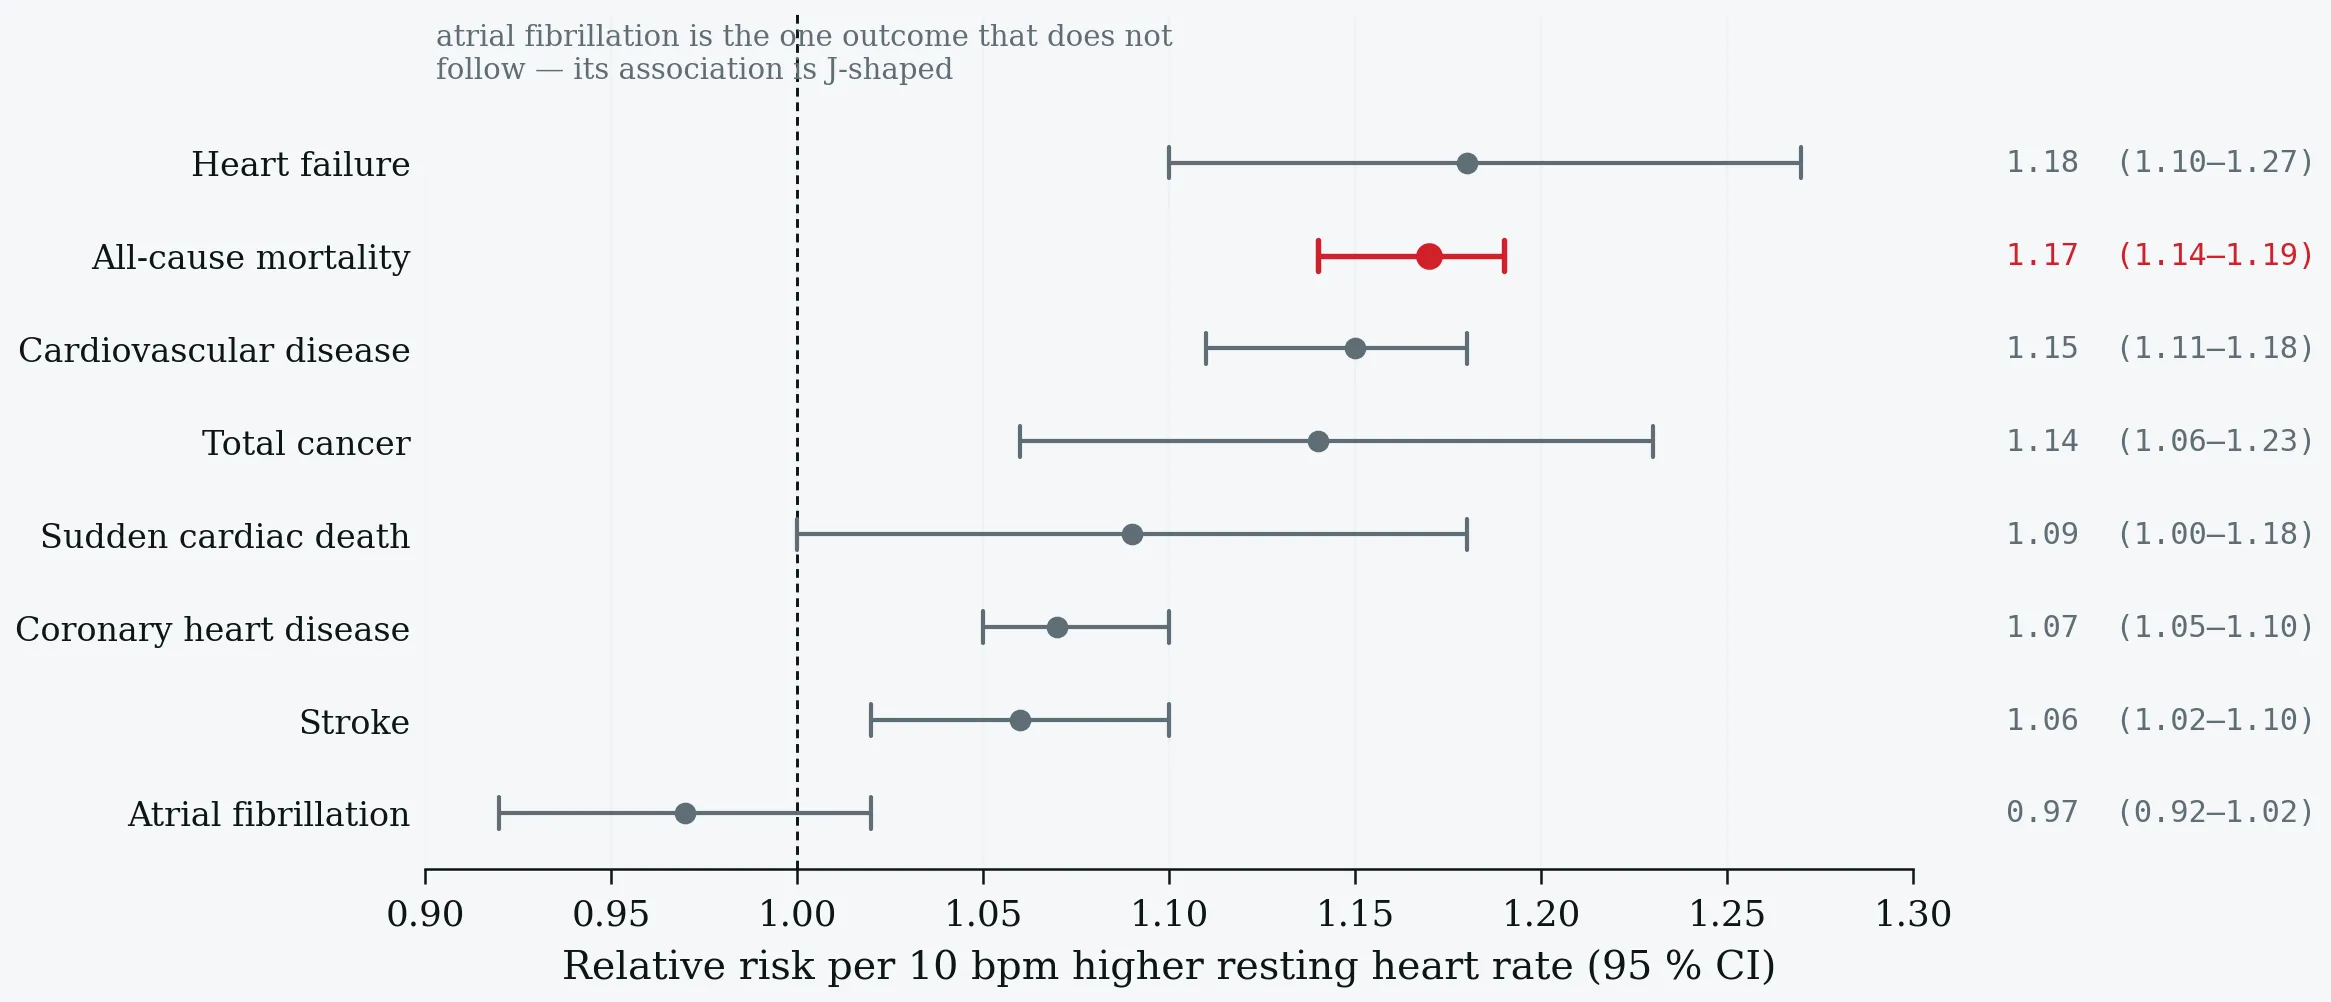
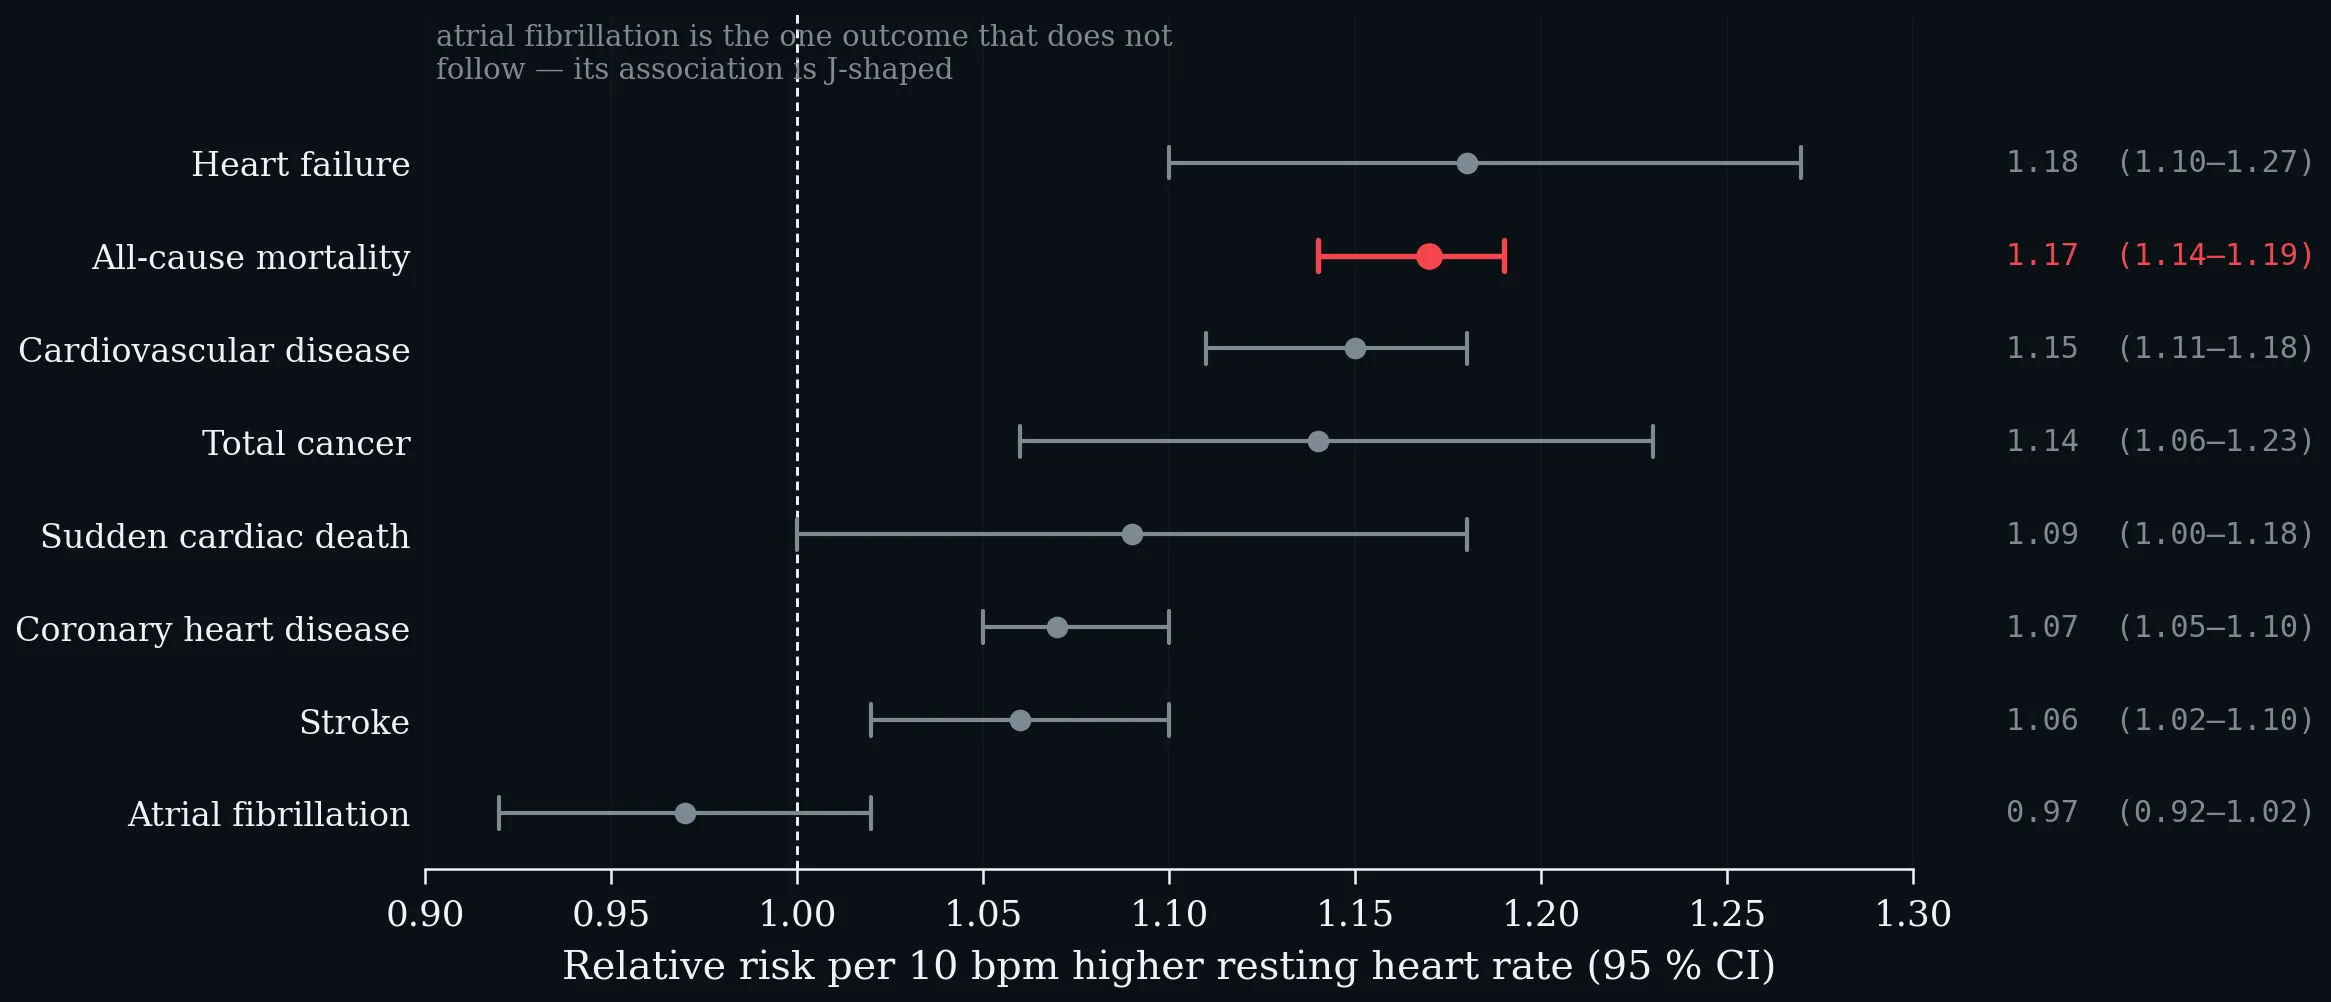
Relative risk per 10 bpm higher resting heart rate, by outcome, pooled from eighty-seven prospective studies (Aune et al. 2017). All-cause mortality is highlighted.
Reflectance photoplethysmography at the wrist. Green light is absorbed strongly by haemoglobin and returns from the dermal arterioles; infrared penetrates into the subcutis and samples venous as well as arterial blood. The pulsatile AC component is 0.1–1% of the total light returning. Schematic; depths are indicative, not to scale.
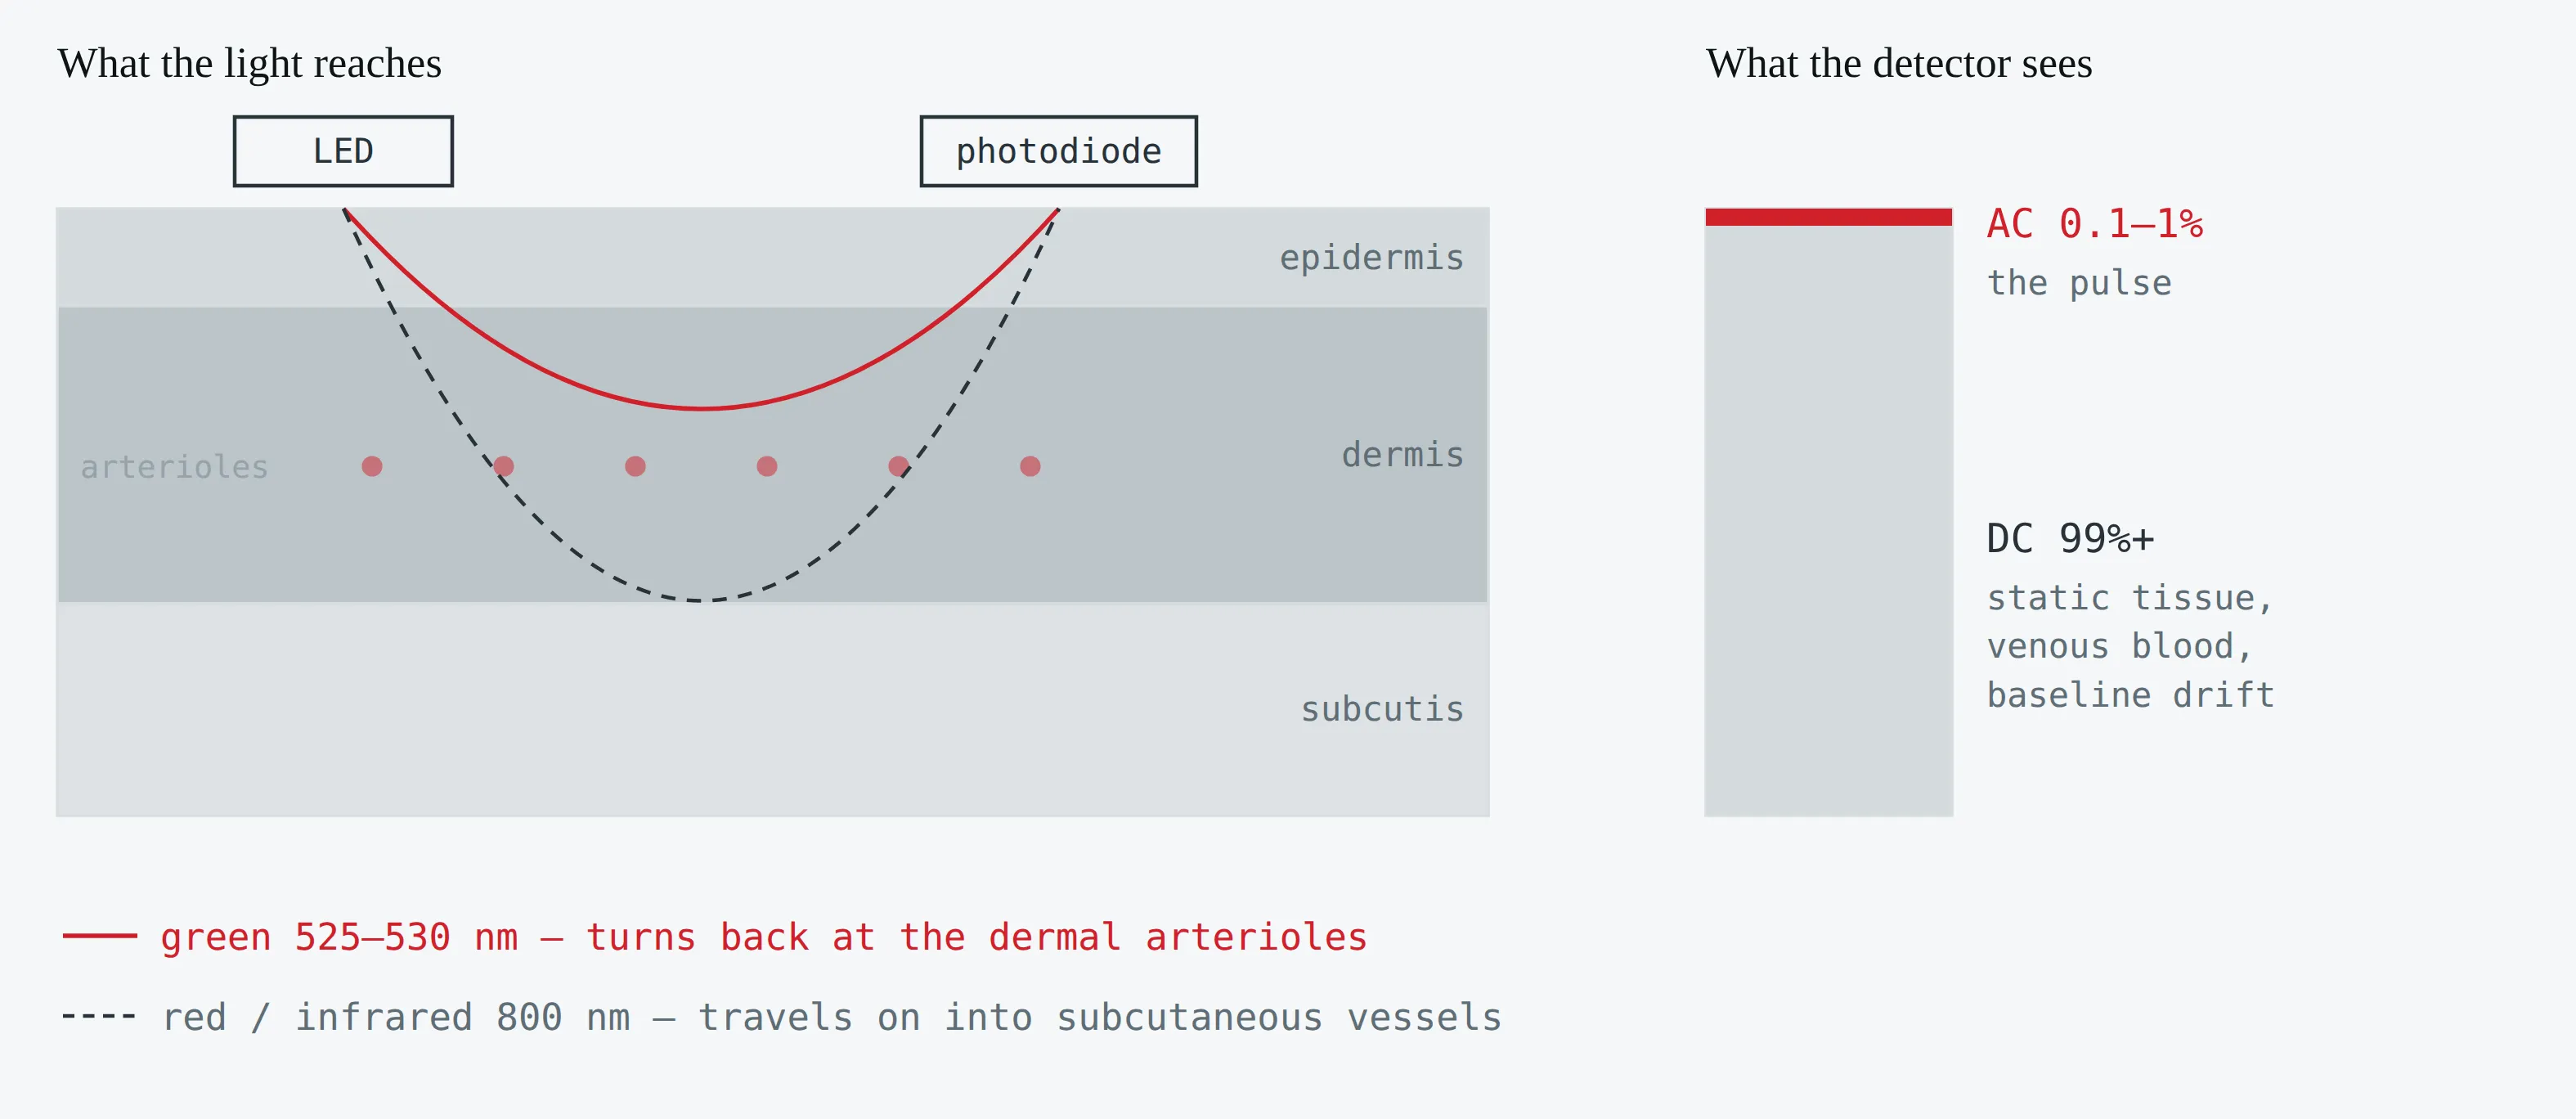
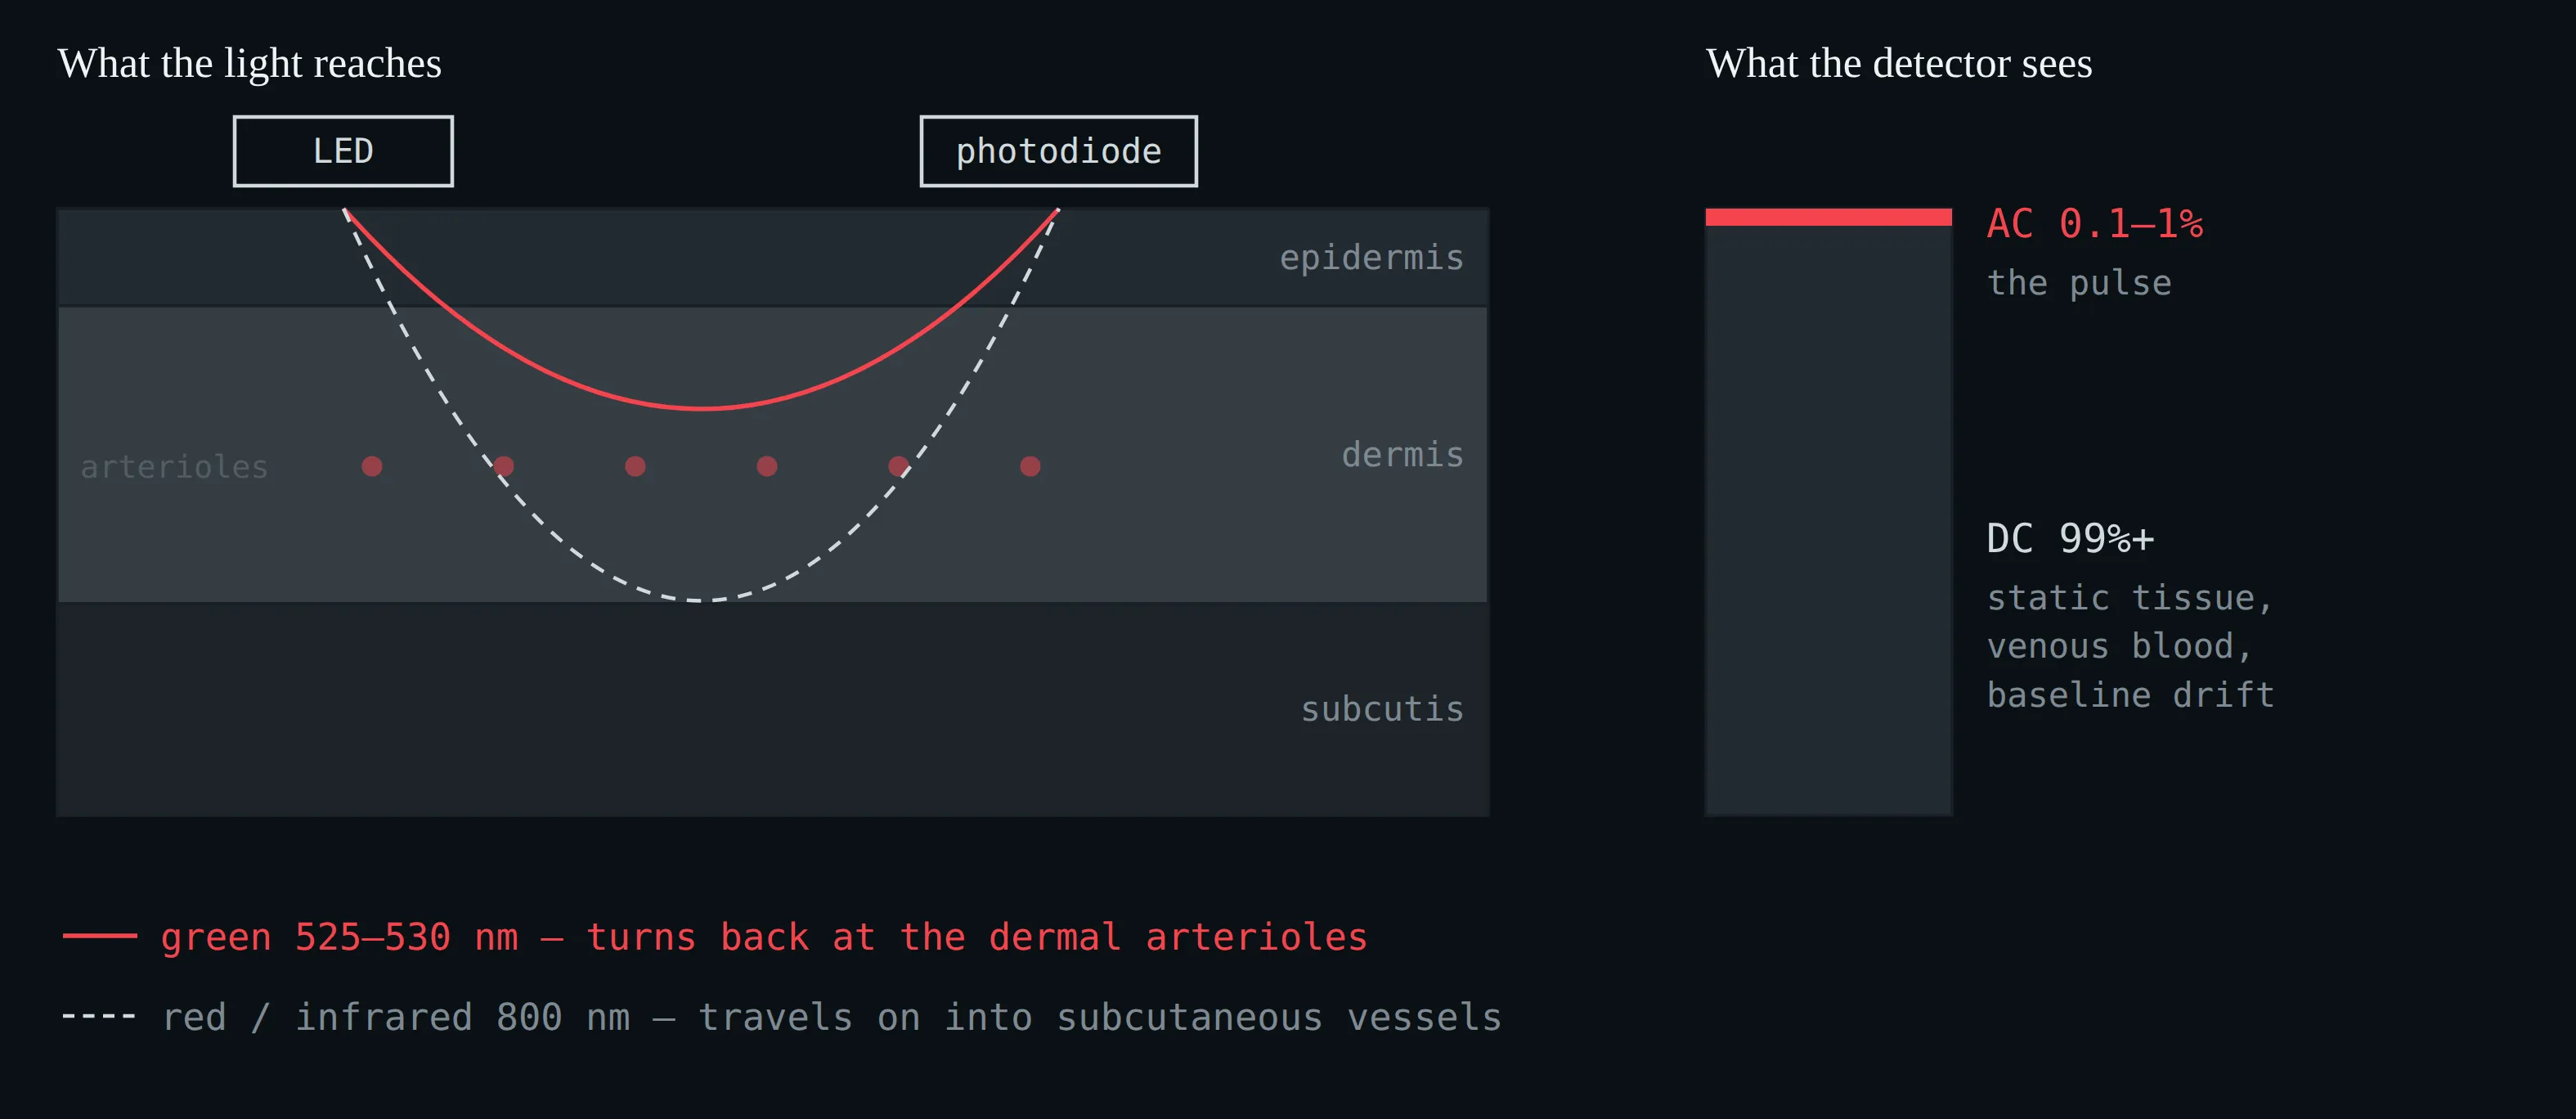
Reflectance photoplethysmography at the wrist. Green light is absorbed strongly by haemoglobin and returns from the dermal arterioles; infrared penetrates into the subcutis and samples venous as well as arterial blood. The pulsatile AC component is 0.1–1% of the total light returning. Schematic; depths are indicative, not to scale.
From raw photodiode current to displayed heart rate. Steps 1–3 are physics and broadly comparable across devices; steps 4–7 are proprietary and change with firmware.
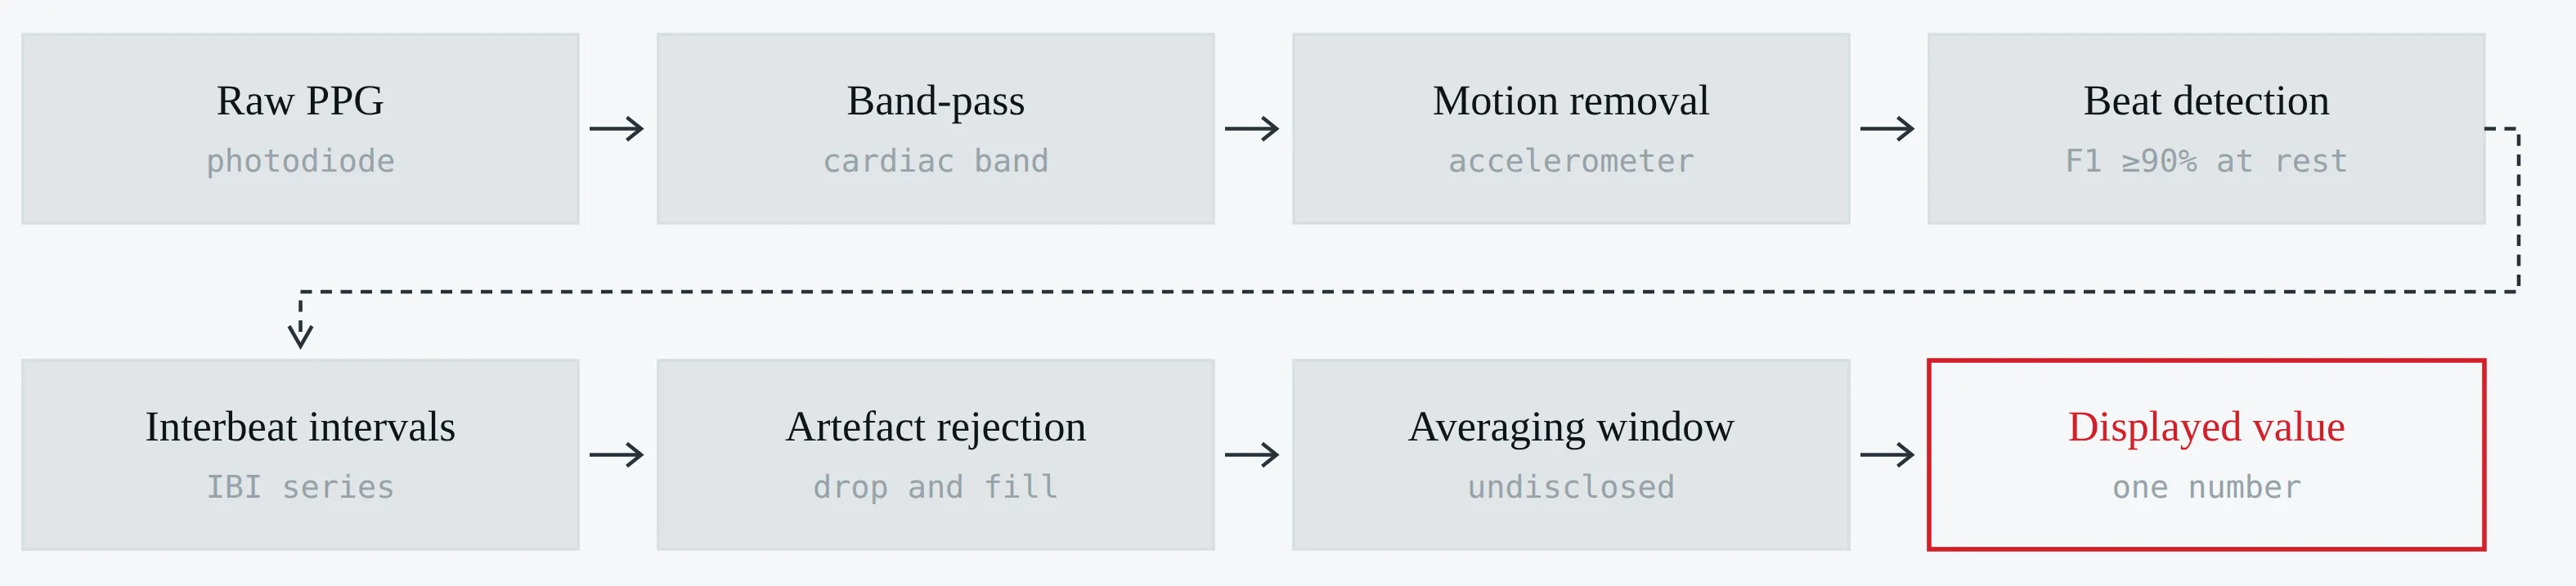
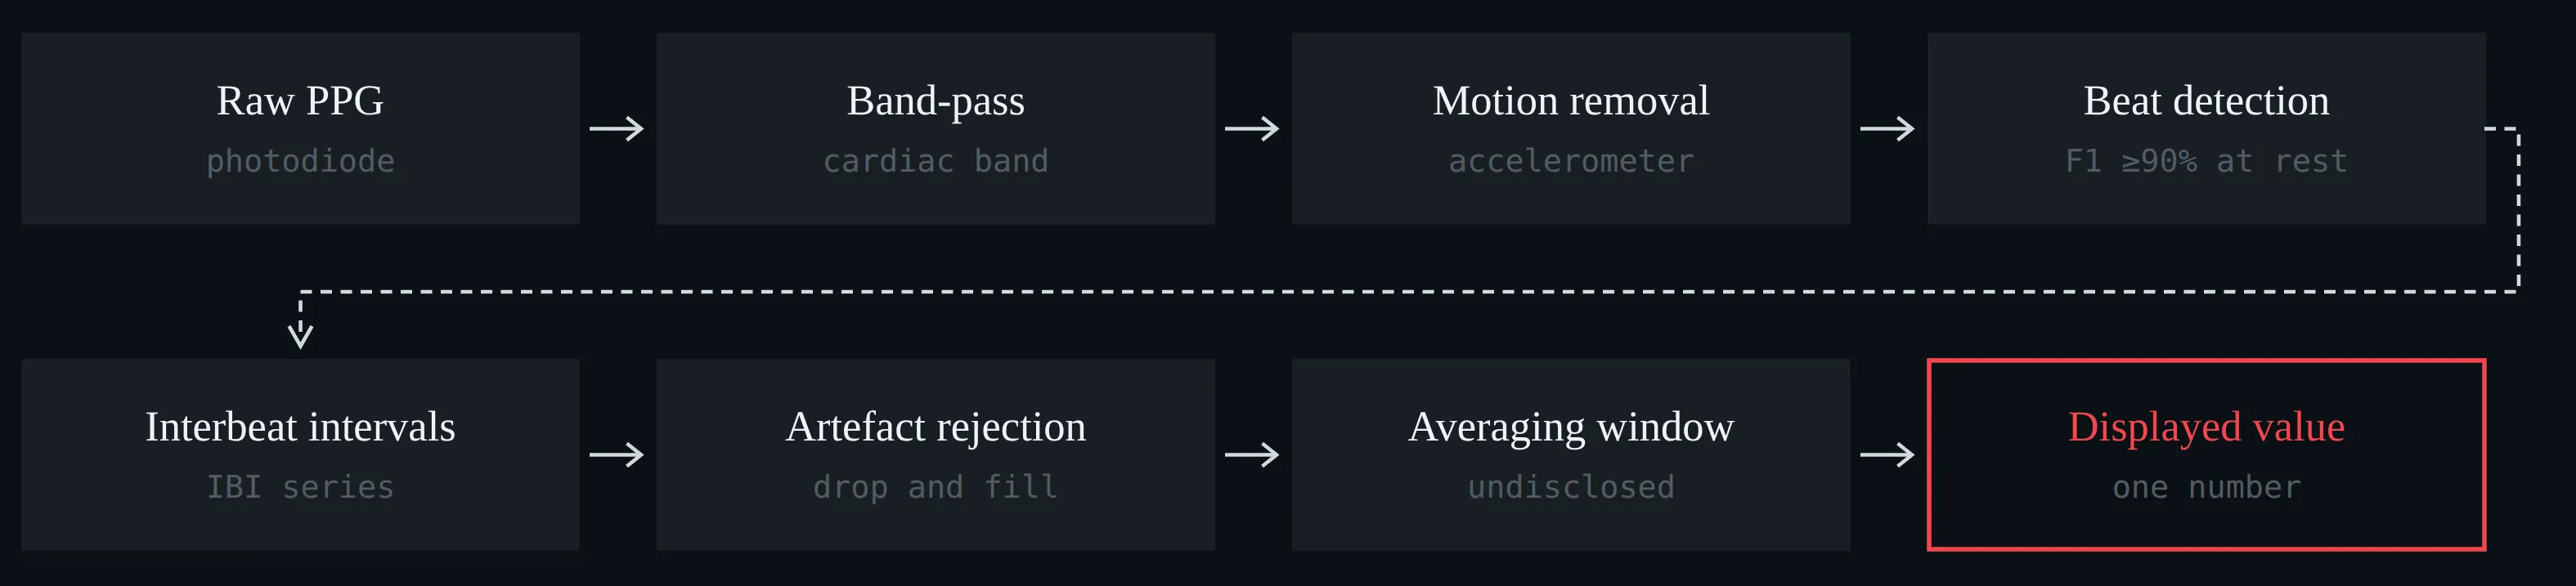
From raw photodiode current to displayed heart rate. Steps 1–3 are physics and broadly comparable across devices; steps 4–7 are proprietary and change with firmware.
Nocturnal heart rate against two-lead ECG in 53 participants: bias and 95% limits of agreement, with mean absolute error and intraclass correlation alongside (Miller et al. 2022).
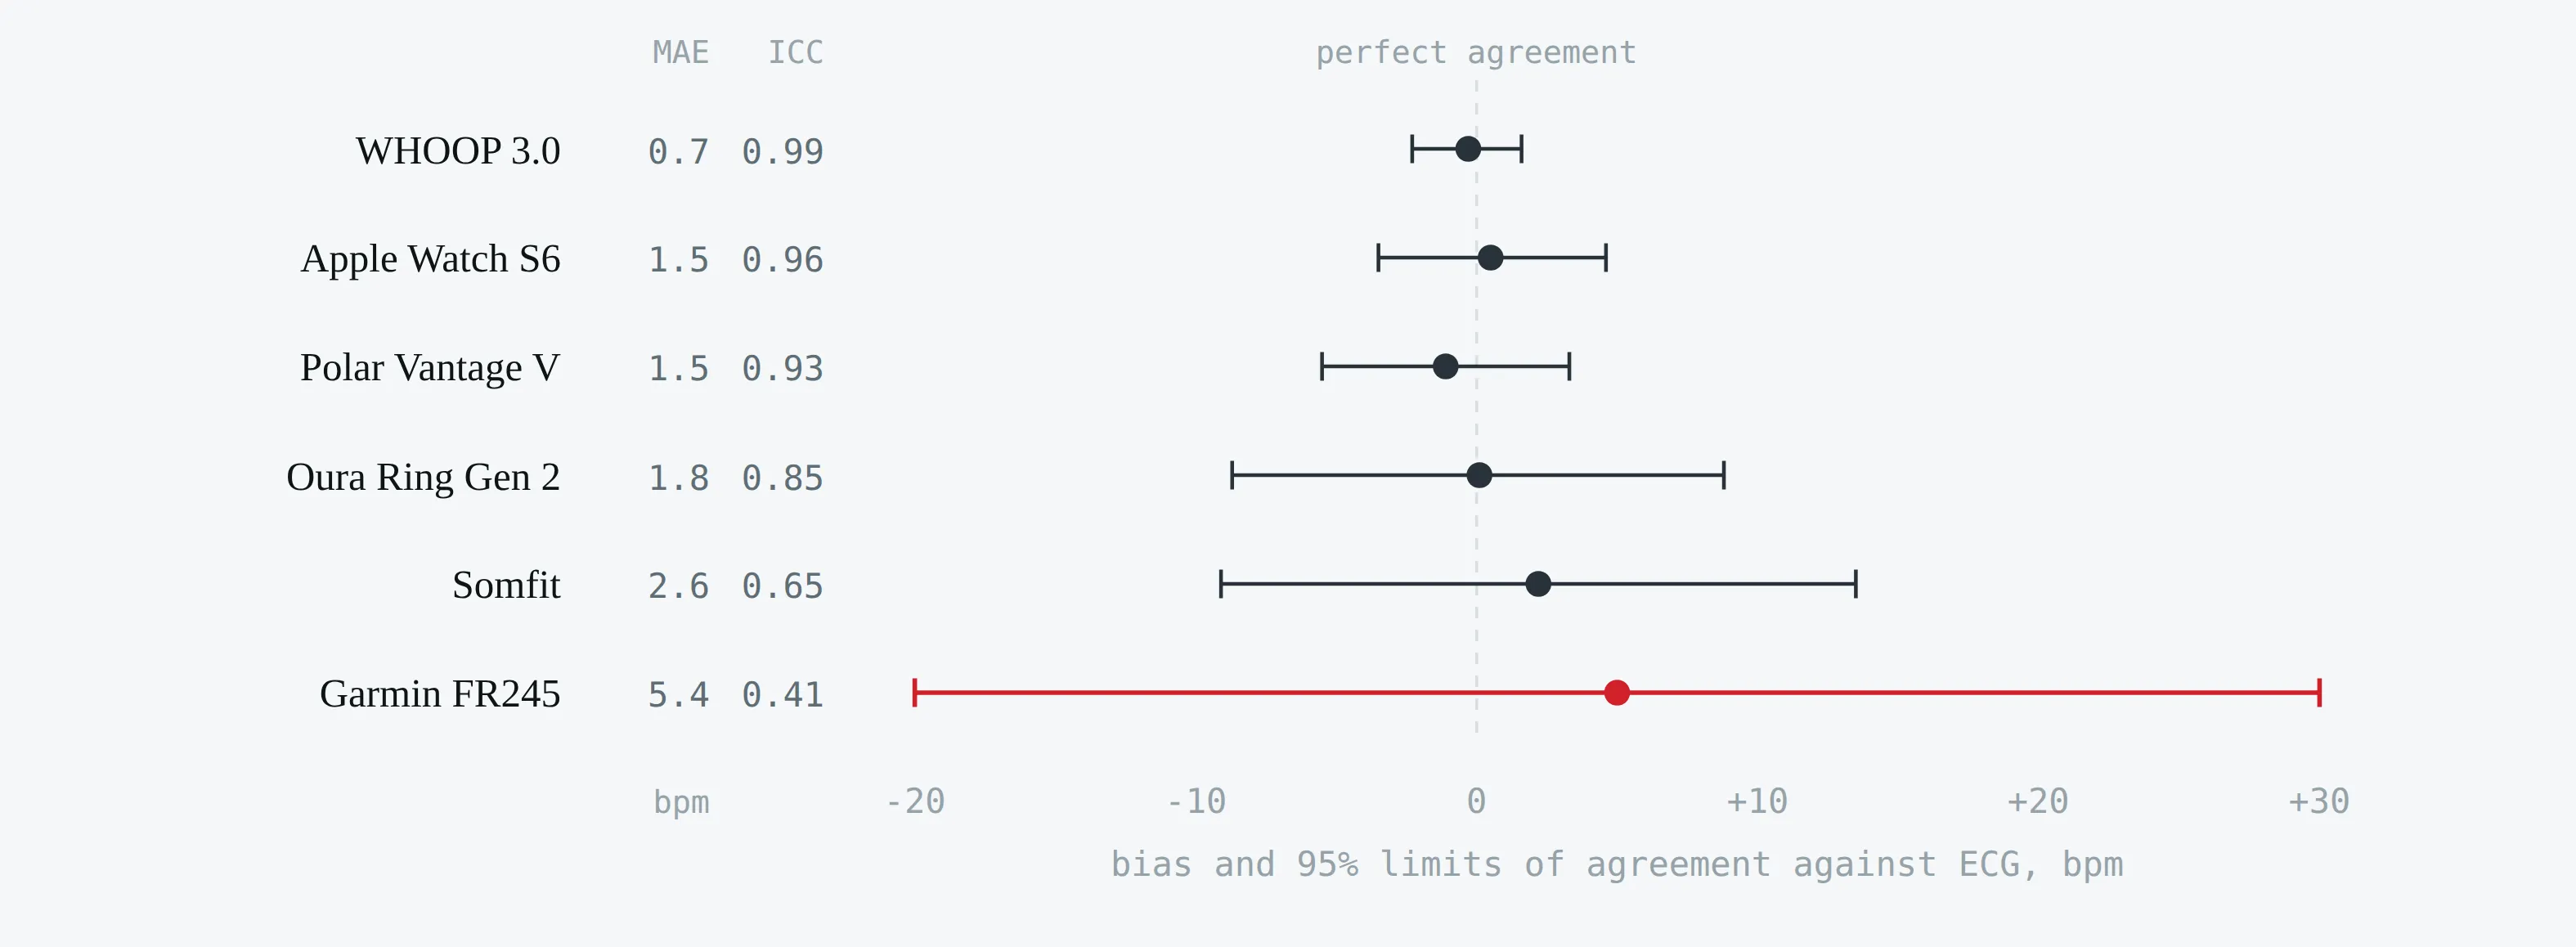
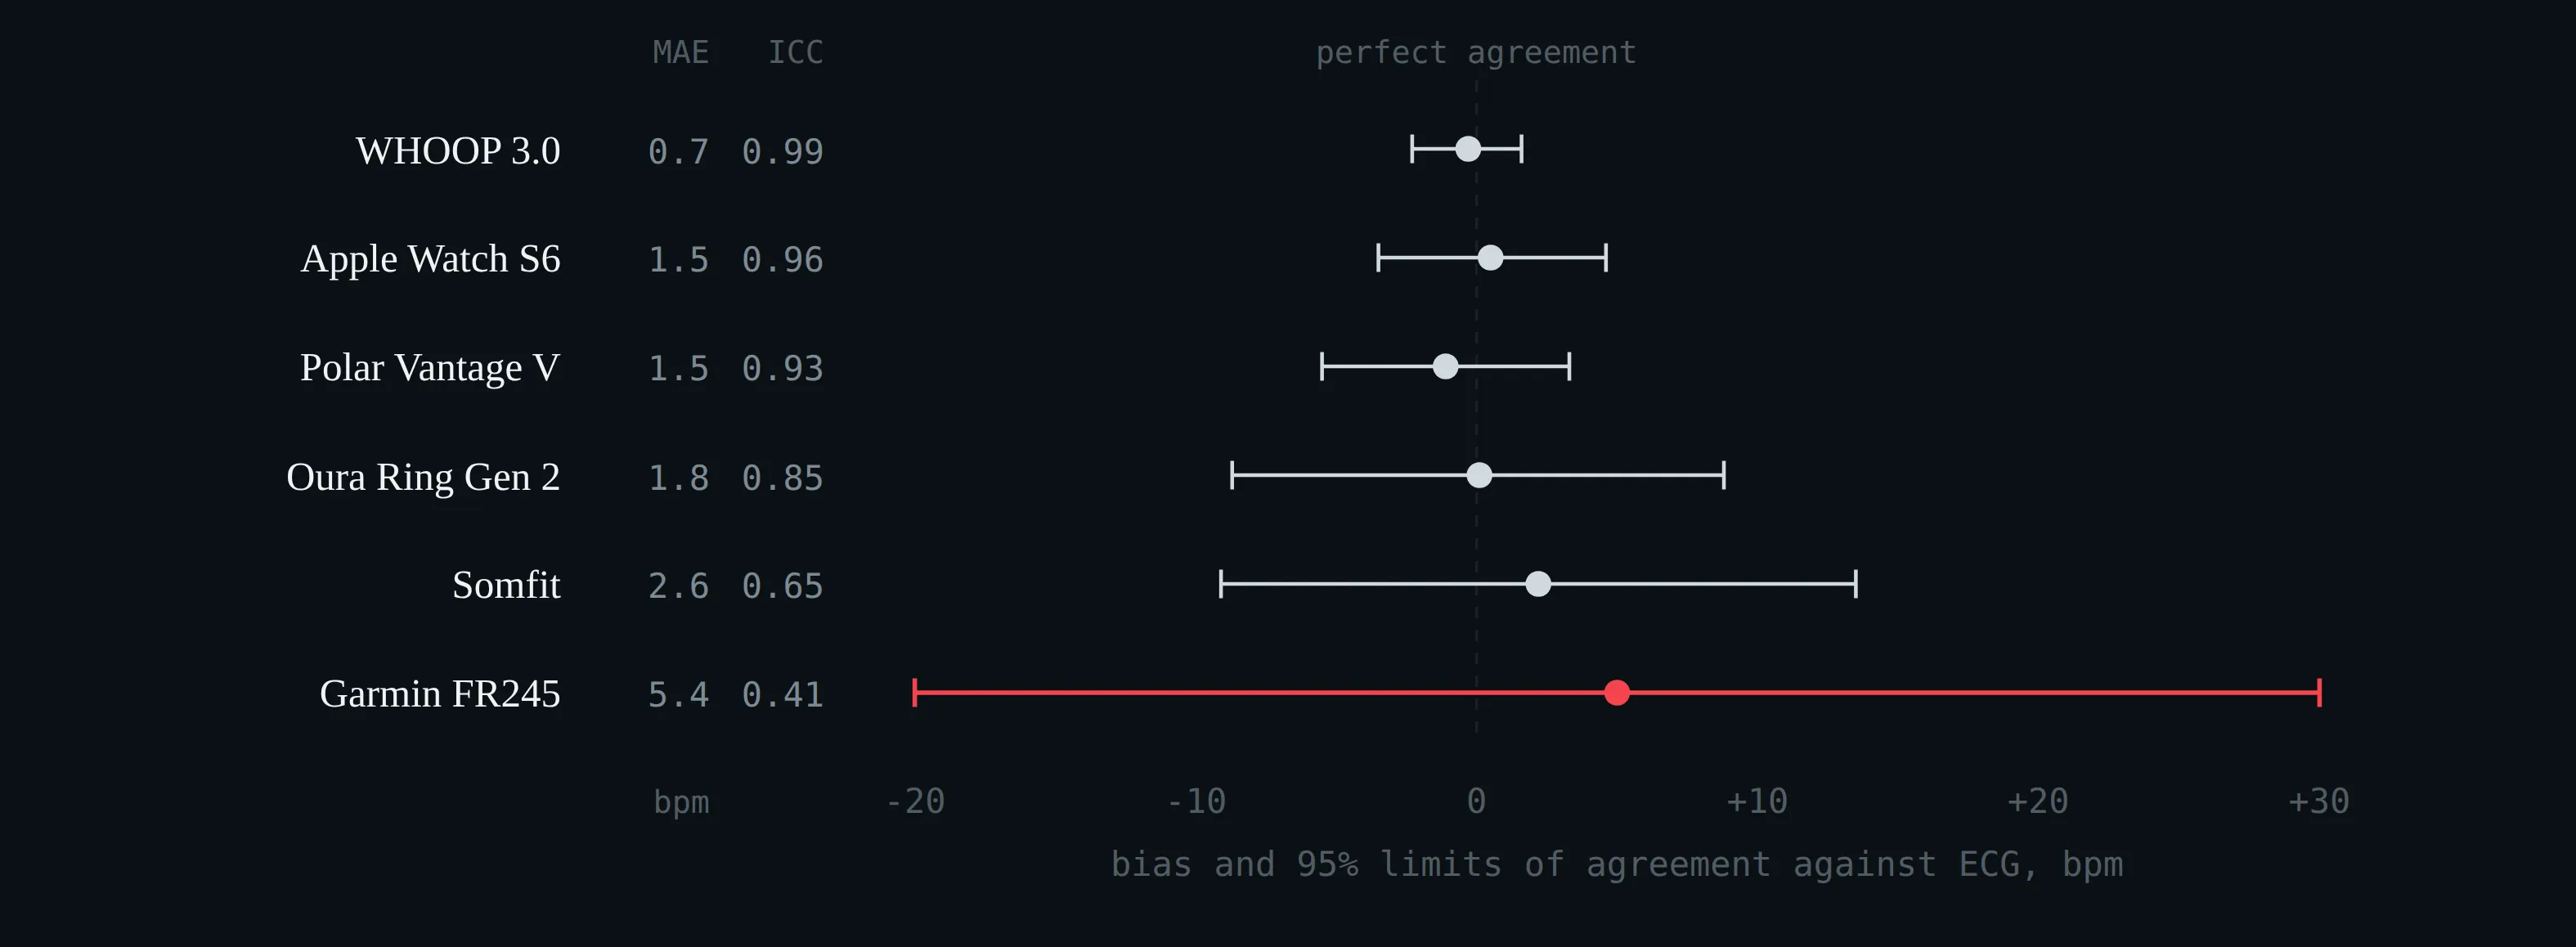
Nocturnal heart rate against two-lead ECG in 53 participants: bias and 95% limits of agreement, with mean absolute error and intraclass correlation alongside (Miller et al. 2022).
Sleep sensitivity and wake specificity for seven consumer devices against polysomnography (Chinoy et al. 2021; de Zambotti et al. 2019; Ong et al. 2024; Schyvens et al. 2025). The sensitivities are all alike; the specificities are not. Accuracy, the statistic usually quoted, is dominated by the sensitivity.
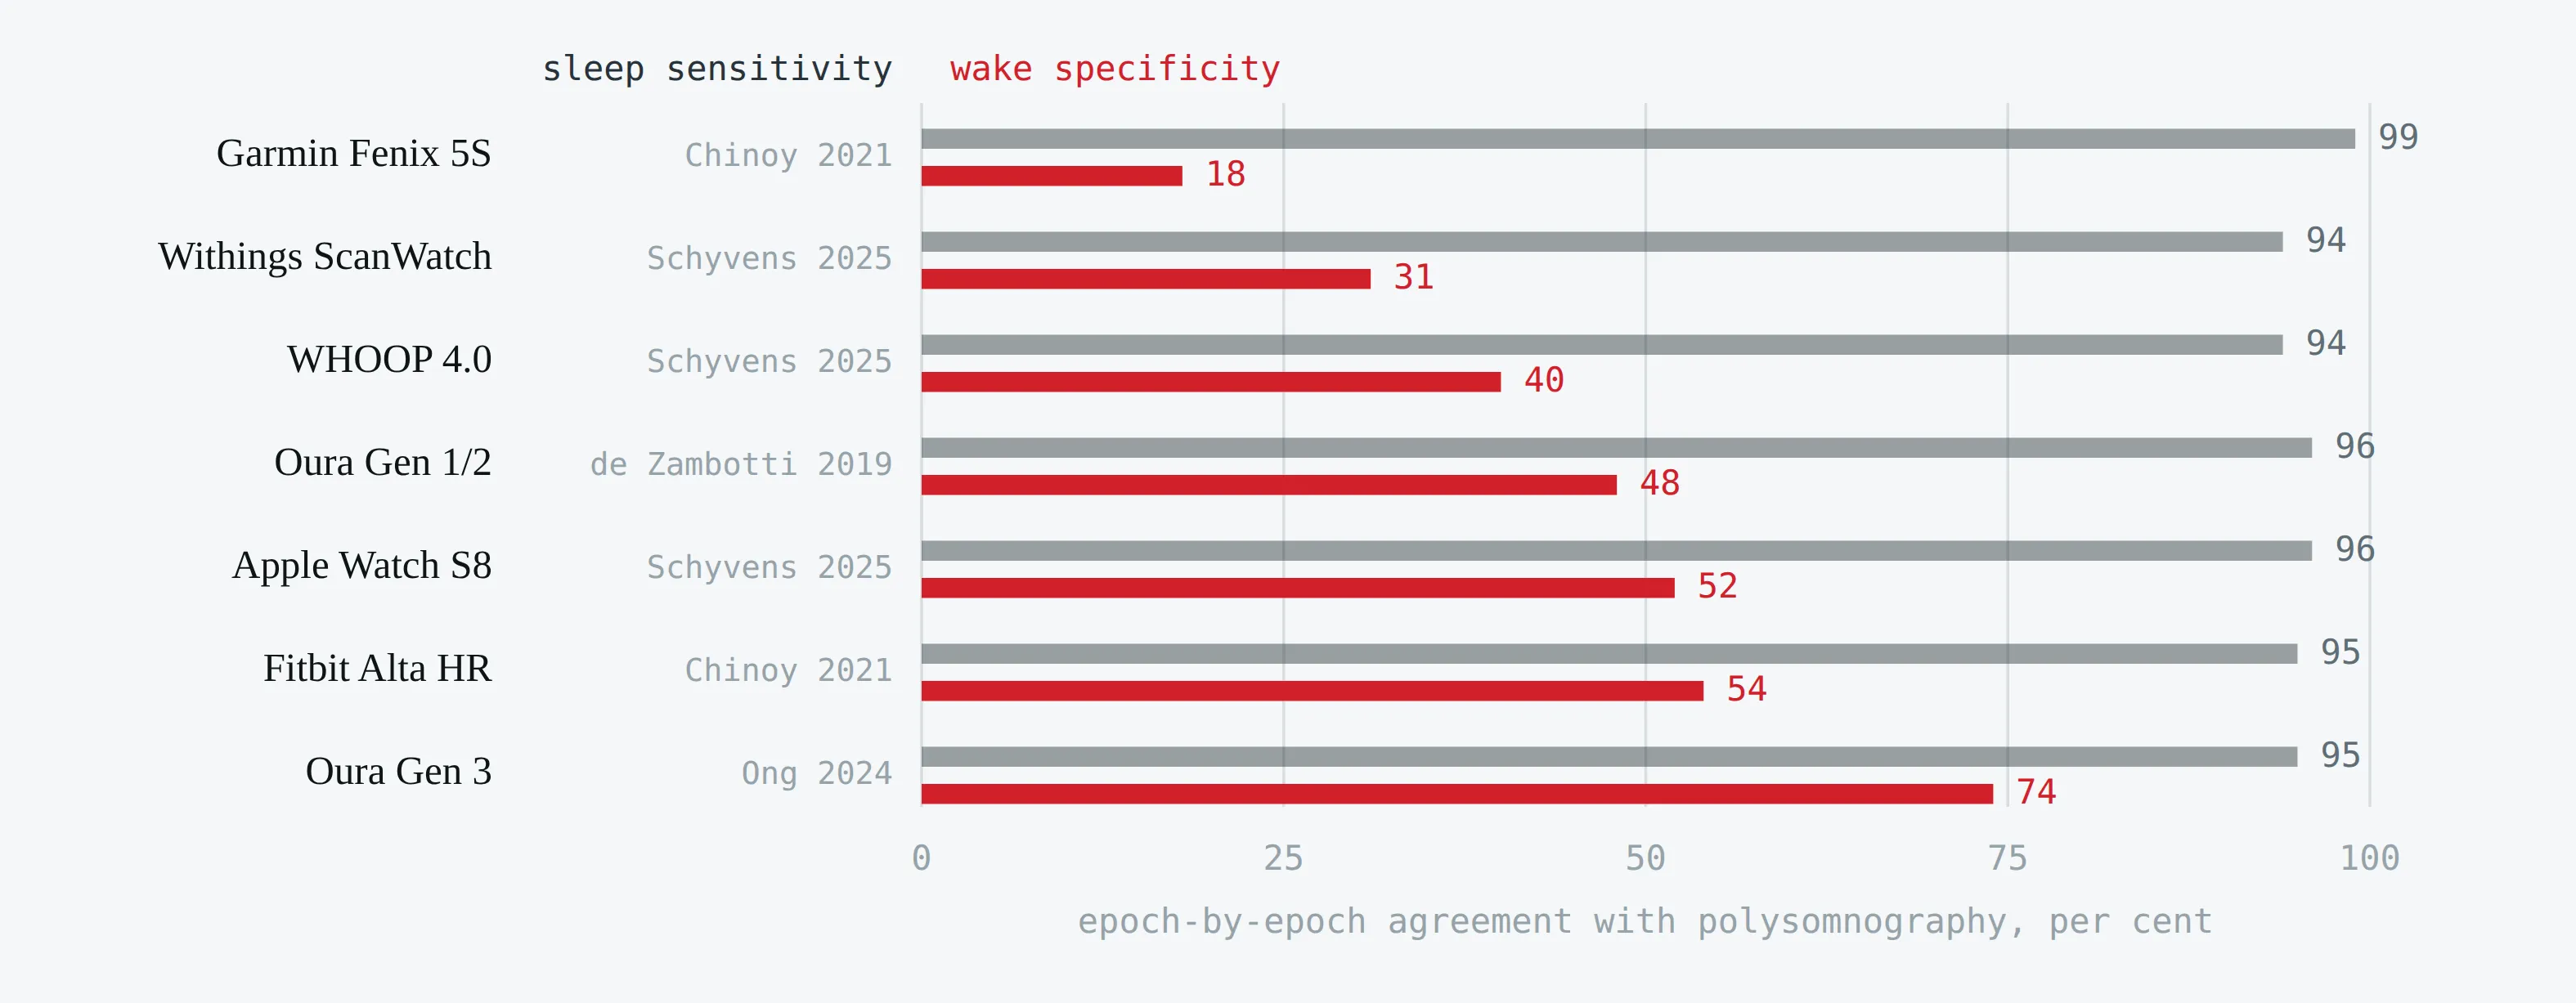
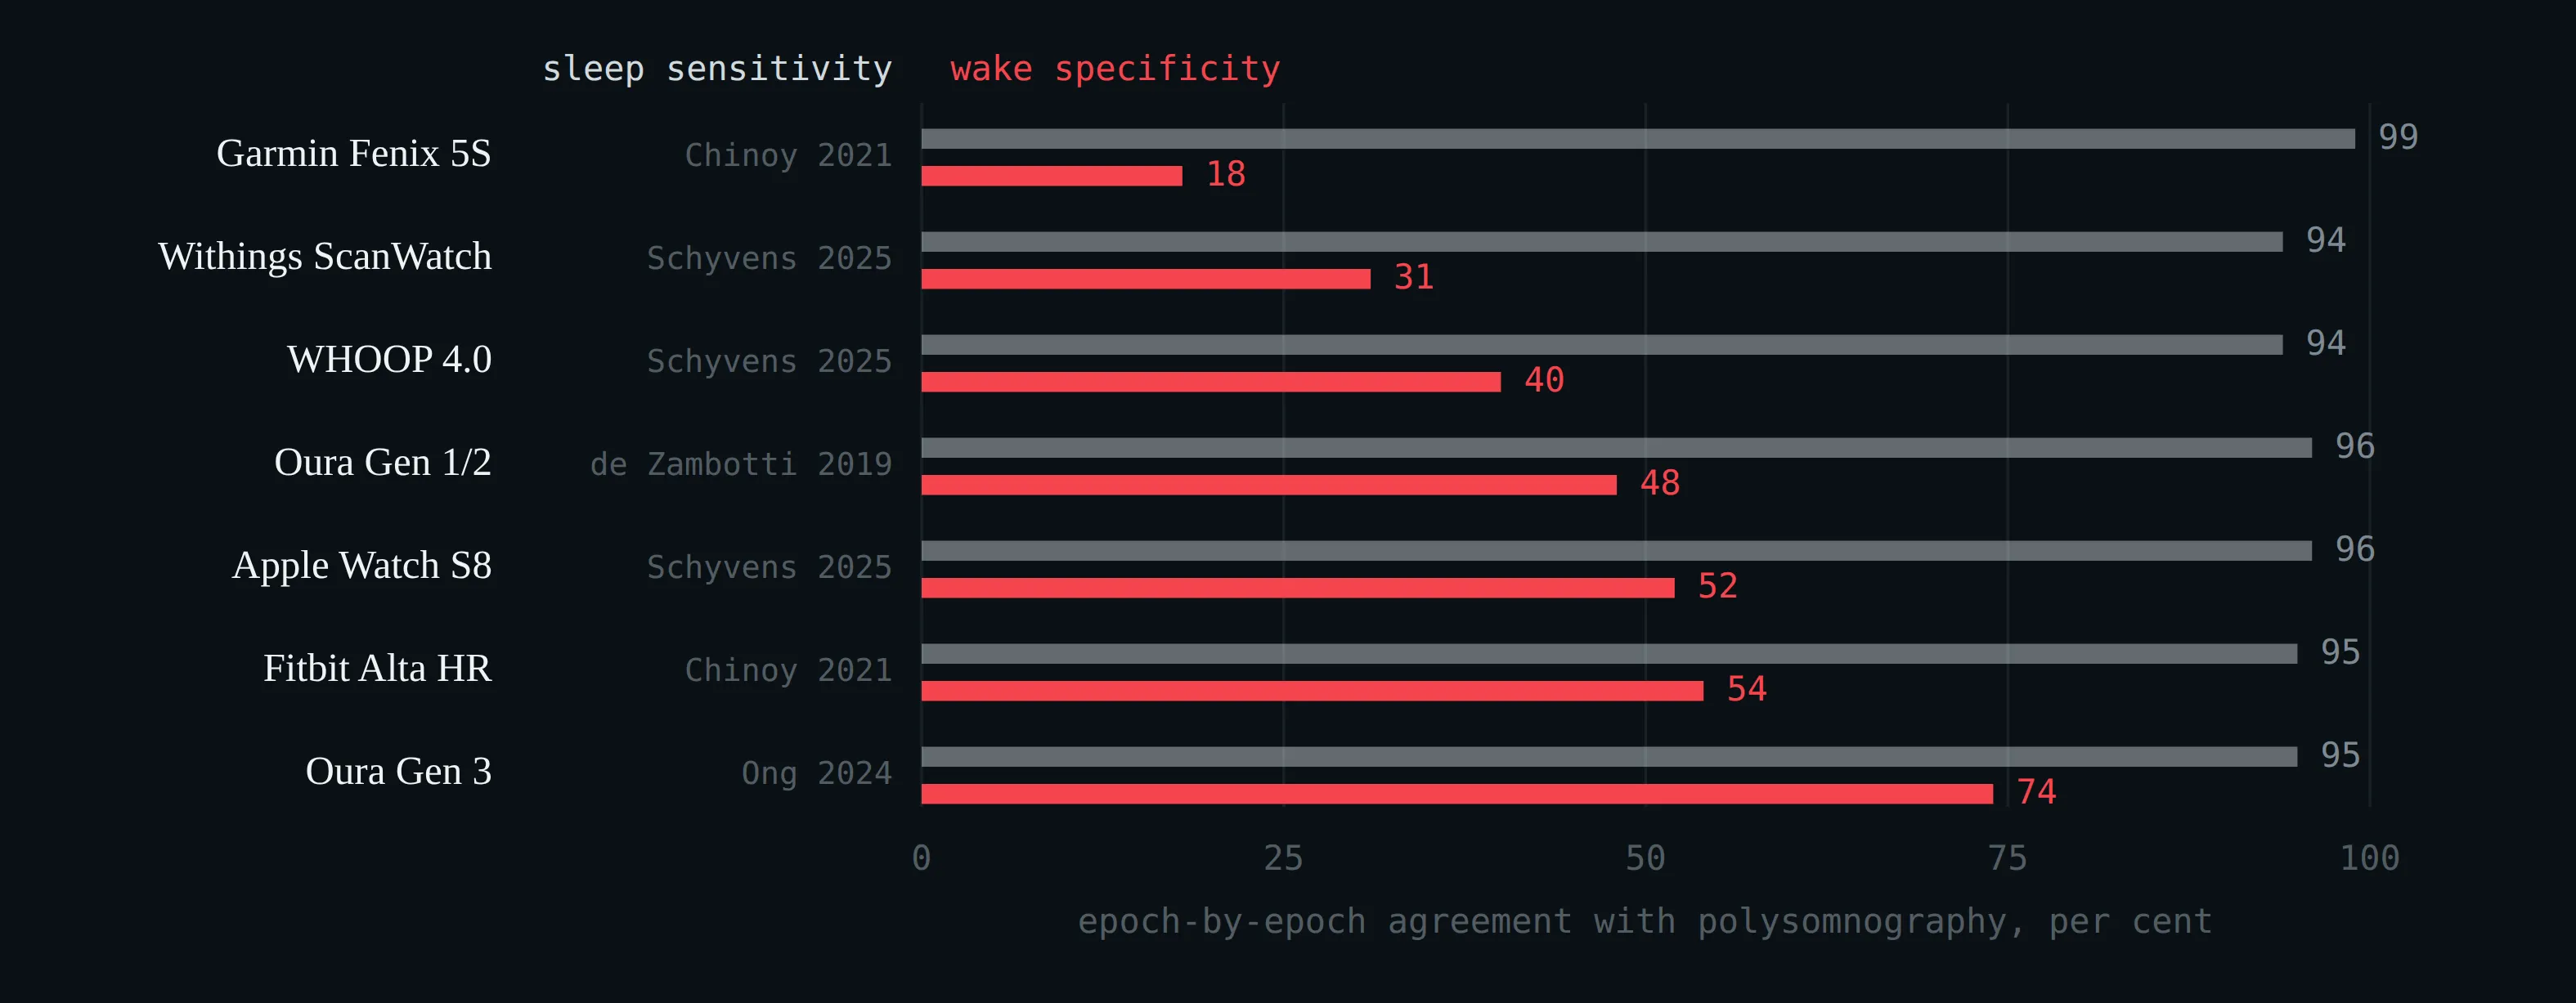
Sleep sensitivity and wake specificity for seven consumer devices against polysomnography (Chinoy et al. 2021; de Zambotti et al. 2019; Ong et al. 2024; Schyvens et al. 2025). The sensitivities are all alike; the specificities are not. Accuracy, the statistic usually quoted, is dominated by the sensitivity.
Agreement between wrist photoplethysmography and ECG, at rest and during exercise (Lambe et al. 2026). The bar is the bias; the dashed limits contain 95% of differences.
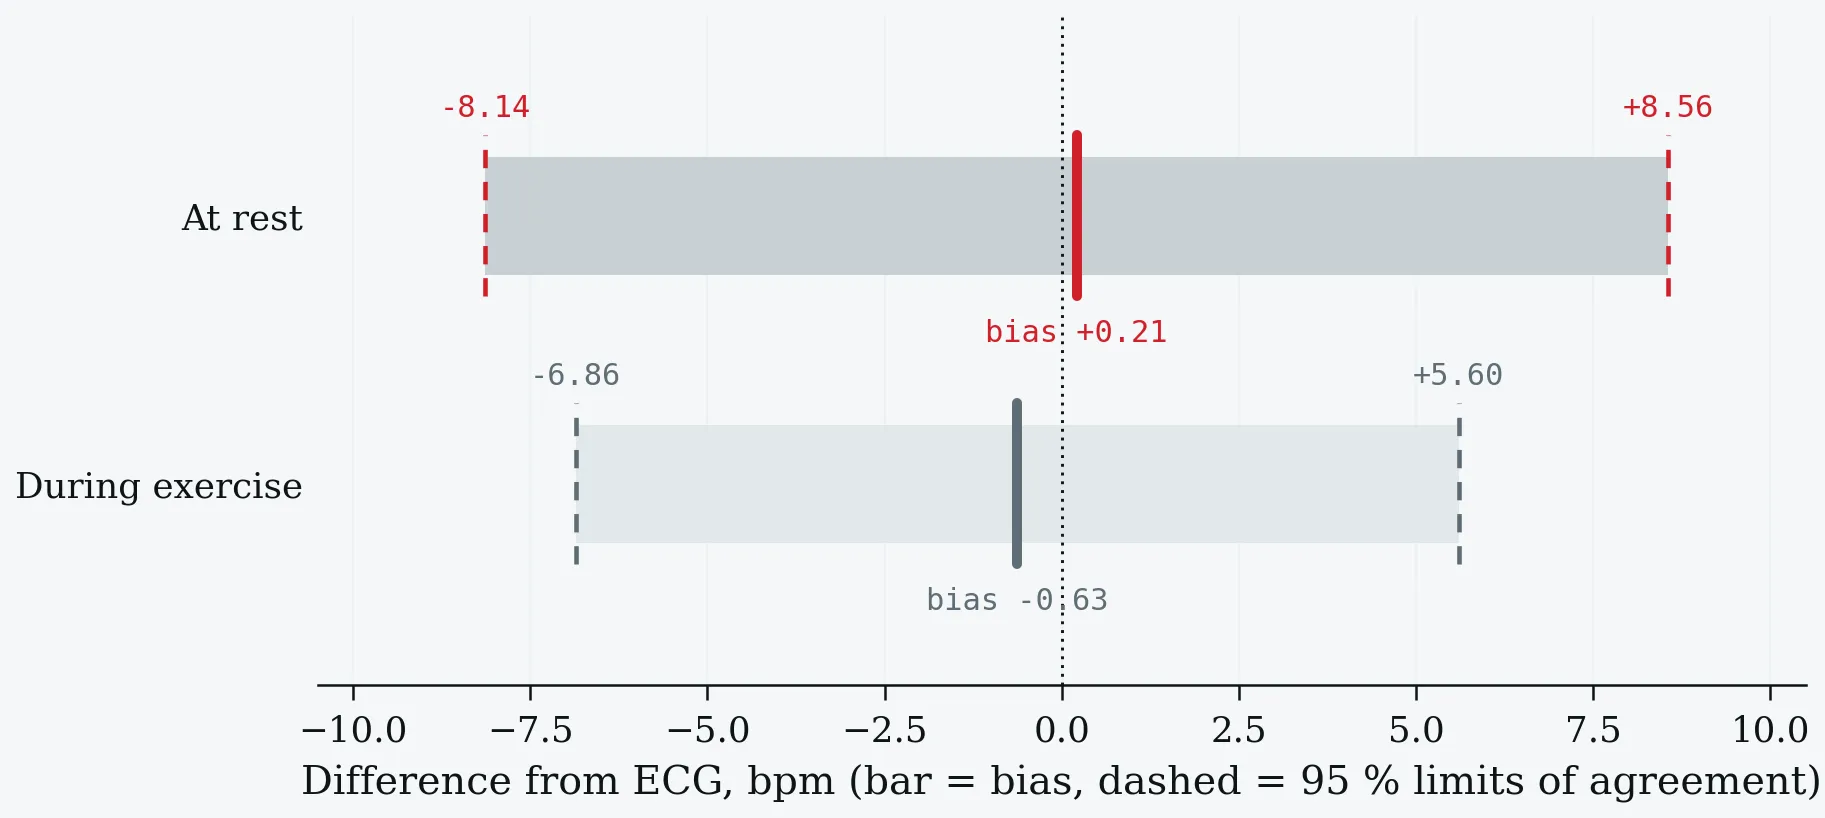
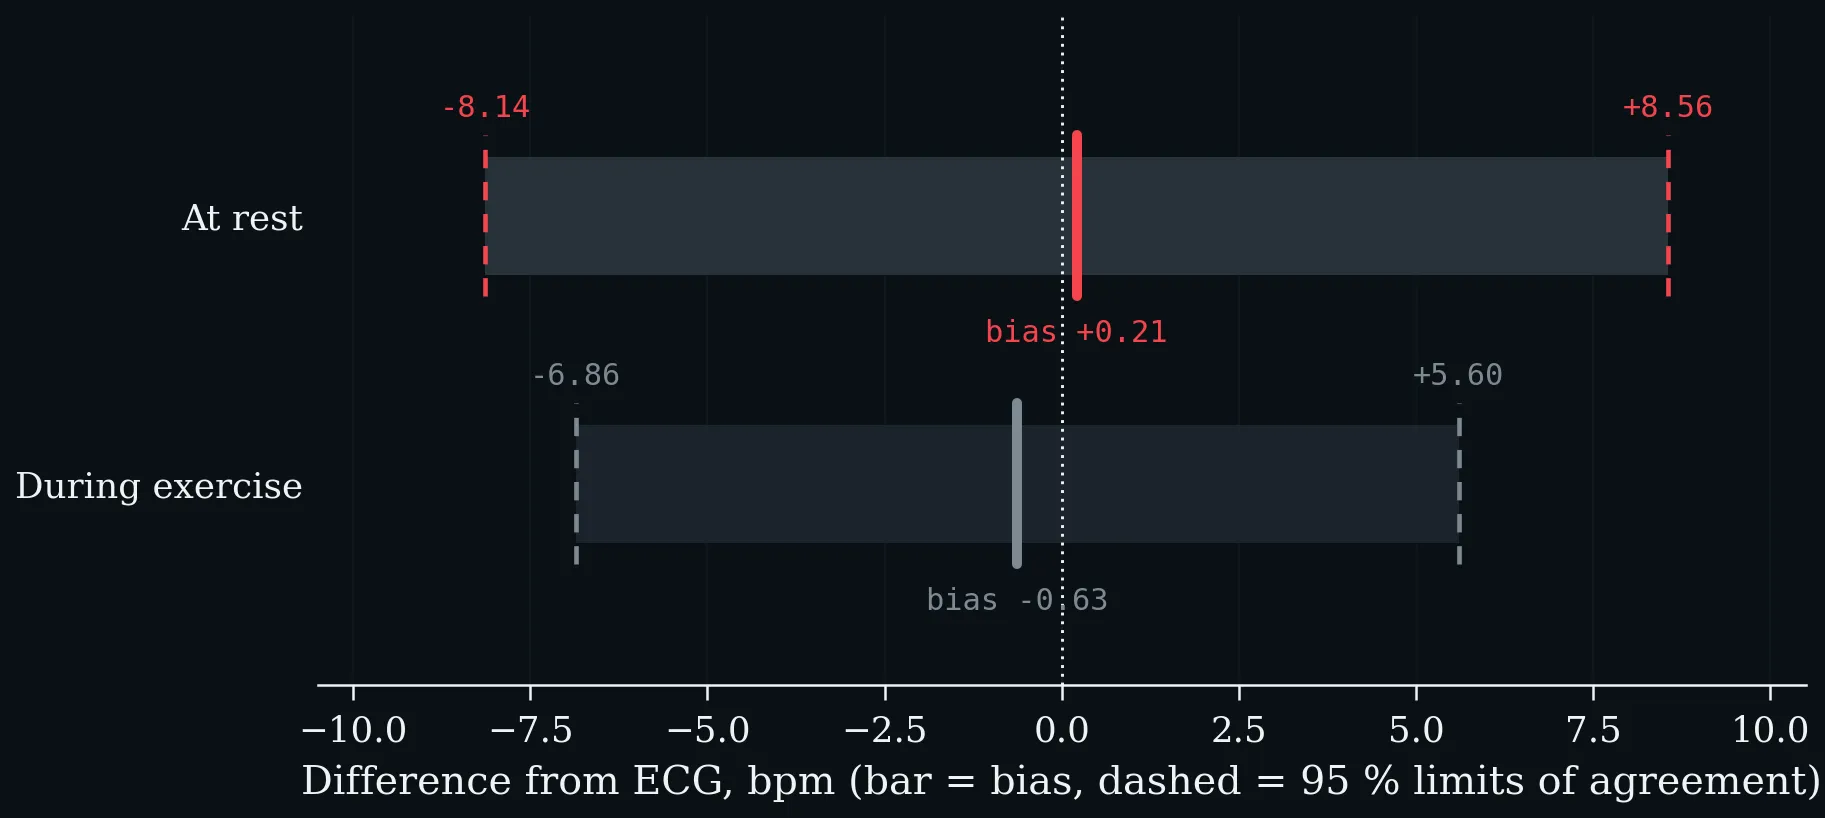
Agreement between wrist photoplethysmography and ECG, at rest and during exercise (Lambe et al. 2026). The bar is the bias; the dashed limits contain 95% of differences.
Everyday influences on resting heart rate, against the within-person daily noise band (shaded): day versus night (Speed et al. 2023), menstrual cycle phase (Shilaih et al. 2017), alcohol (Grosicki et al. 2026) and season (Quer et al. 2020). Anything smaller than roughly five beats, on one night, is weather.
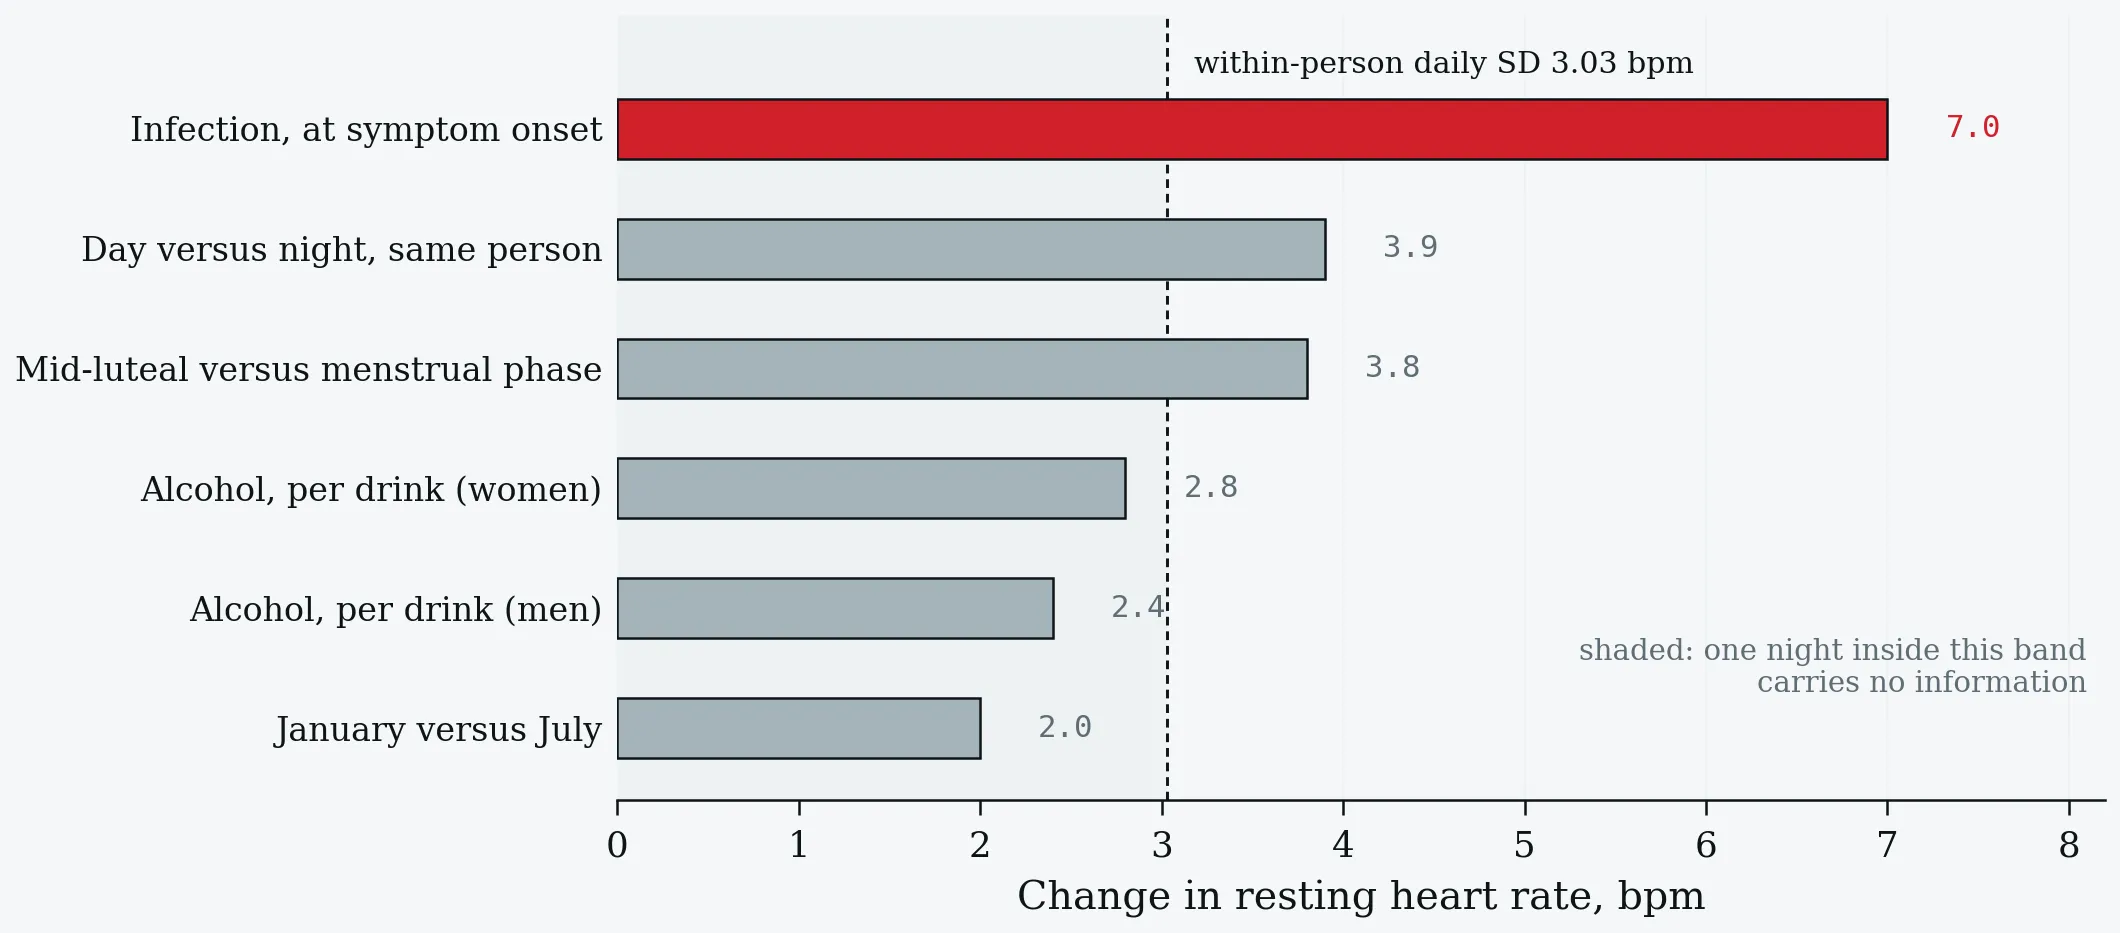
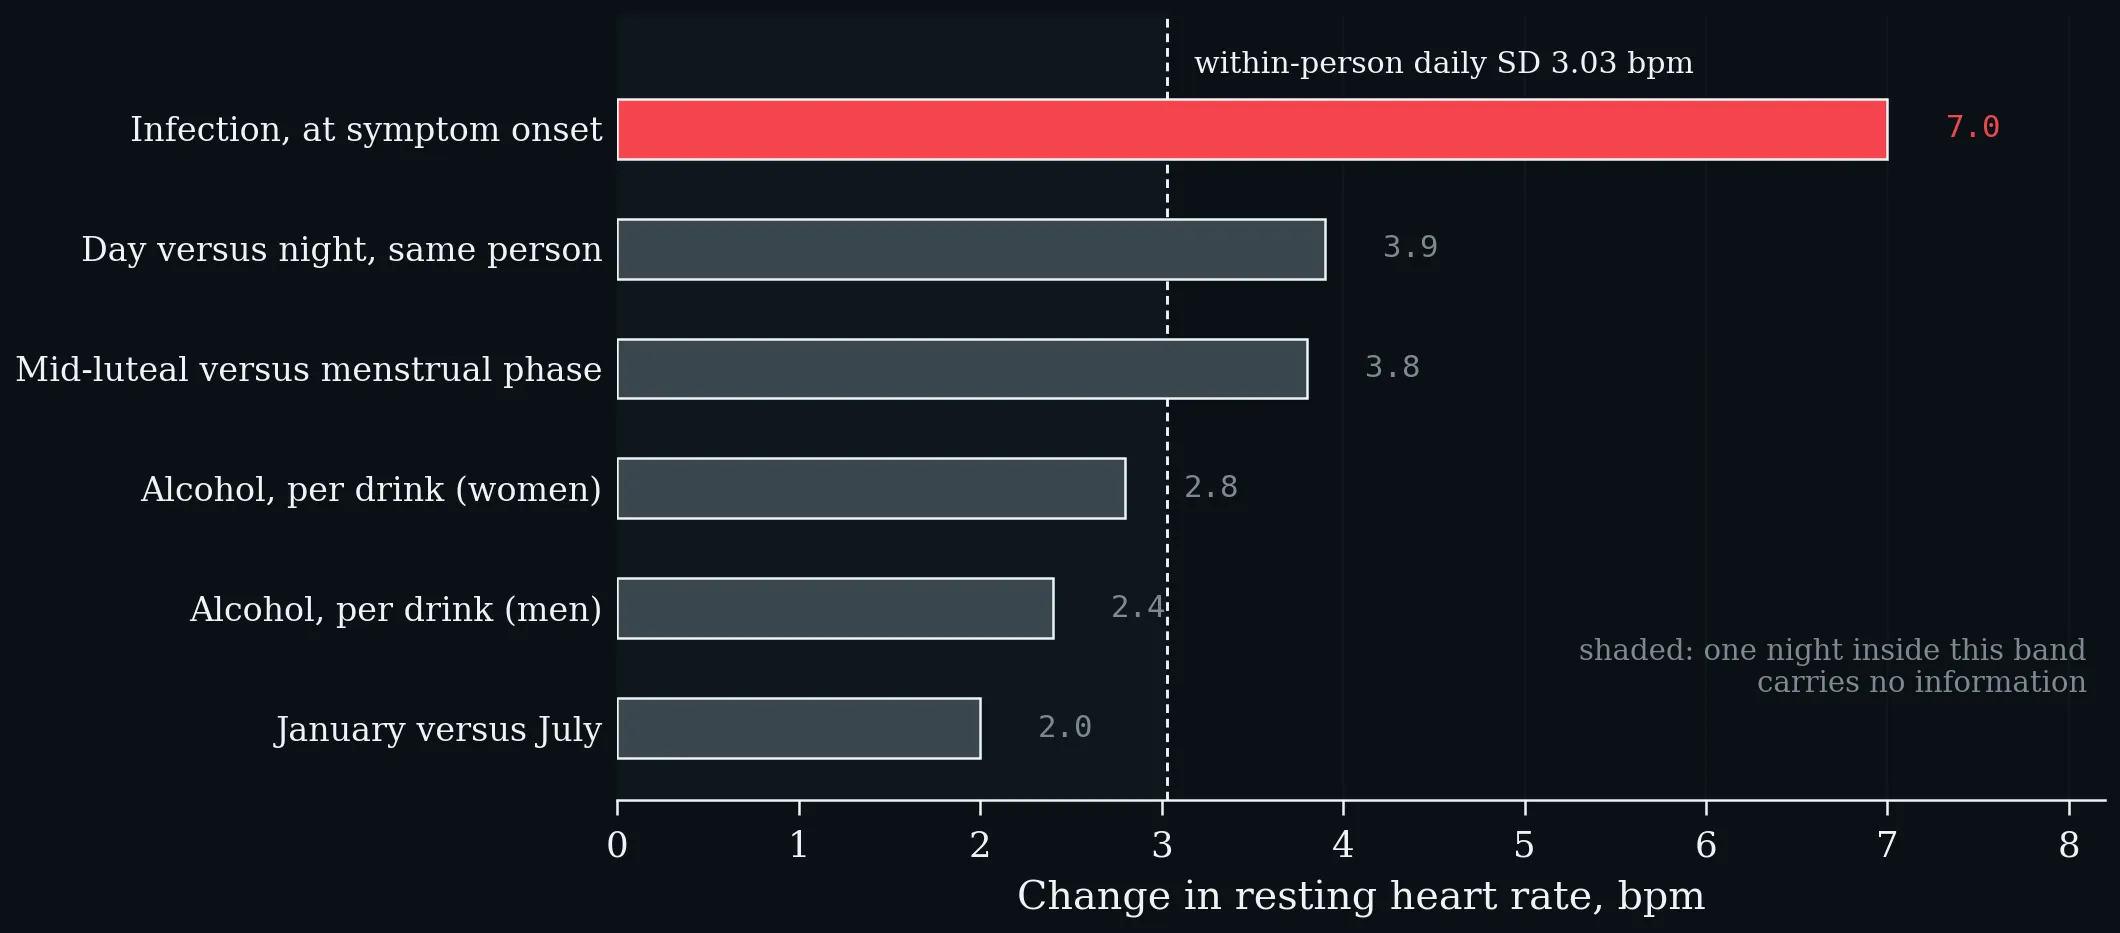
Everyday influences on resting heart rate, against the within-person daily noise band (shaded): day versus night (Speed et al. 2023), menstrual cycle phase (Shilaih et al. 2017), alcohol (Grosicki et al. 2026) and season (Quer et al. 2020). Anything smaller than roughly five beats, on one night, is weather.
Discrimination in the DETECT study (Quer et al. 2021). Resting-heart-rate elevation alone performs at chance; its value is as one channel among several, not as a test.
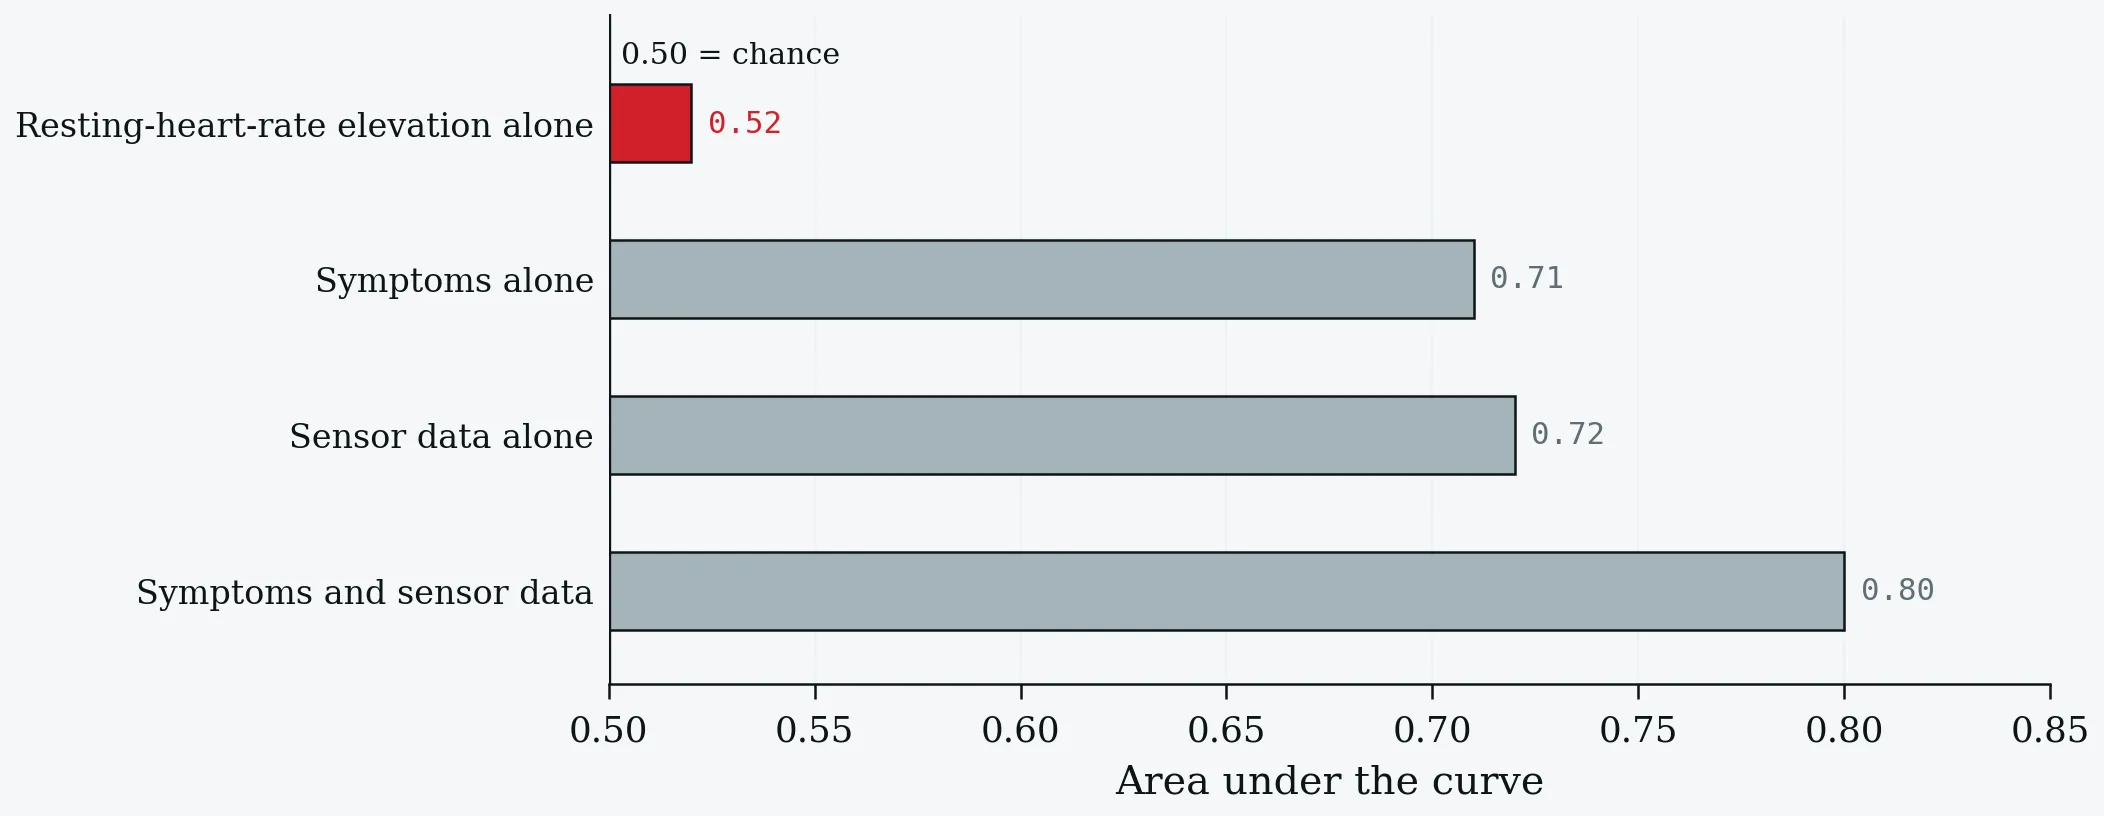
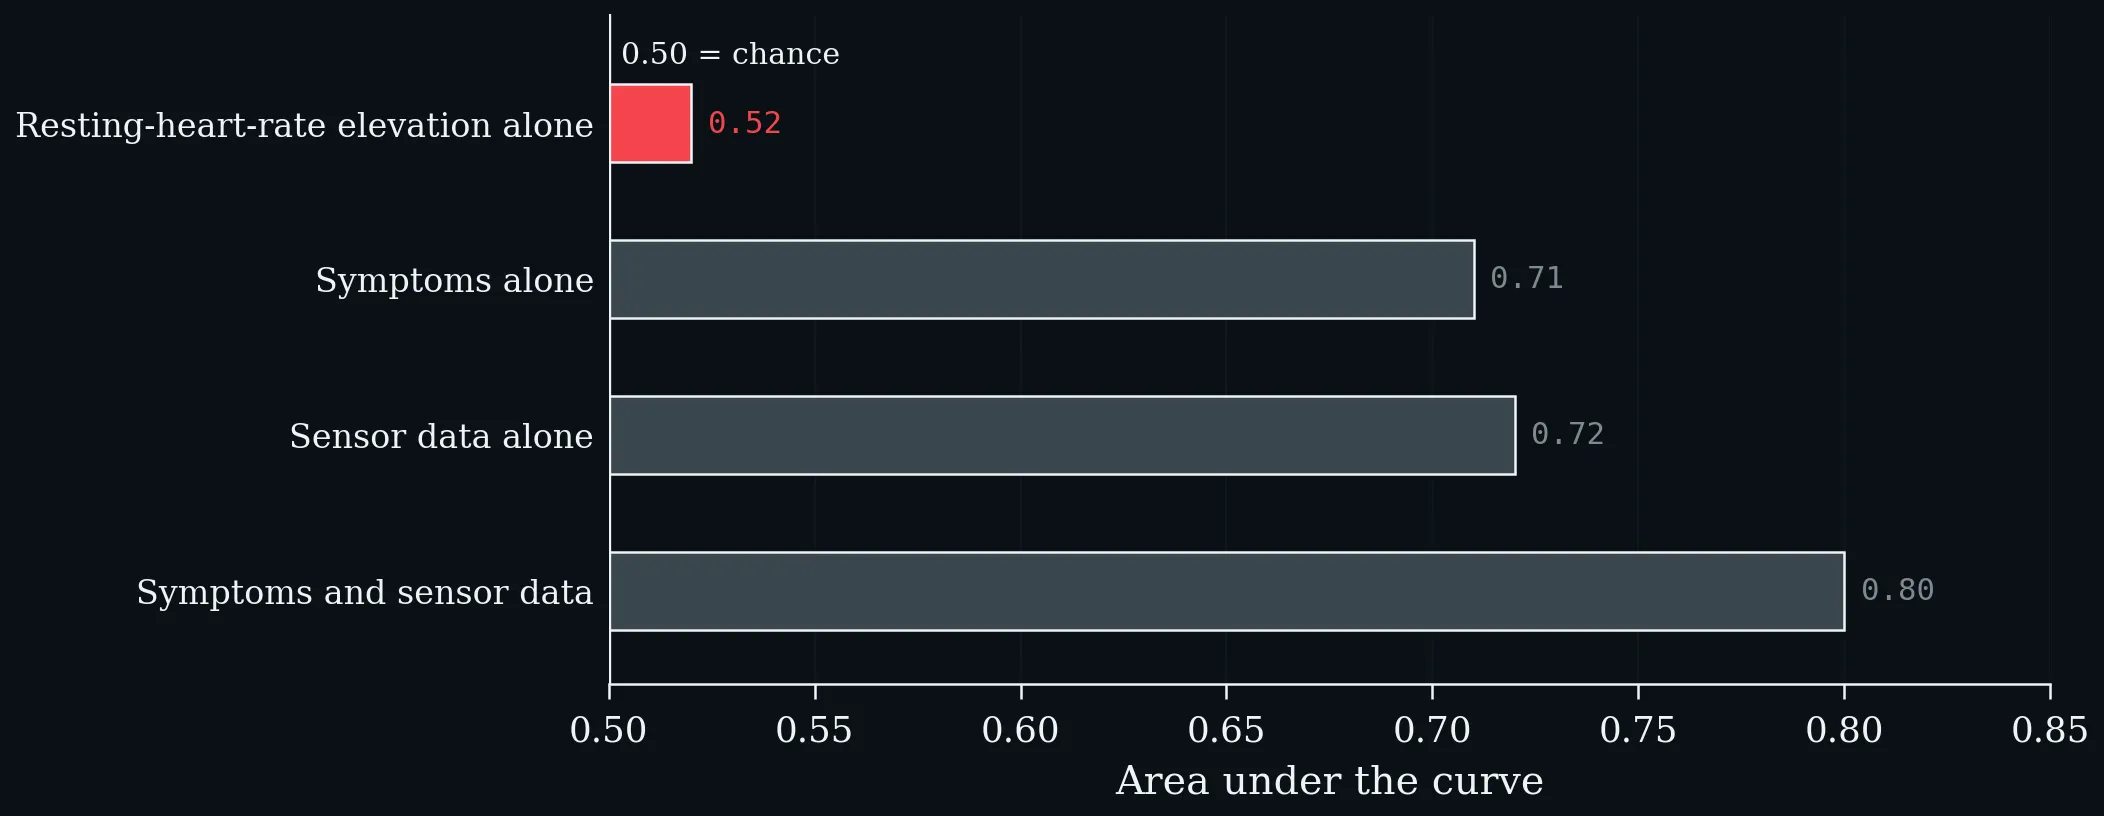
Discrimination in the DETECT study (Quer et al. 2021). Resting-heart-rate elevation alone performs at chance; its value is as one channel among several, not as a test.
Days to return to baseline after COVID-19 in 234 COVID-positive versus 641 symptomatic test-negative participants (Radin et al. 2021). Resting heart rate is the slowest of the three wearable metrics by a factor of more than two.
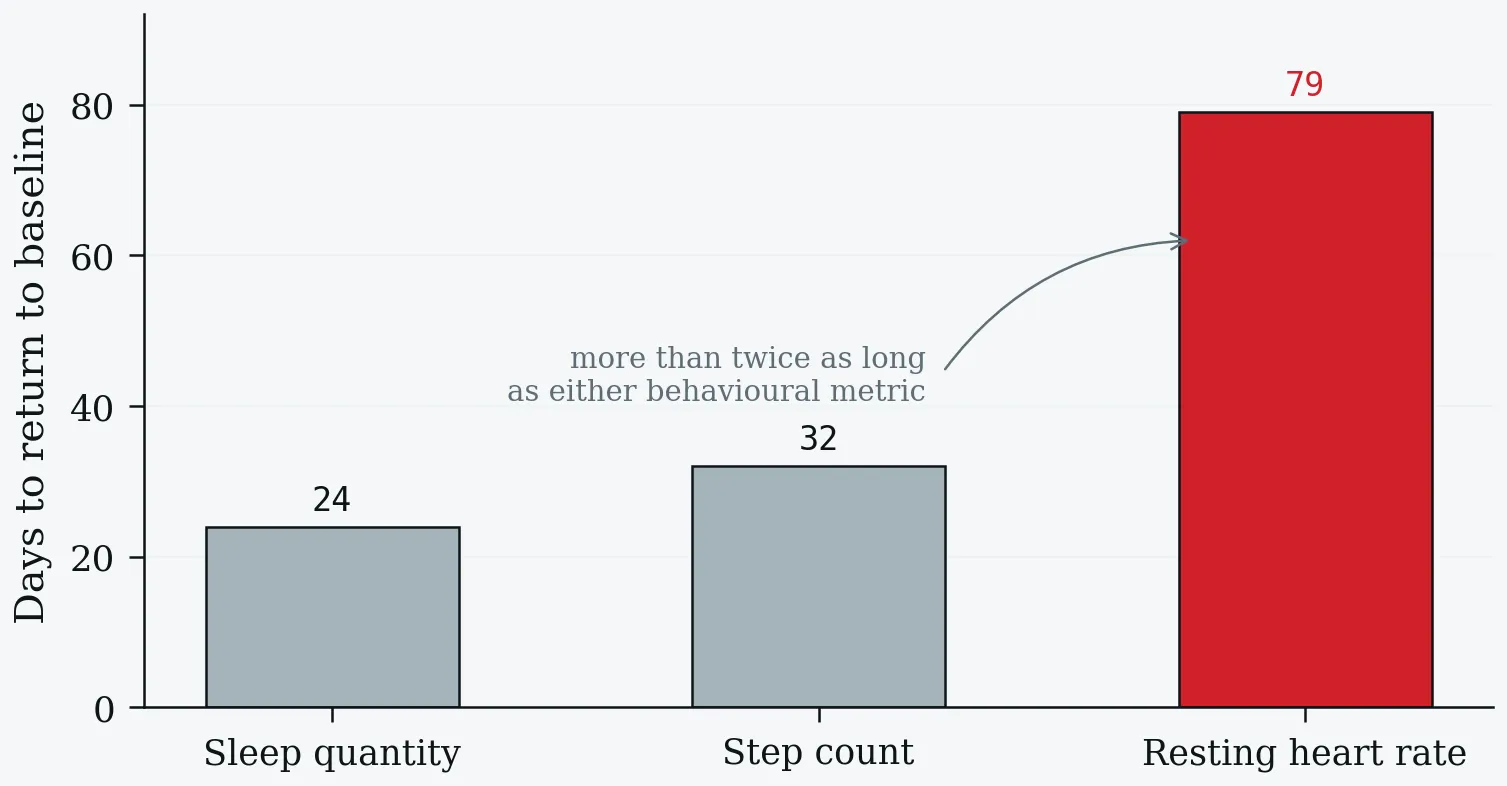
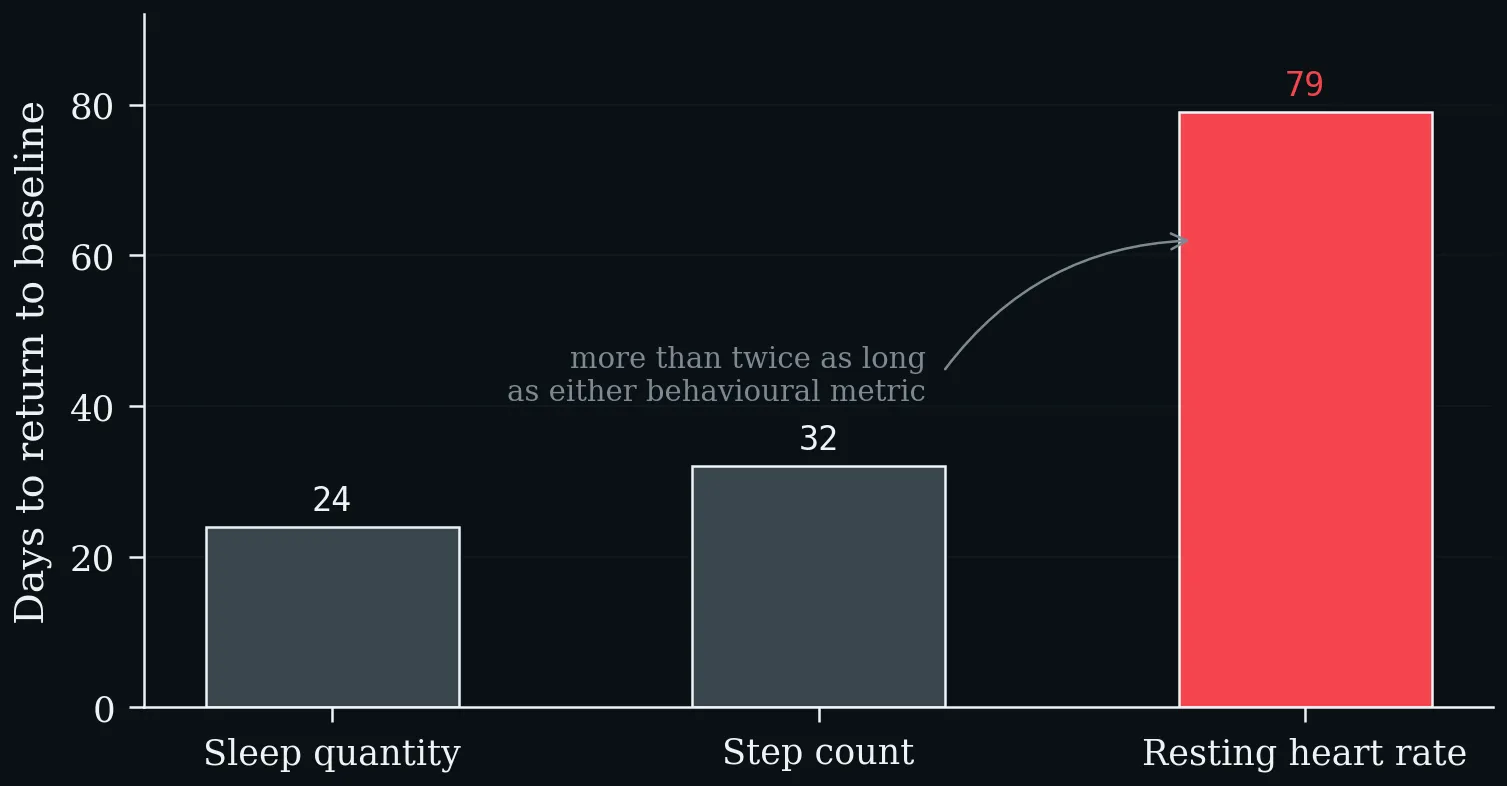
Days to return to baseline after COVID-19 in 234 COVID-positive versus 641 symptomatic test-negative participants (Radin et al. 2021). Resting heart rate is the slowest of the three wearable metrics by a factor of more than two.
Three modern equations and the rule of thumb, against measured means from two large reference cohorts (Nes et al. 2013; Kaminsky et al. 2015). All three cross 220 − age at about age forty.
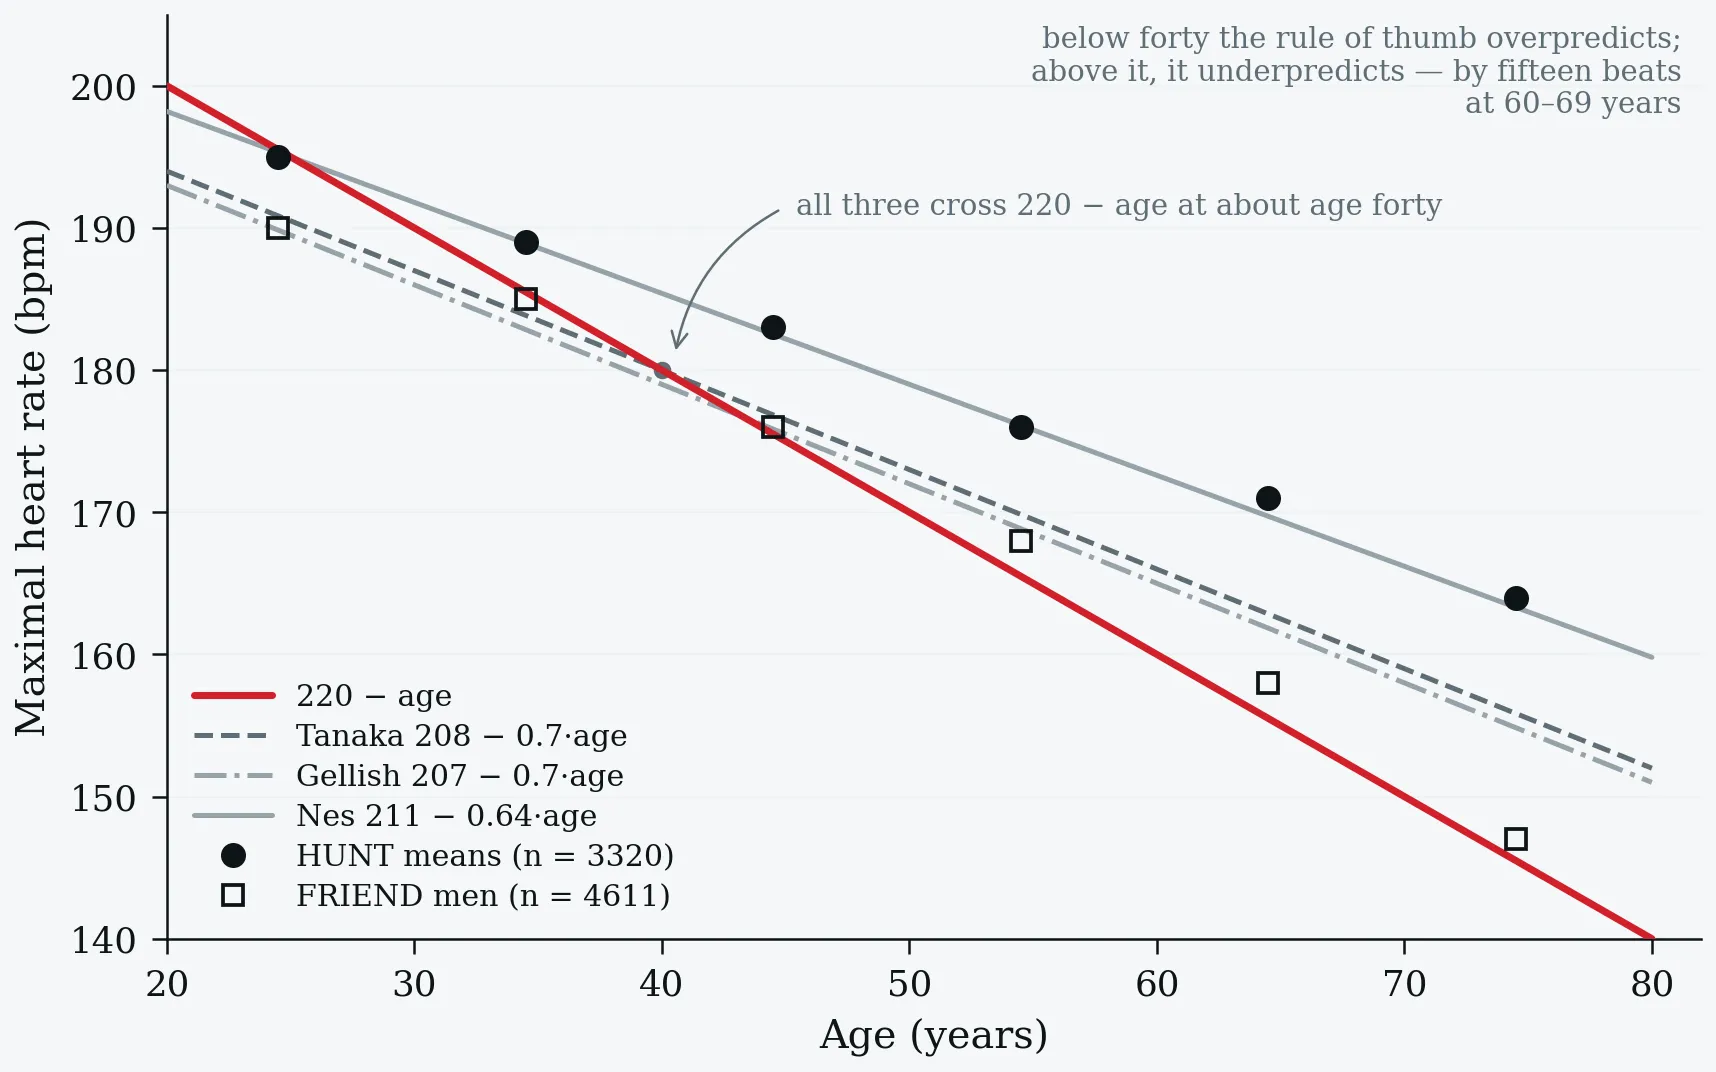
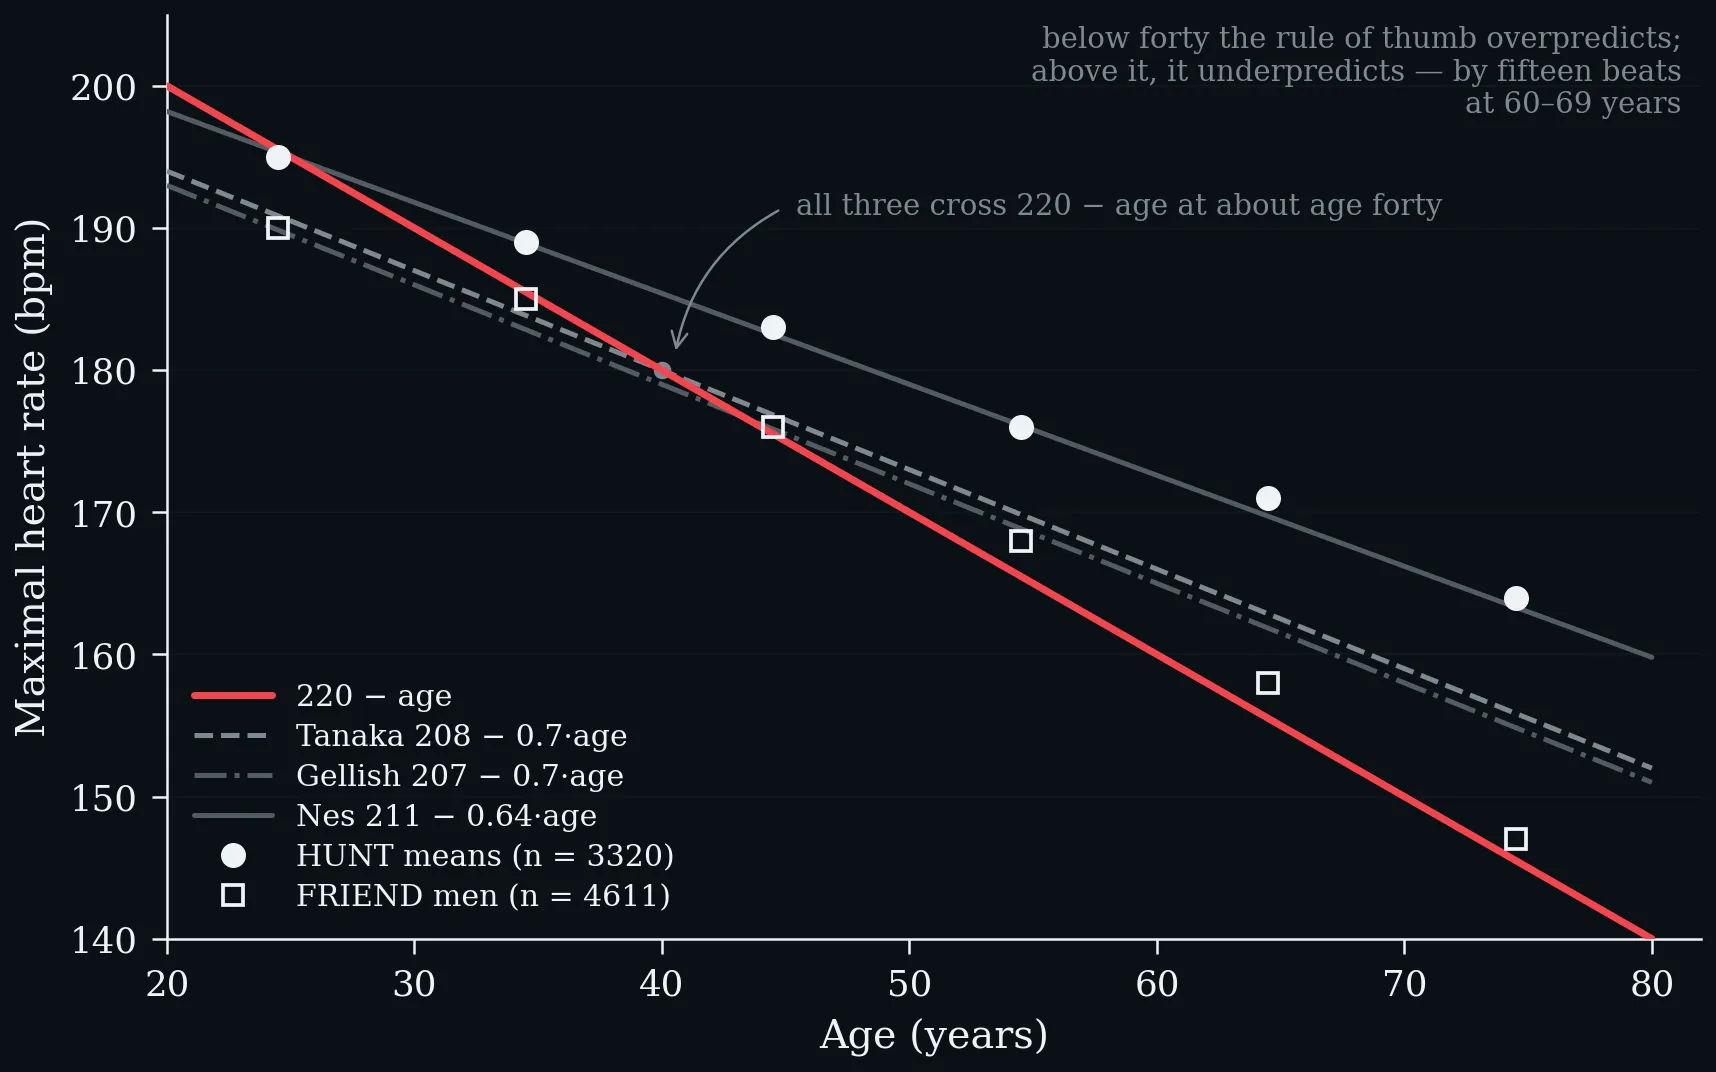
Three modern equations and the rule of thumb, against measured means from two large reference cohorts (Nes et al. 2013; Kaminsky et al. 2015). All three cross 220 − age at about age forty.
One fifty-year-old. The four competing formulas span nine beats; the band containing about 95% of fifty-year-olds spans forty-four.
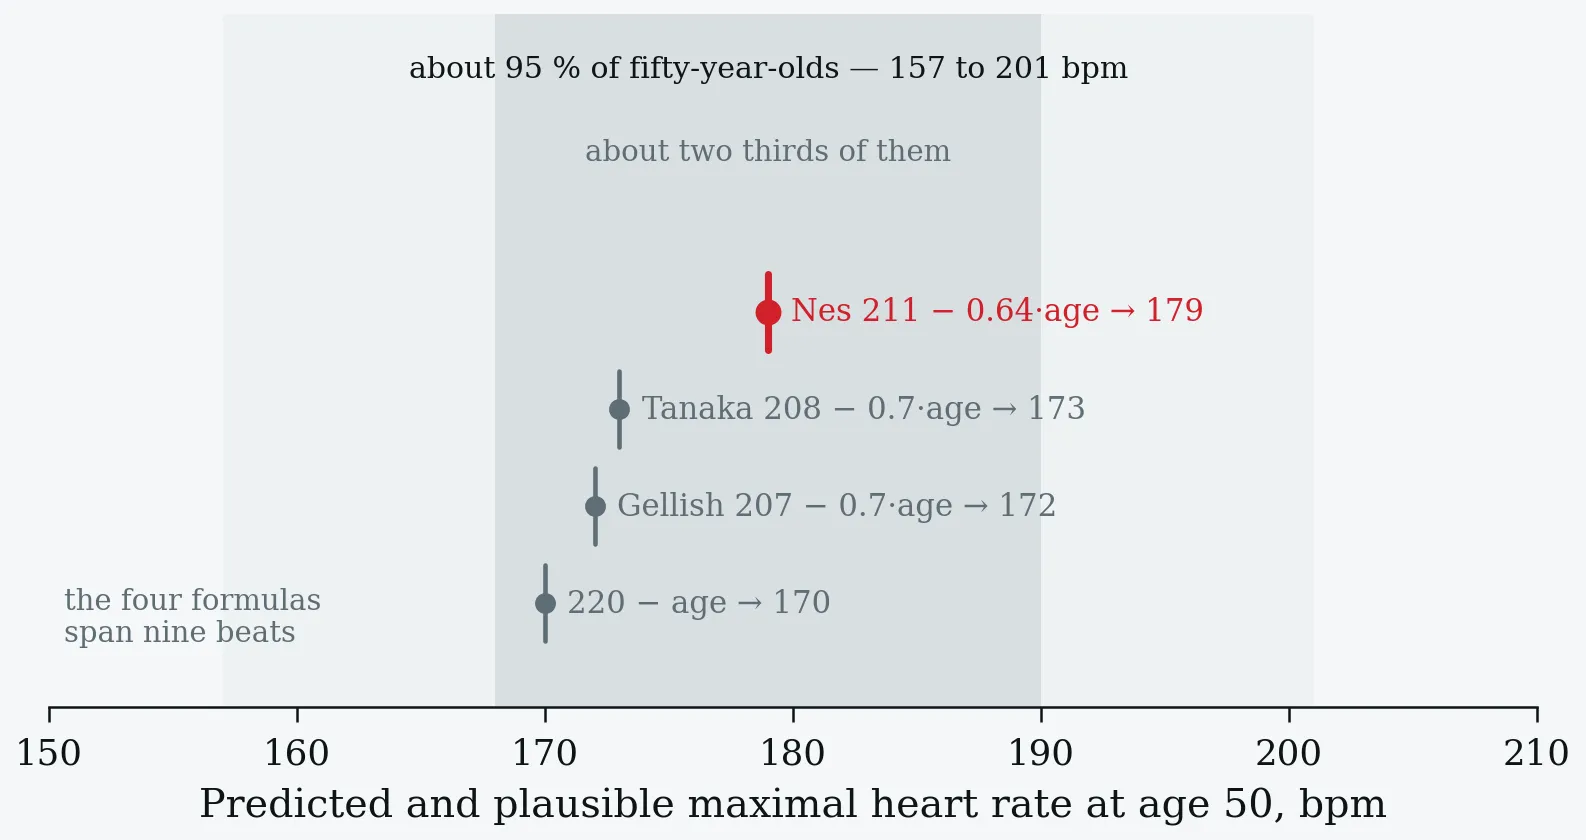
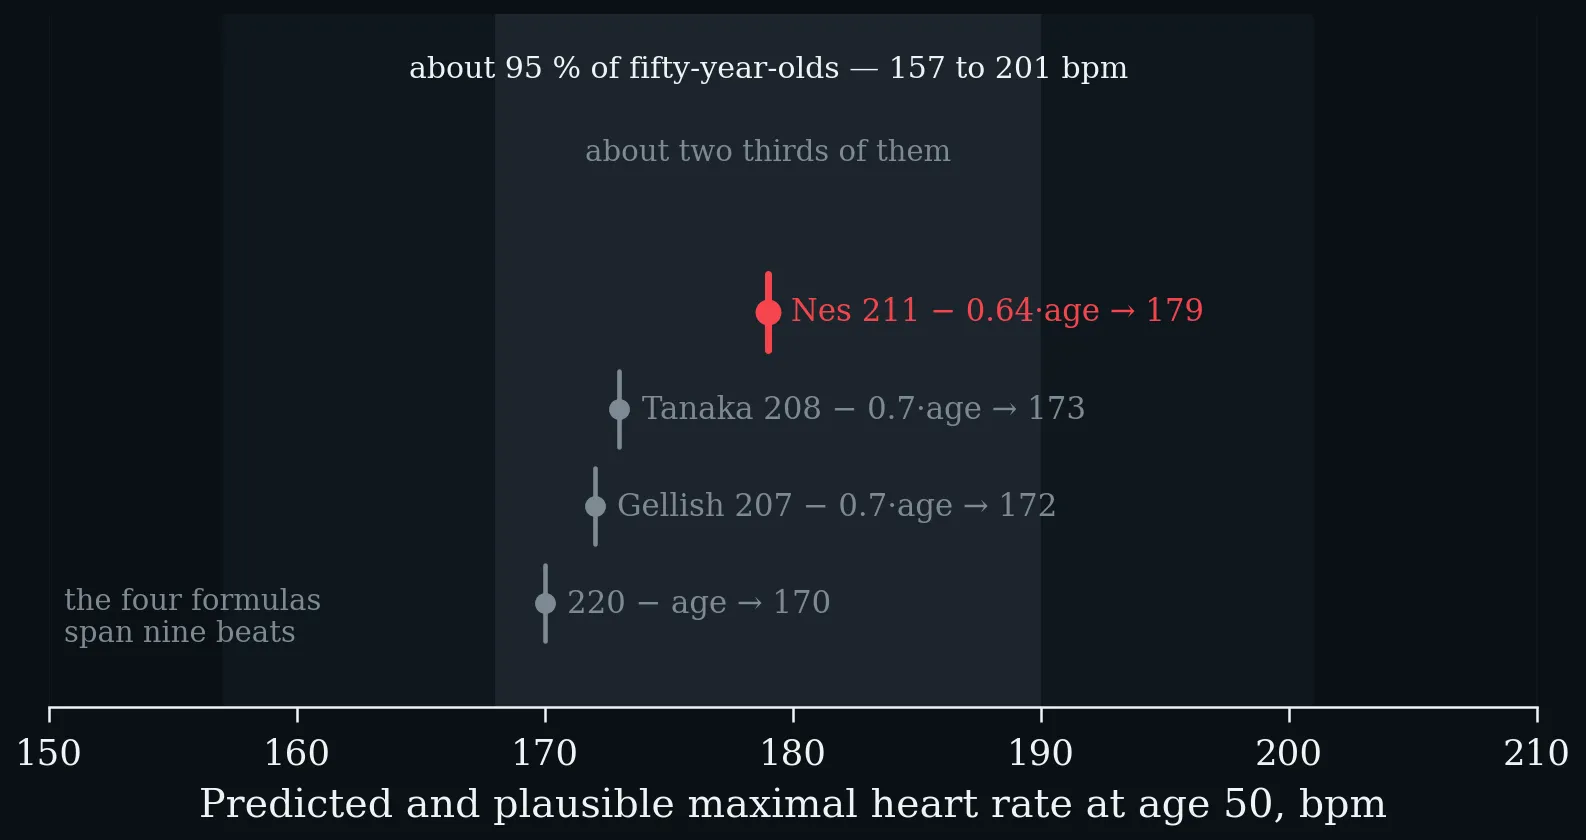
One fifty-year-old. The four competing formulas span nine beats; the band containing about 95% of fifty-year-olds spans forty-four.
Share of HUNT participants whose measured maximum exceeded 220 − age, by age band (Nes et al. 2013). The underprediction grows with age, reaching fifteen beats at 60–69 years.
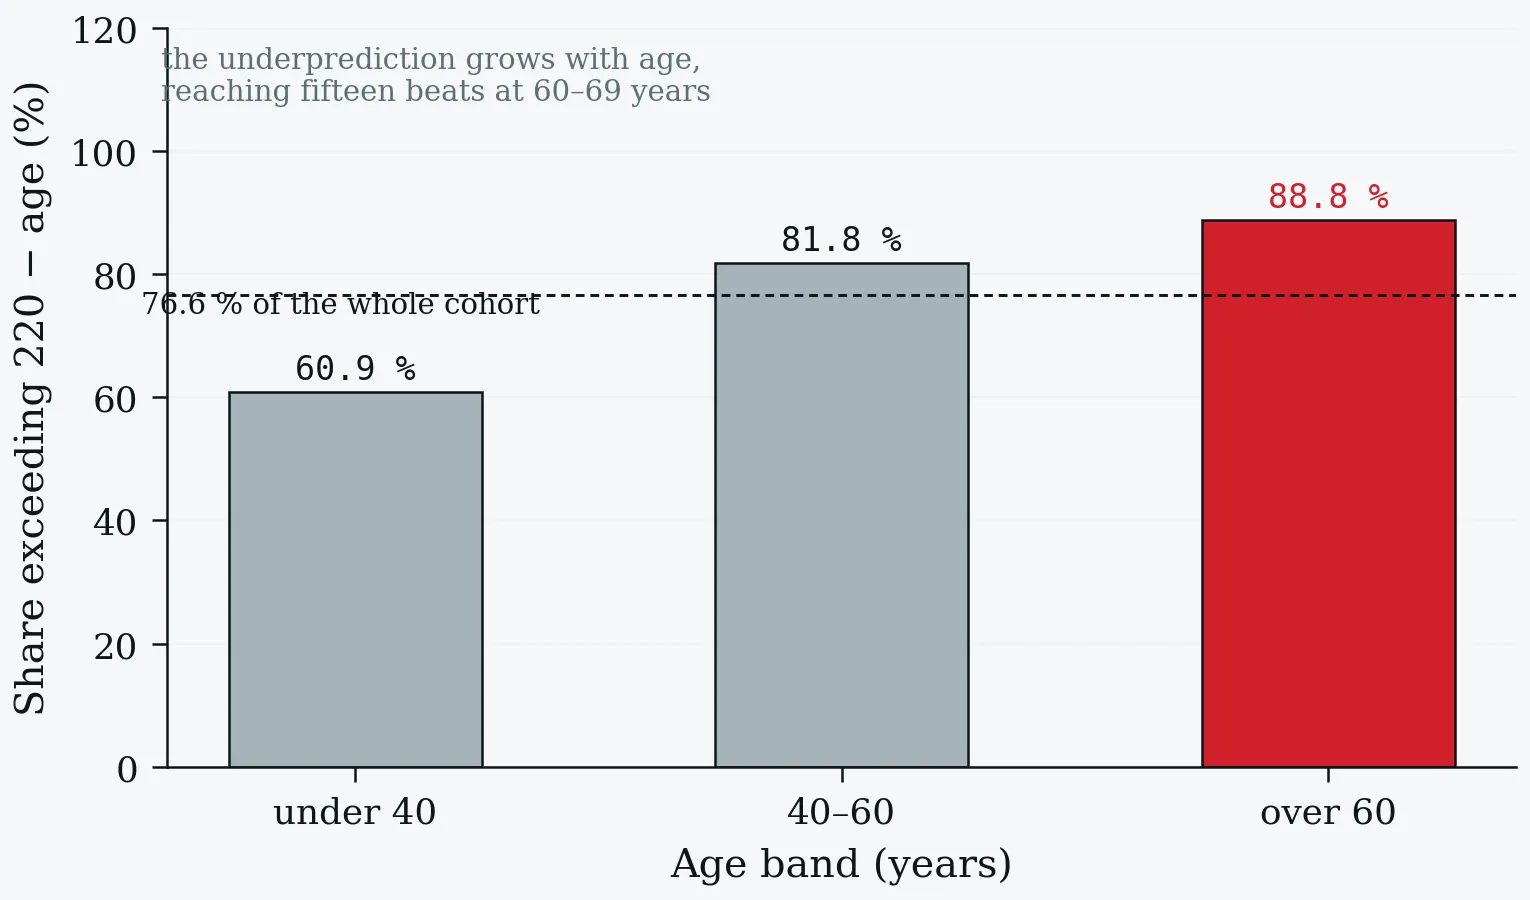
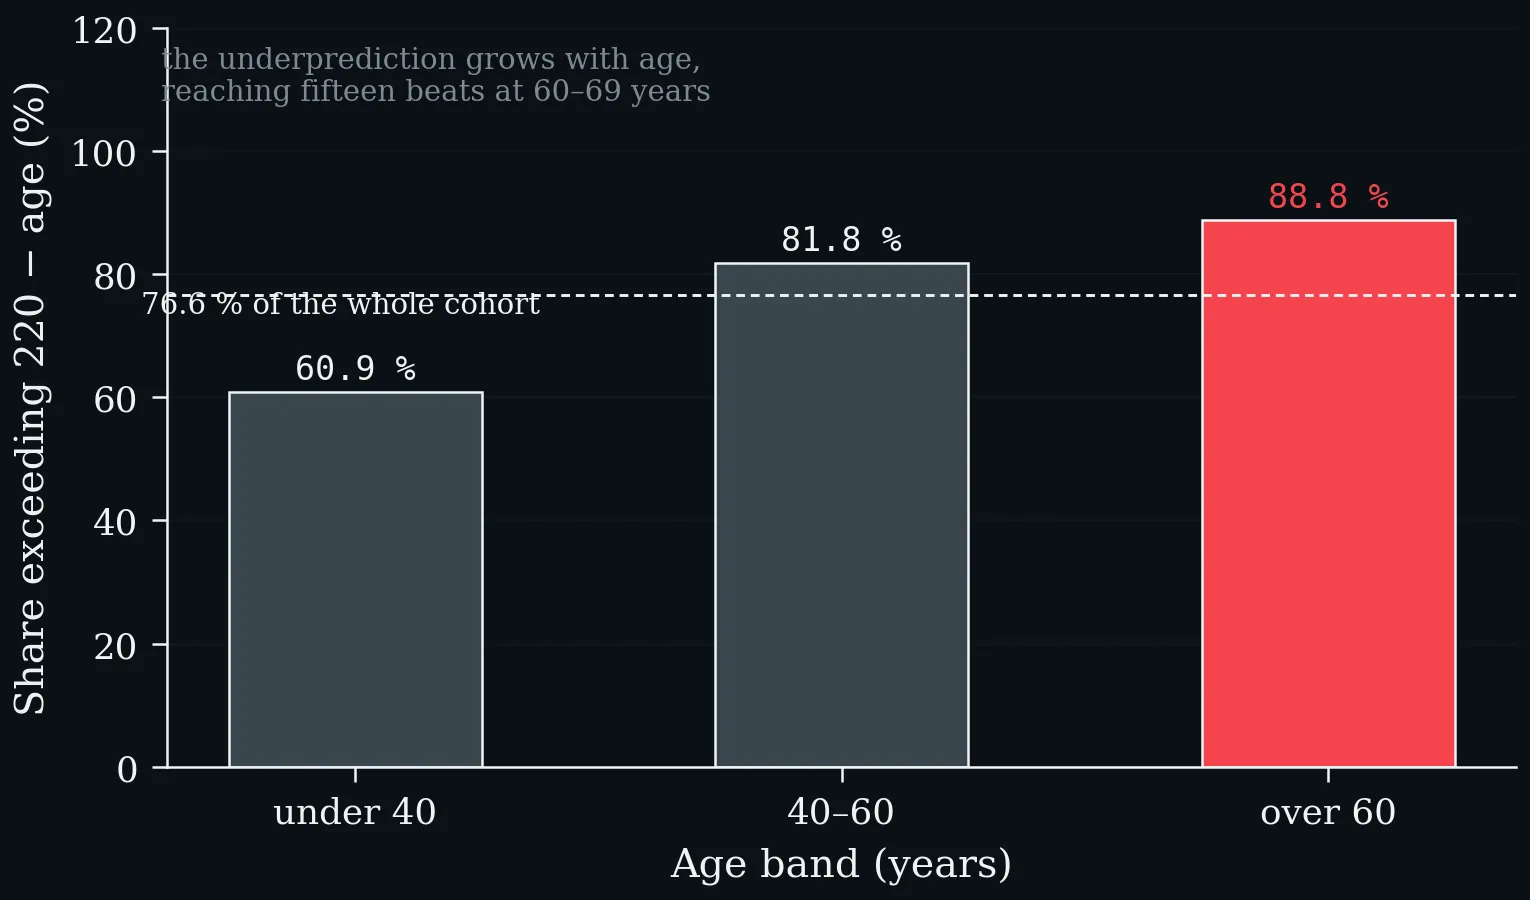
Share of HUNT participants whose measured maximum exceeded 220 − age, by age band (Nes et al. 2013). The underprediction grows with age, reaching fifteen beats at 60–69 years.
Pooled hazard ratios from nine prospective general-population cohorts: 34 267 participants for cardiovascular events, 41 600 for mortality (Qiu et al. 2017).
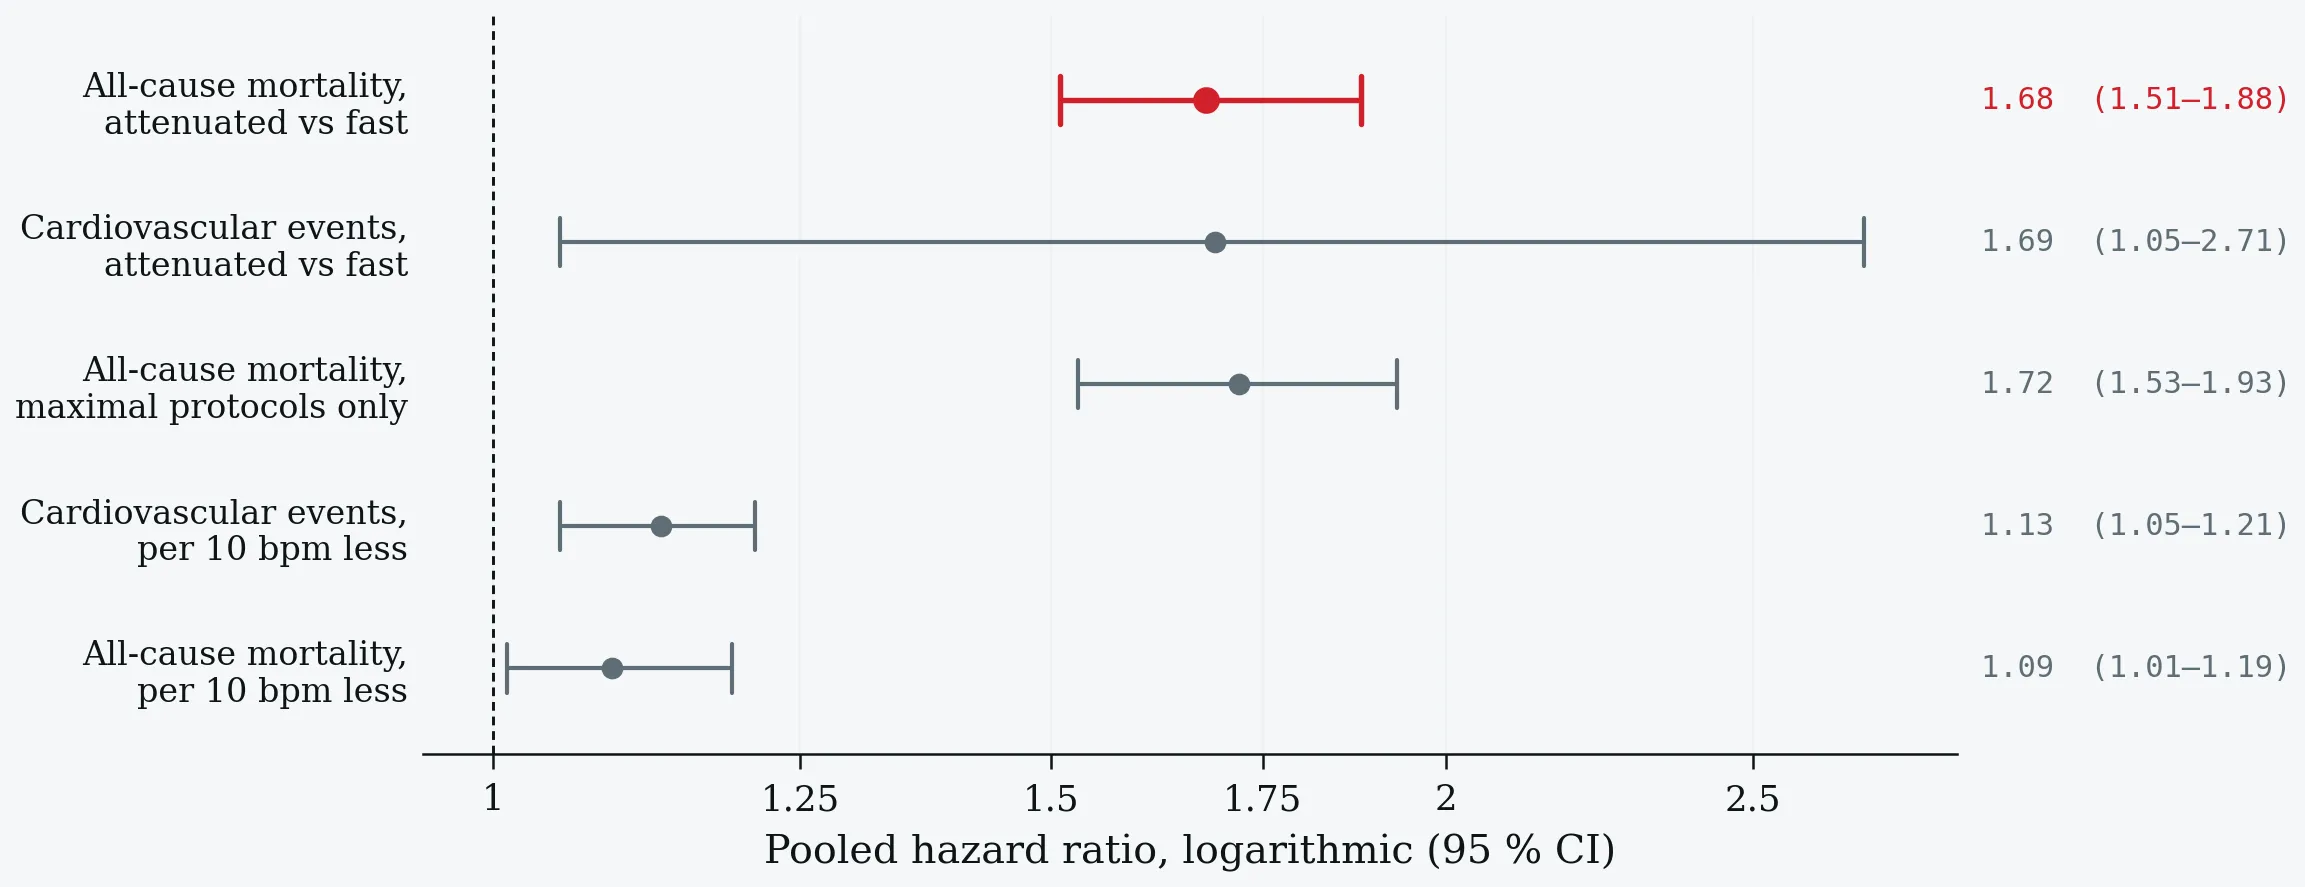
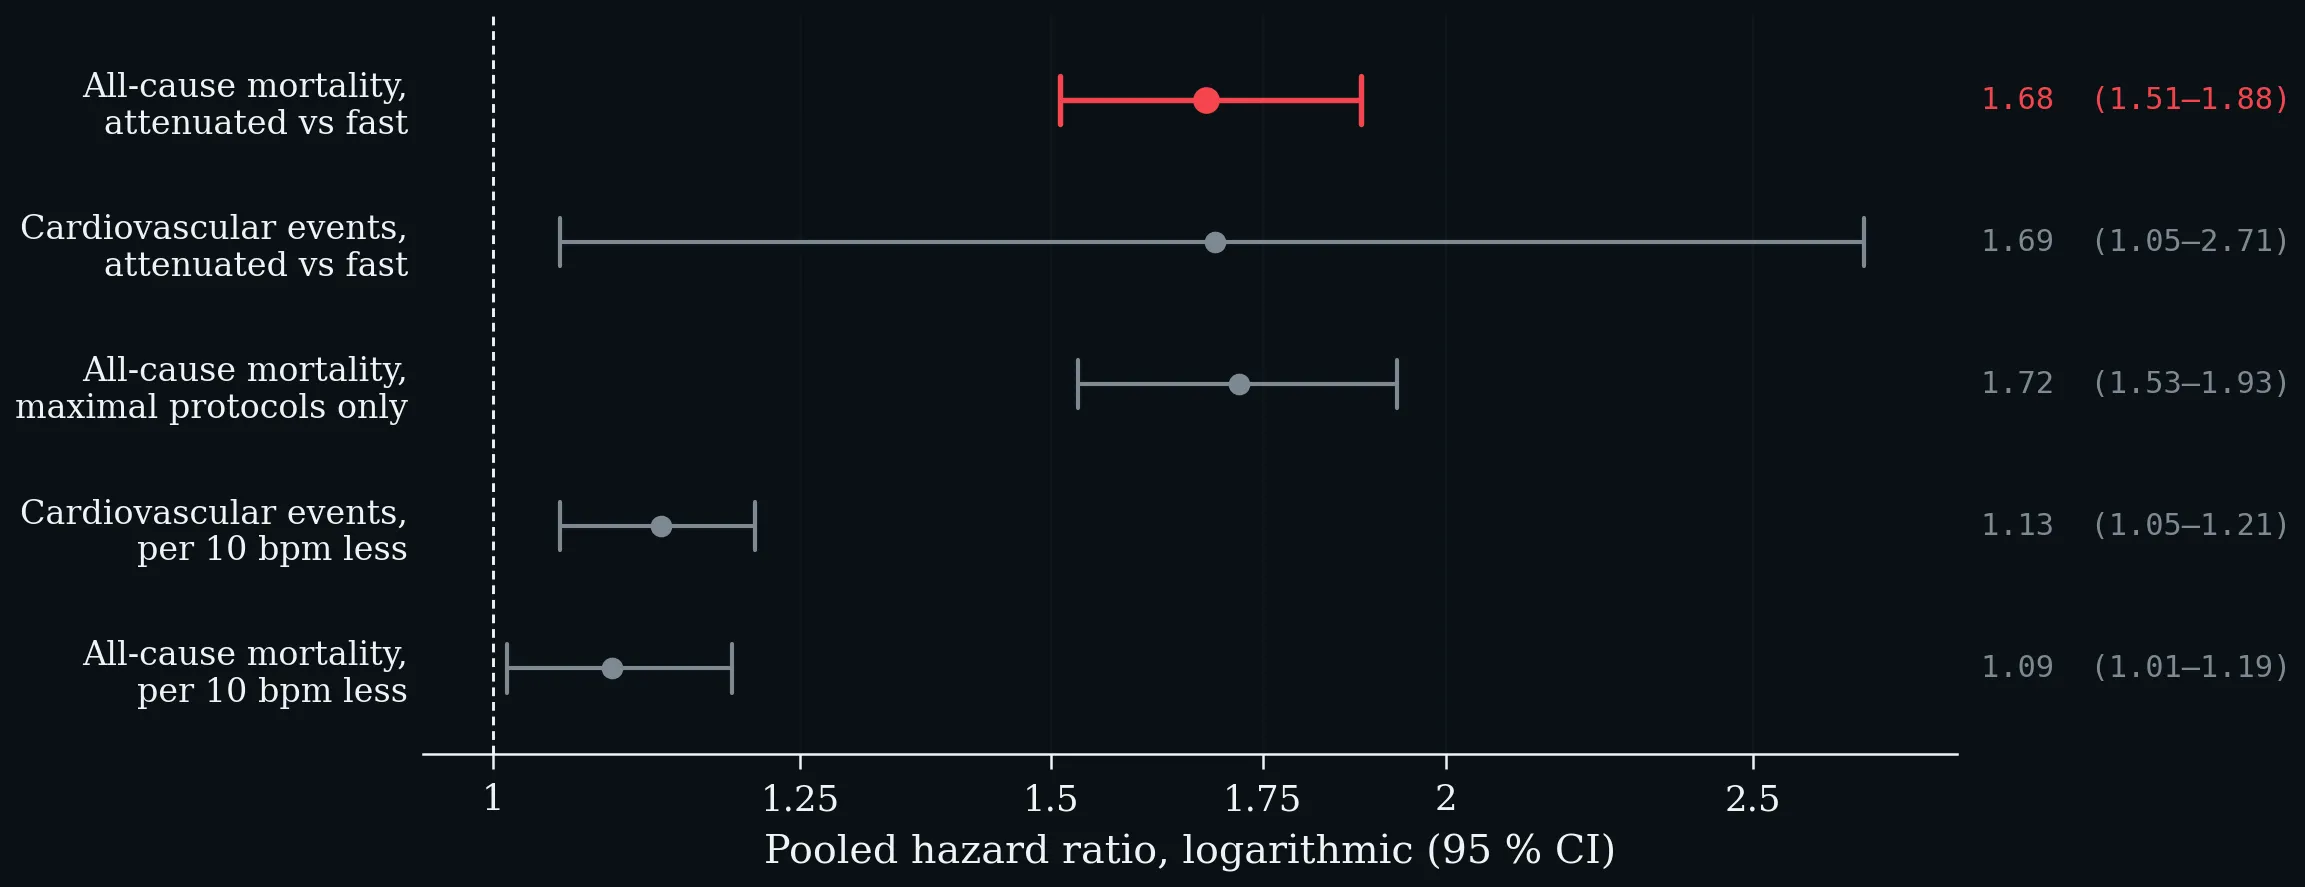
Pooled hazard ratios from nine prospective general-population cohorts: 34 267 participants for cardiovascular events, 41 600 for mortality (Qiu et al. 2017).
Risk rises sharply below roughly ten to fifteen beats and flattens above fifteen to twenty. Schematic: the shape and the cut-points are as reported, not digitised.
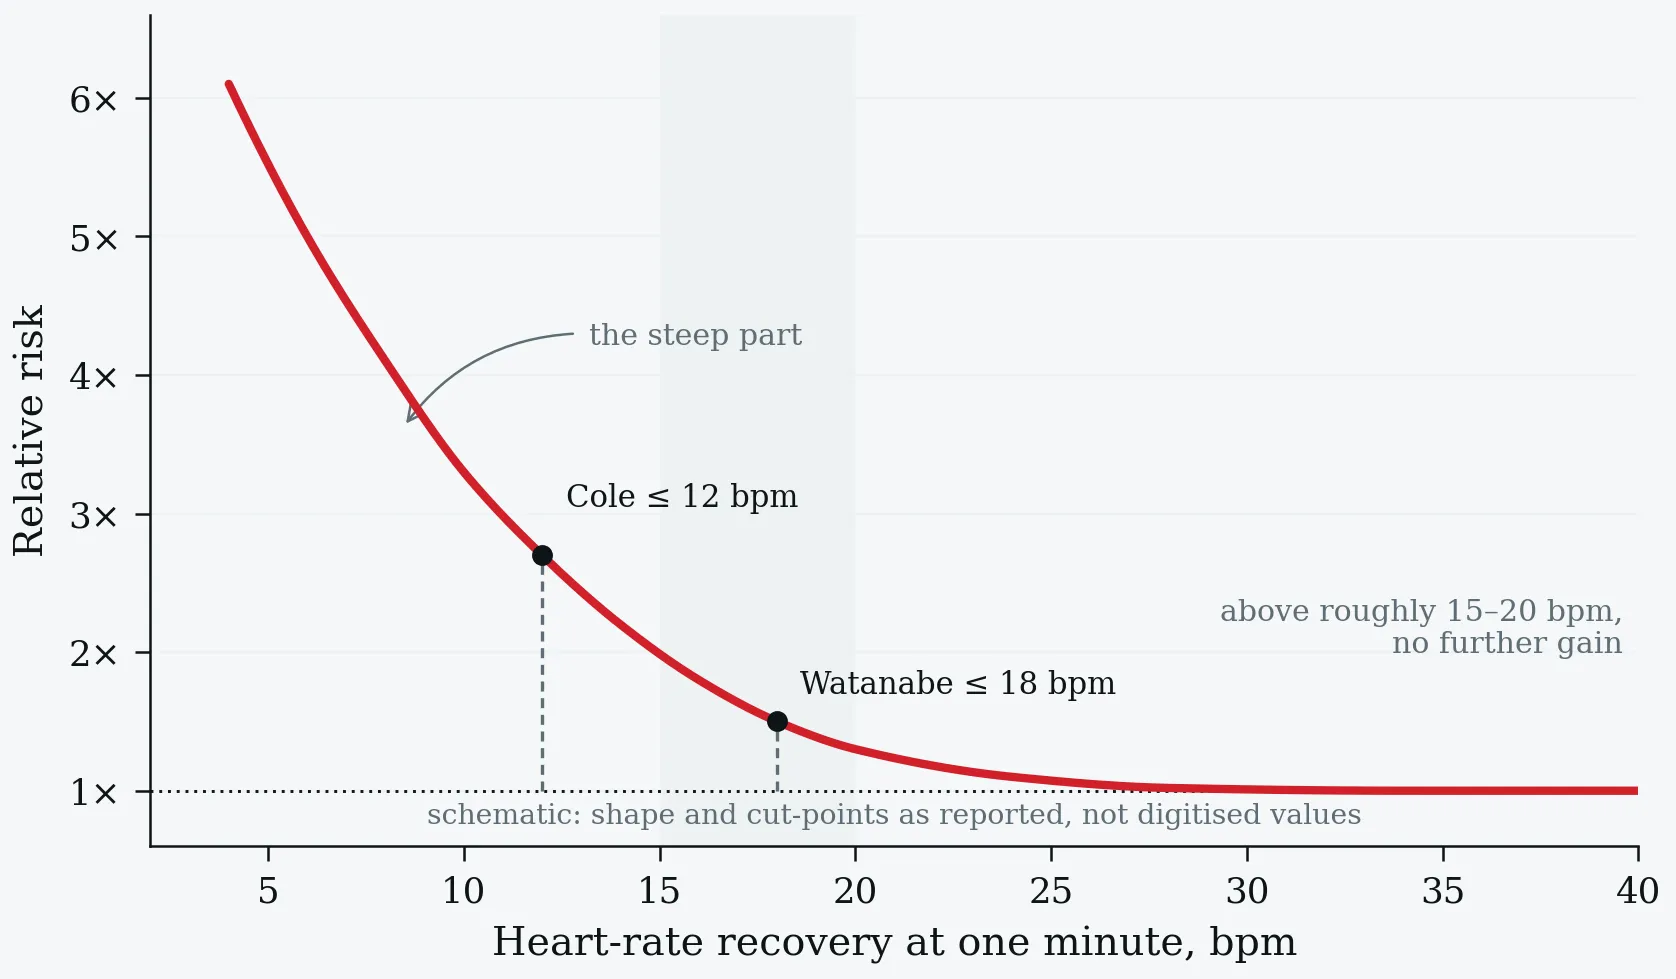
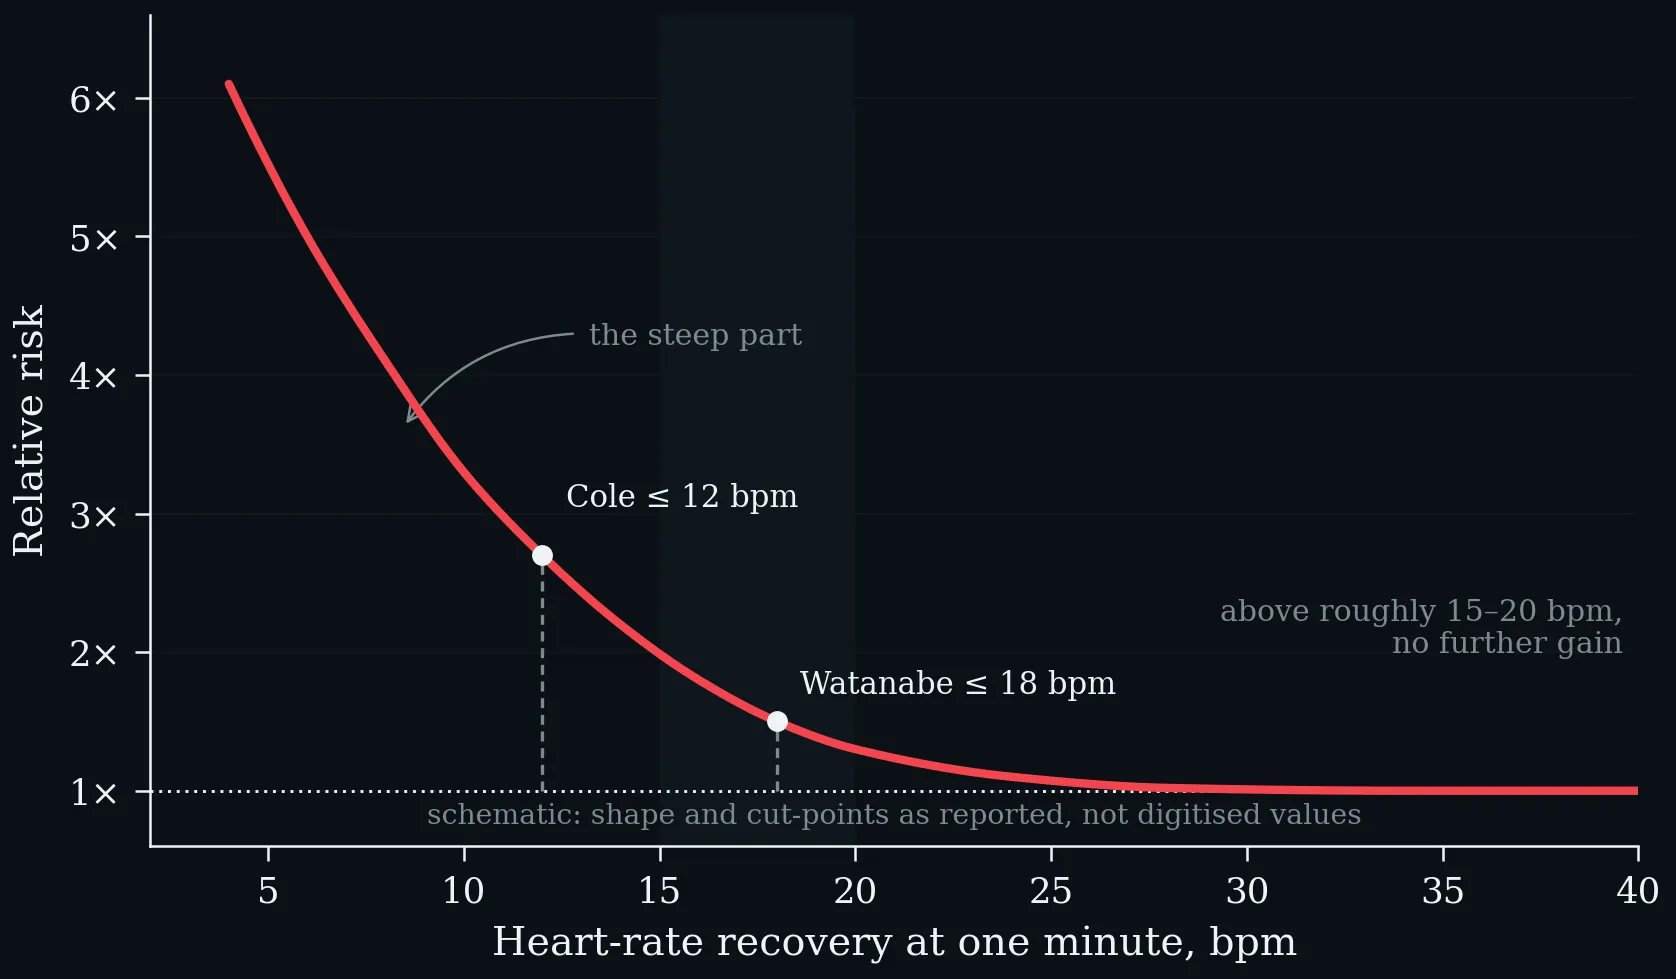
Risk rises sharply below roughly ten to fifteen beats and flattens above fifteen to twenty. Schematic: the shape and the cut-points are as reported, not digitised.
Lecture 4: Energy Expenditure, MET-concept, Thresholds, Determine Exercise Intensity
The FAO/WHO/UNU equations plotted for the two adult age bands. BMR rises linearly with body mass, and the sex difference is larger than the age difference across the whole range. Worked example: a 30-year-old man of 75 kg is predicted at 7.62 MJ·day⁻¹ ≈ 1821 kcal·day⁻¹ (FAO/WHO/UNU 2004).
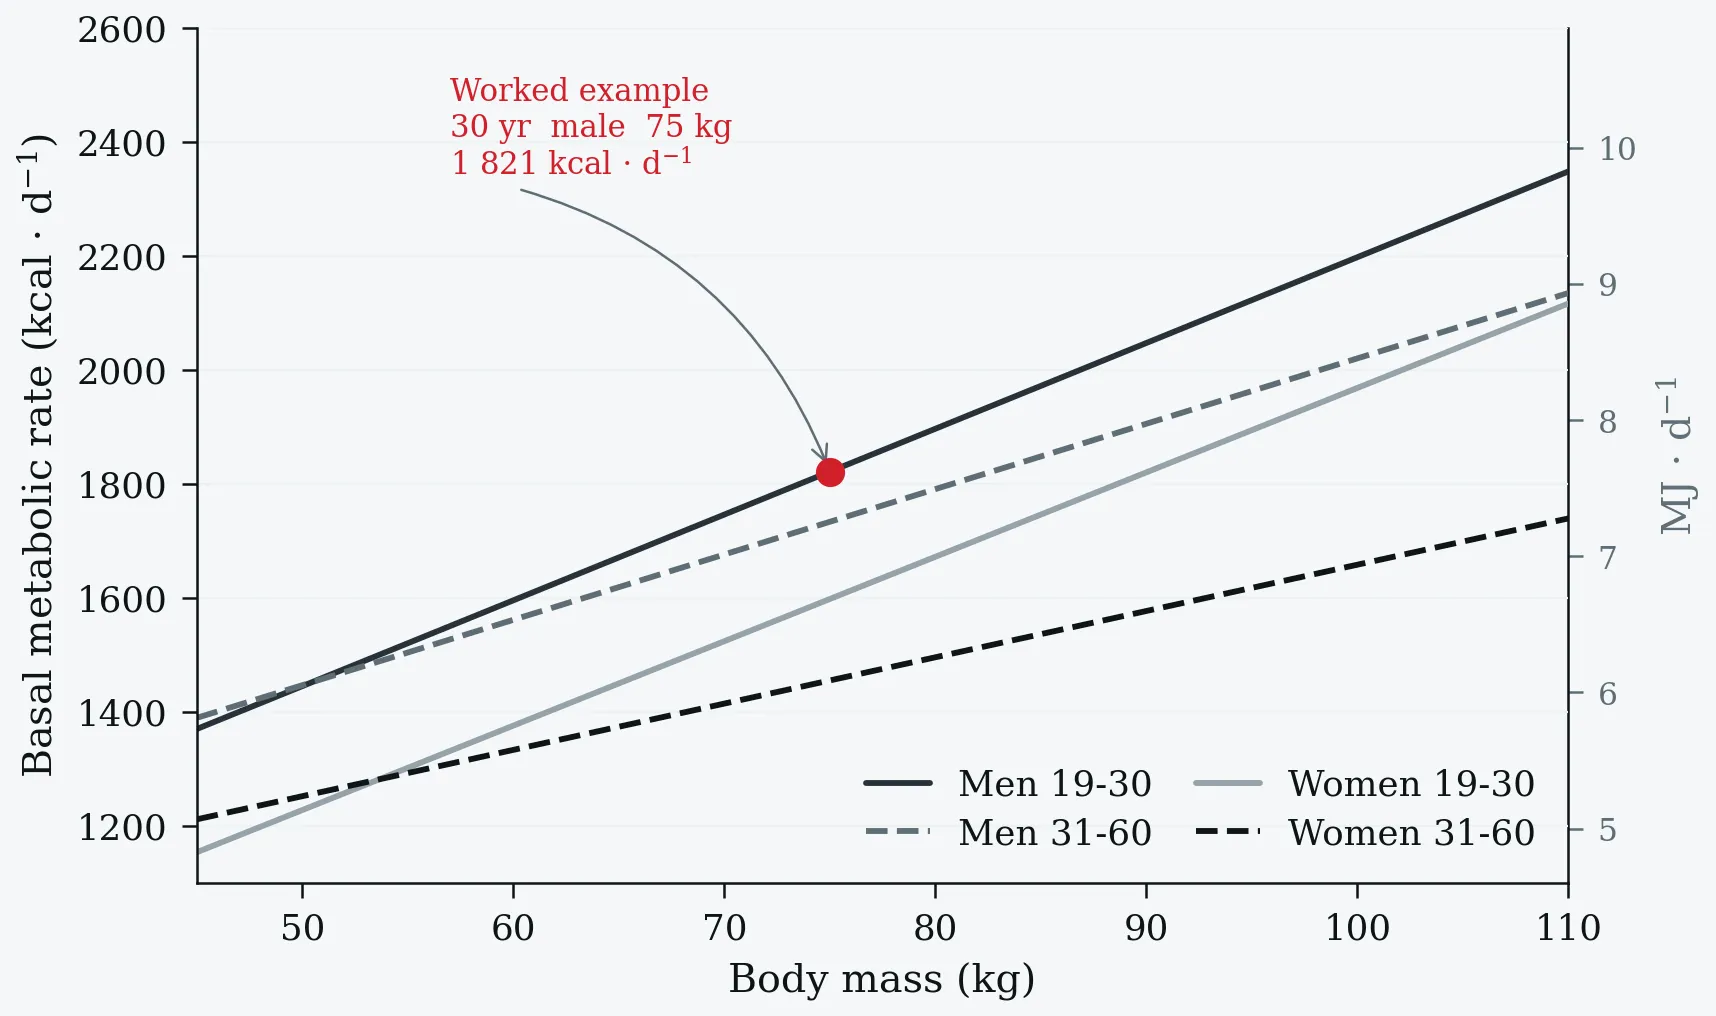
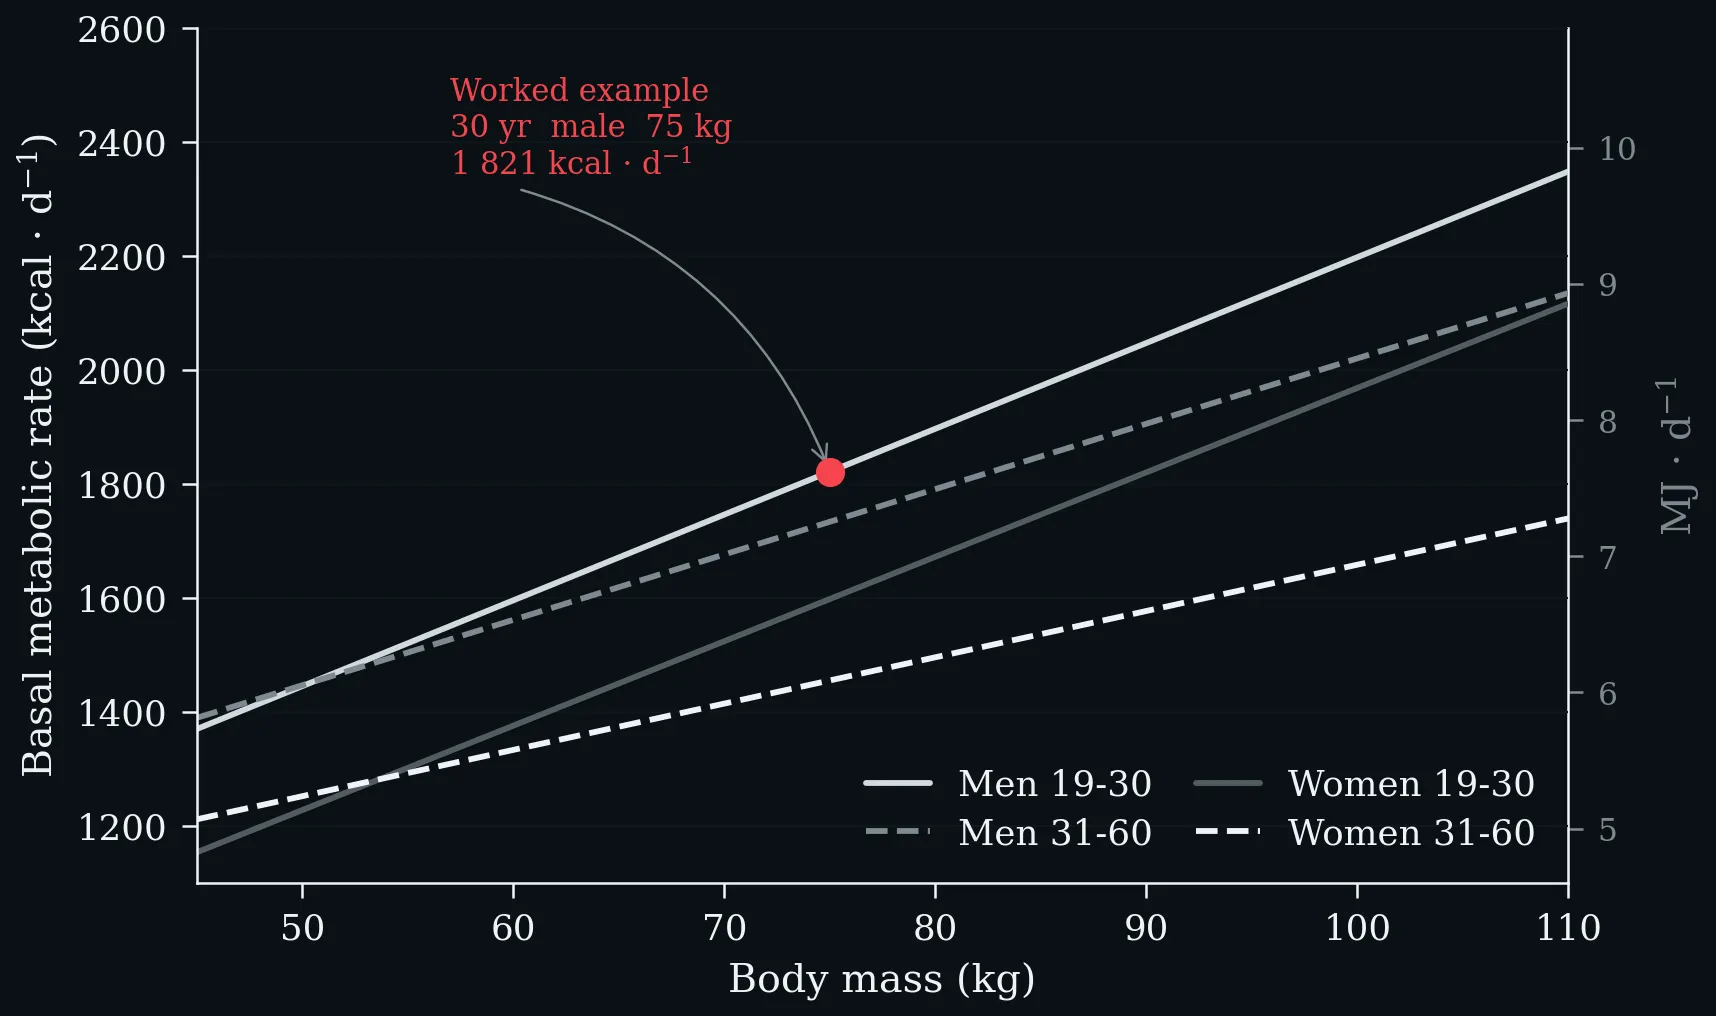
The FAO/WHO/UNU equations plotted for the two adult age bands. BMR rises linearly with body mass, and the sex difference is larger than the age difference across the whole range. Worked example: a 30-year-old man of 75 kg is predicted at 7.62 MJ·day⁻¹ ≈ 1821 kcal·day⁻¹ (FAO/WHO/UNU 2004).
Left: physical activity classification by MET range, after the Compendium of Physical Activities (Ainsworth et al. 2011), with the corresponding ACSM V̇O₂ cut-points on the upper axis. Right: the same activities recalculated for an individual whose resting metabolic rate is 2.8 instead of the conventional 3.5 mL·kg⁻¹·min⁻¹ — every tabulated MET value rises by 25 %.
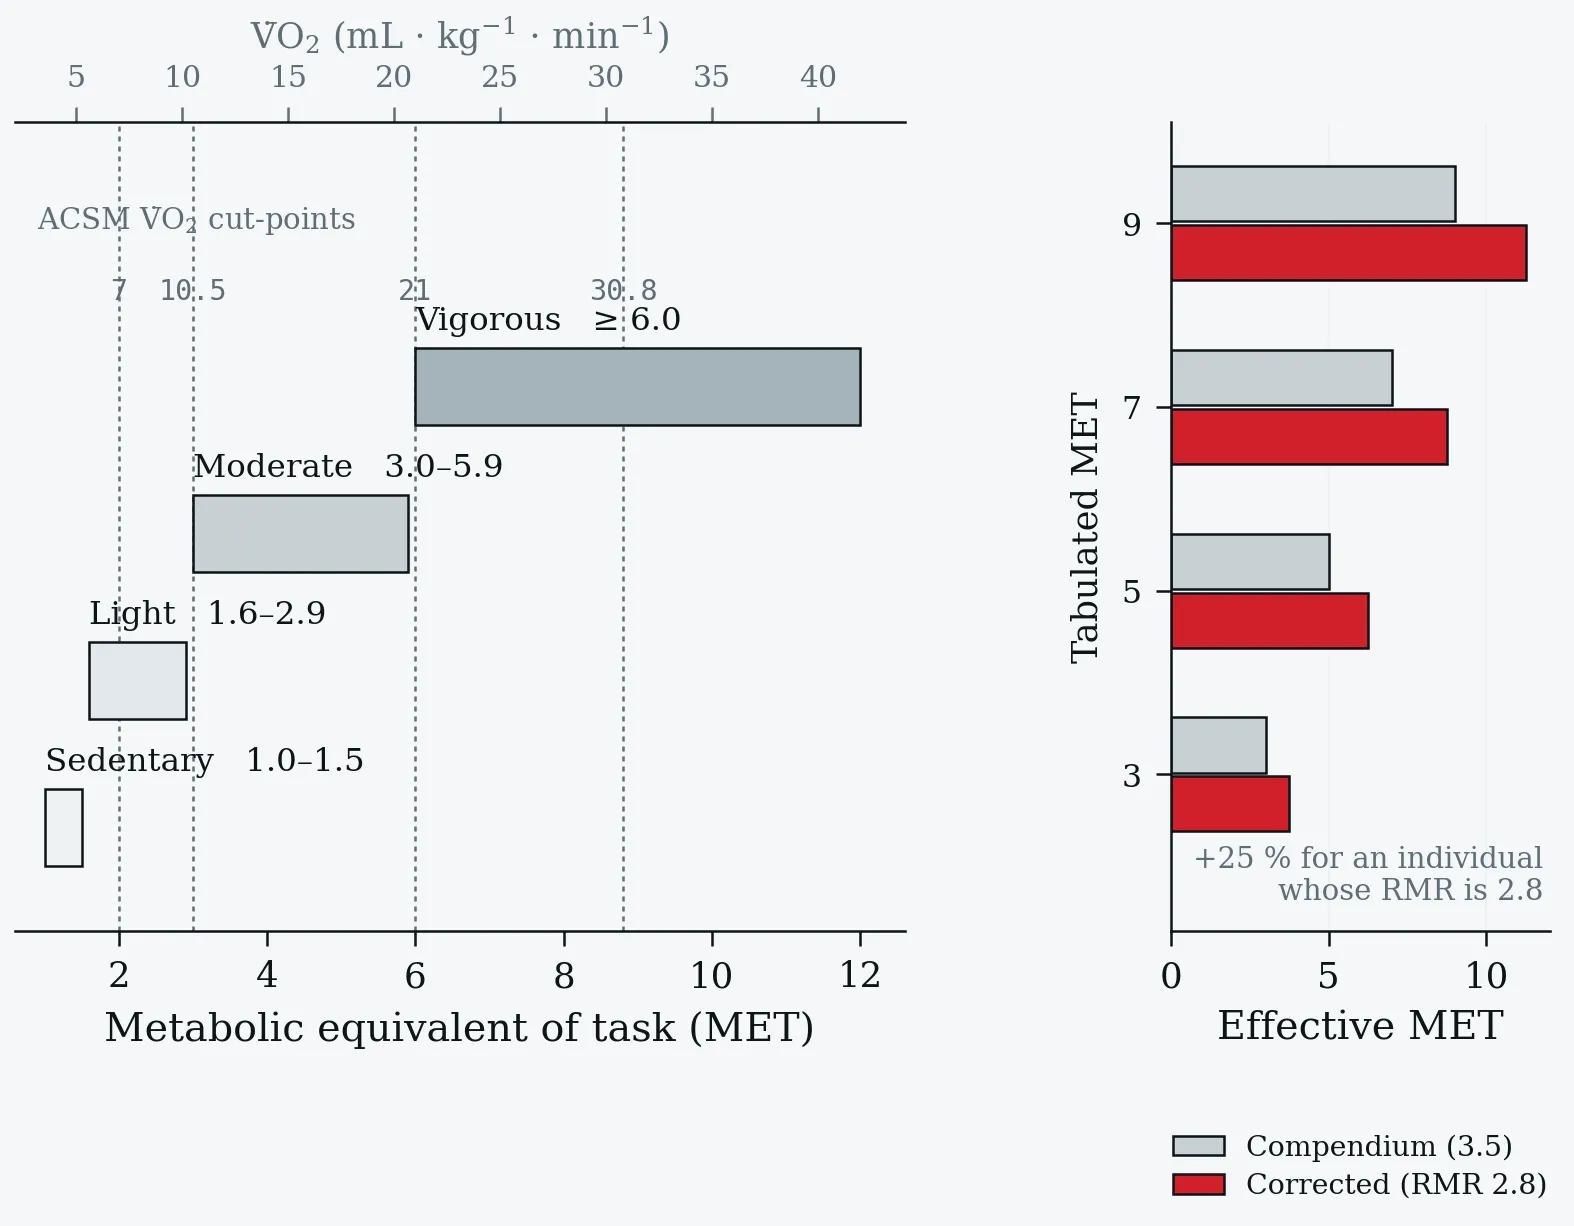
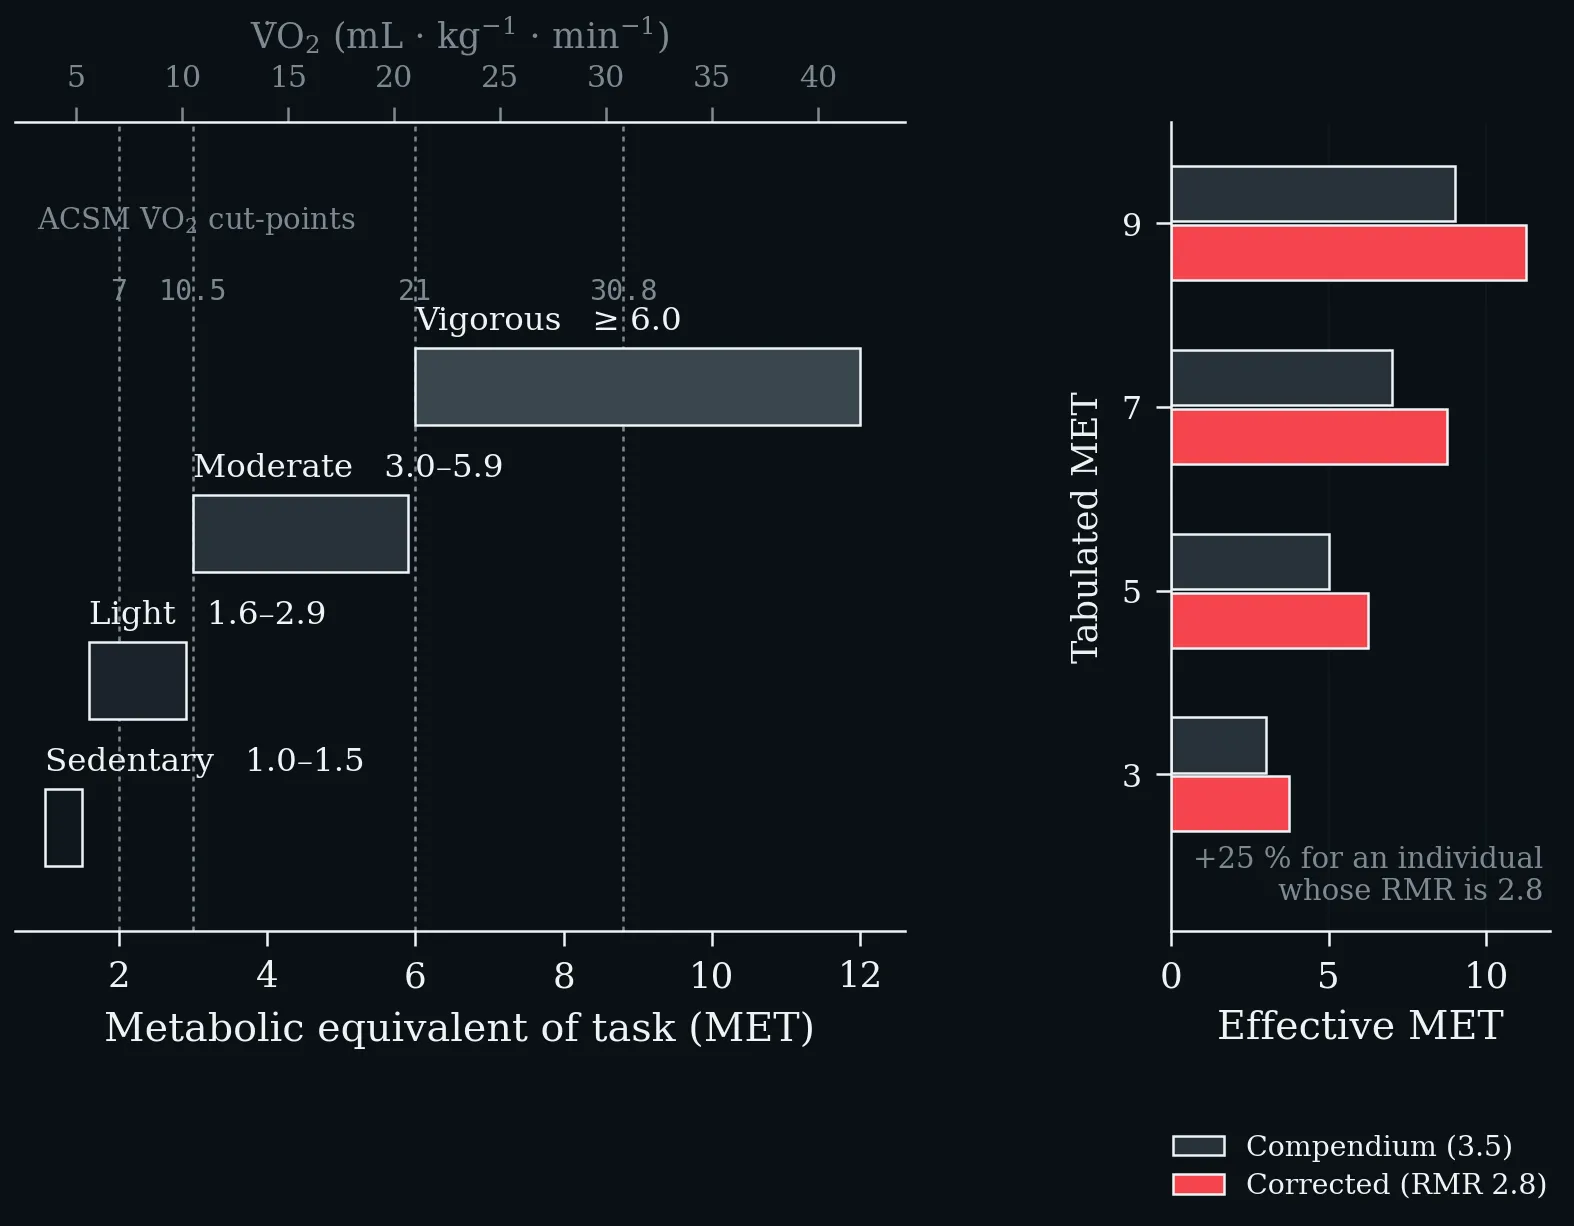
Left: physical activity classification by MET range, after the Compendium of Physical Activities (Ainsworth et al. 2011), with the corresponding ACSM V̇O₂ cut-points on the upper axis. Right: the same activities recalculated for an individual whose resting metabolic rate is 2.8 instead of the conventional 3.5 mL·kg⁻¹·min⁻¹ — every tabulated MET value rises by 25 %.
The same two thresholds read from two different signals on one work-rate axis. Top: blood lactate first rises above baseline at T1 and reaches the maximal lactate steady state at T2. Bottom: V̇E/V̇O₂ turns upward at the first ventilatory (gas-exchange) threshold and V̇E/V̇CO₂ follows at the respiratory compensation point. The shaded band between them is the transition zone in which metabolism is neither purely aerobic nor sustainably anaerobic (Faude et al. 2009; Meyer et al. 2005).
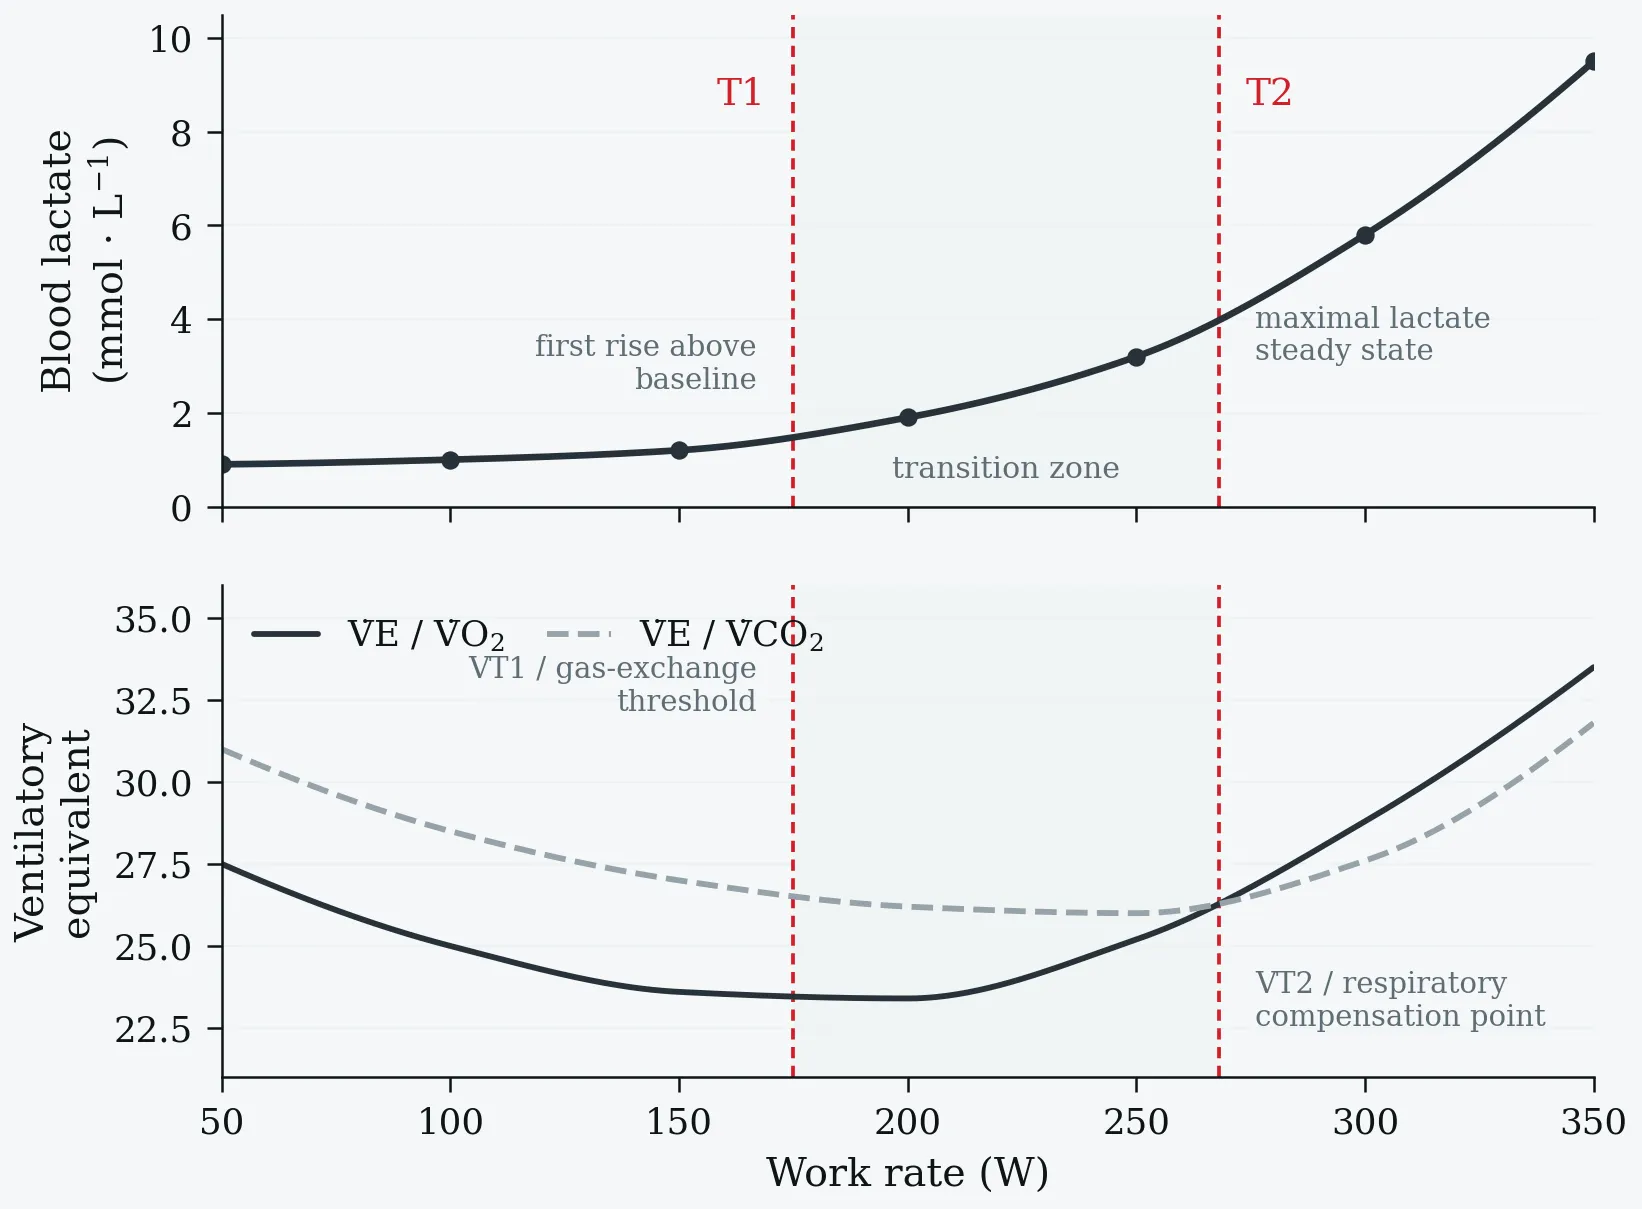
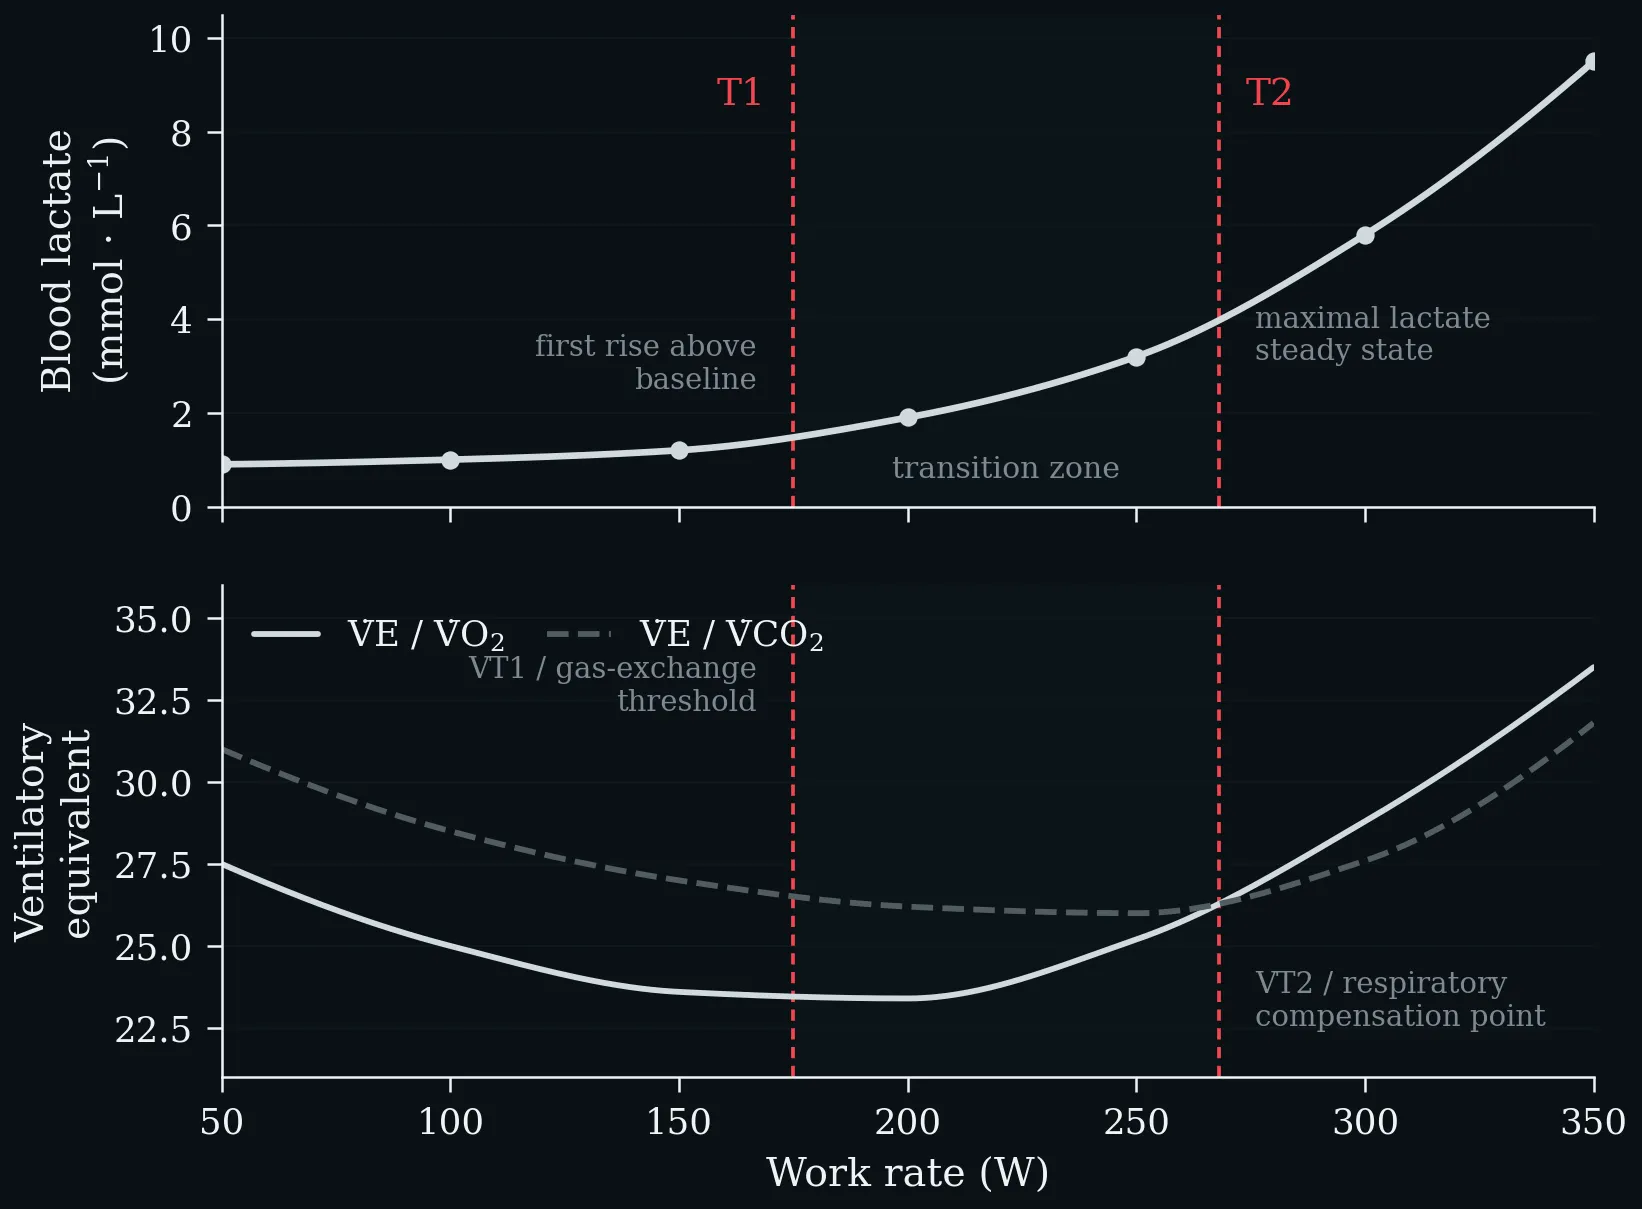
The same two thresholds read from two different signals on one work-rate axis. Top: blood lactate first rises above baseline at T1 and reaches the maximal lactate steady state at T2. Bottom: V̇E/V̇O₂ turns upward at the first ventilatory (gas-exchange) threshold and V̇E/V̇CO₂ follows at the respiratory compensation point. The shaded band between them is the transition zone in which metabolism is neither purely aerobic nor sustainably anaerobic (Faude et al. 2009; Meyer et al. 2005).
Lecture 5: Lactate – From Metabolic Waste Product to Central Metabolite
Both bars sit above the line at which the two fluxes would be equal — lactate, not glucose, is the primary circulating carbohydrate fuel. Feeding brings the two close together; fasting pulls them apart, and lactate then turns over two and a half times as fast as glucose. After Hui et al., Nature 551: 115–118 (2017).
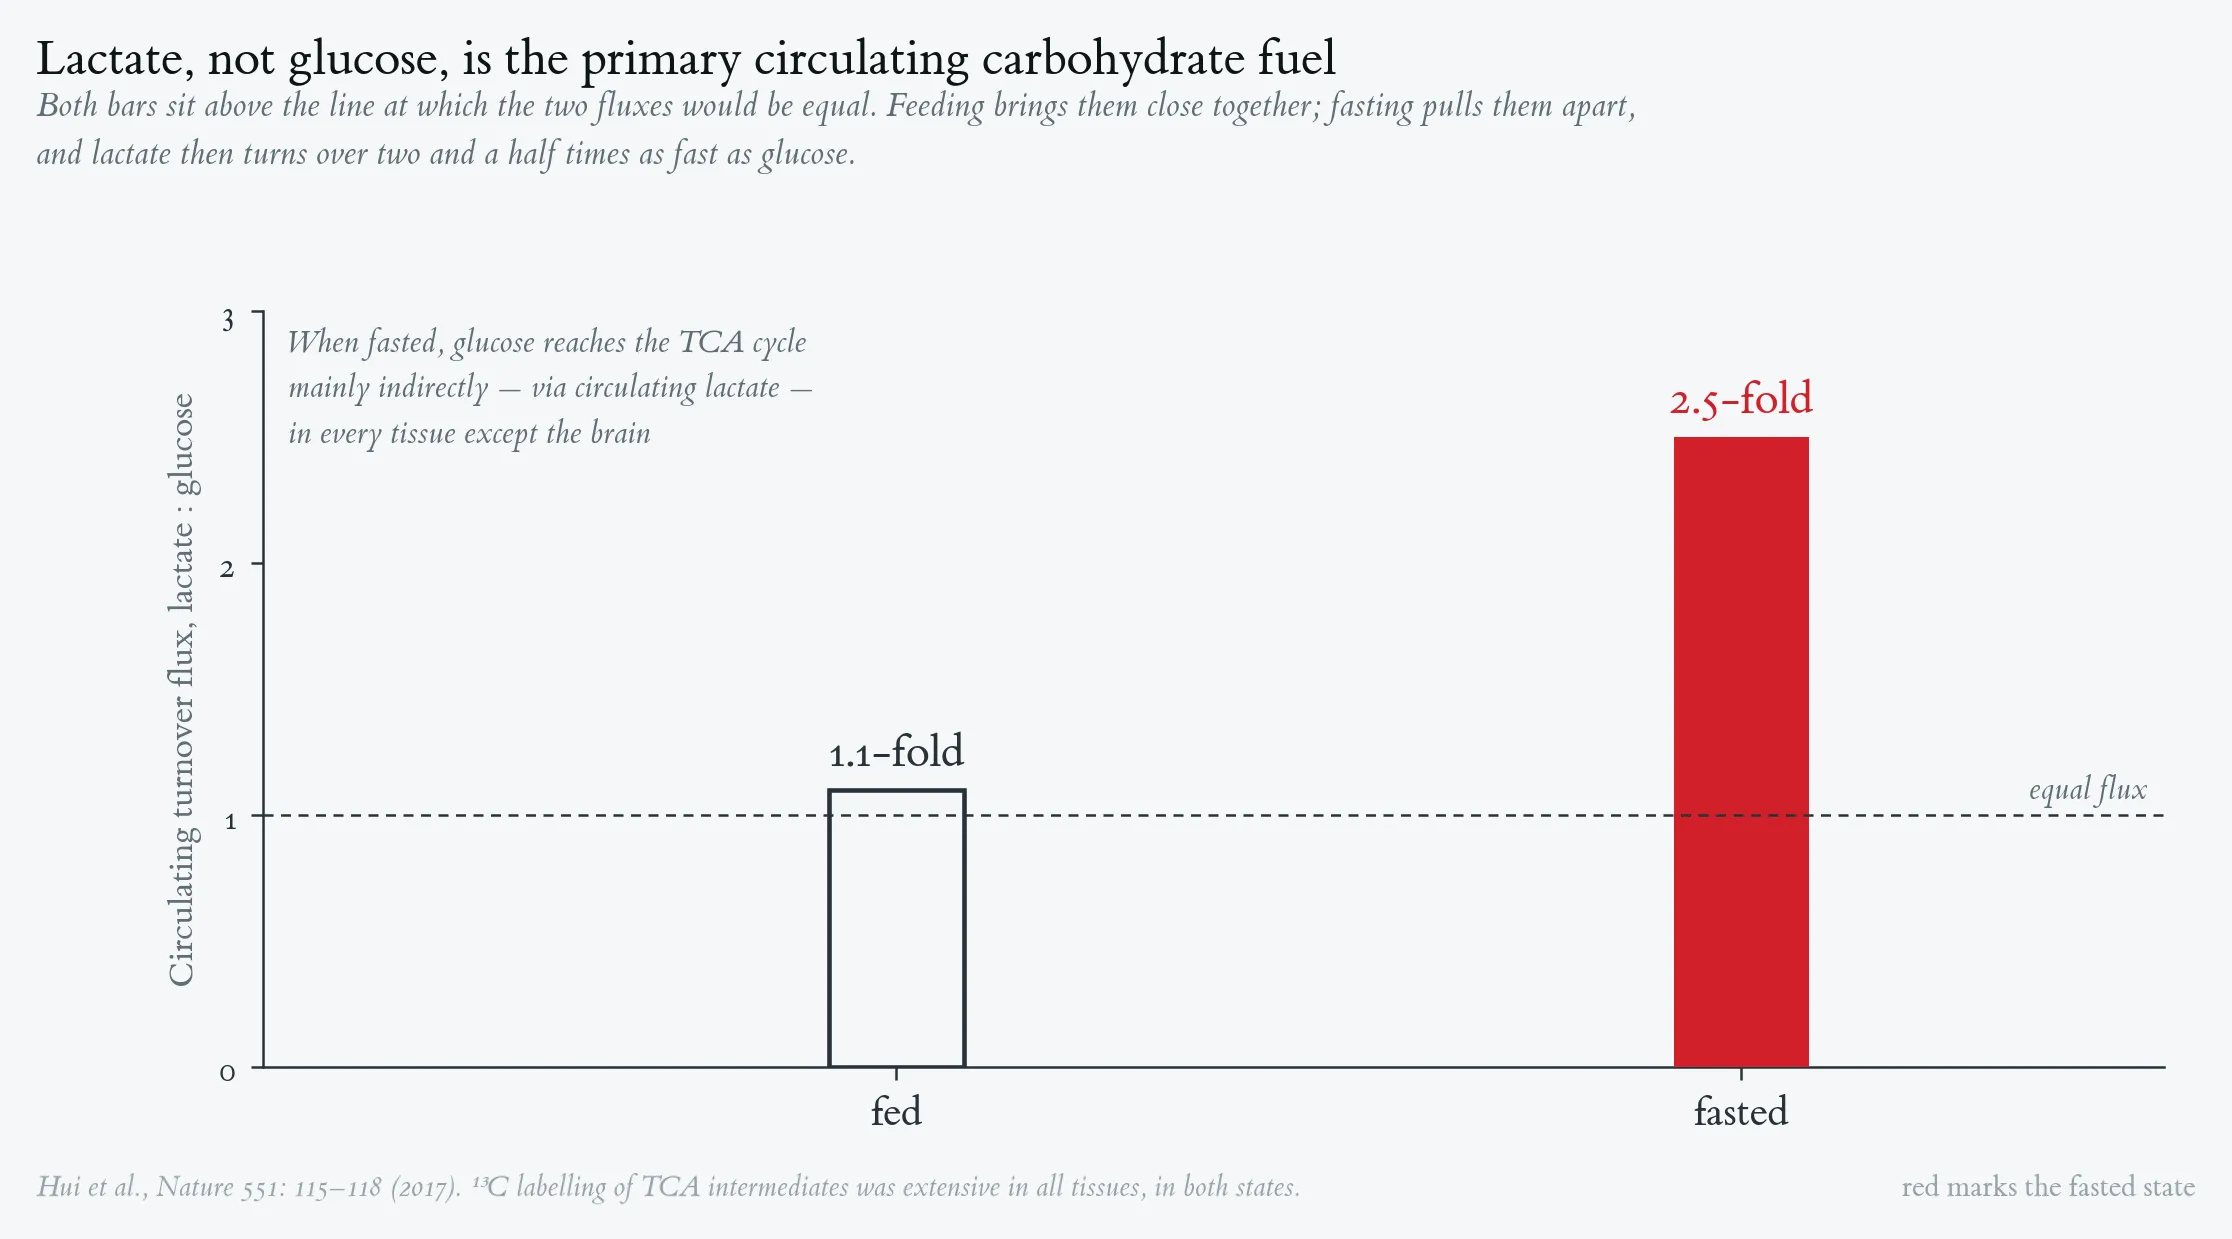
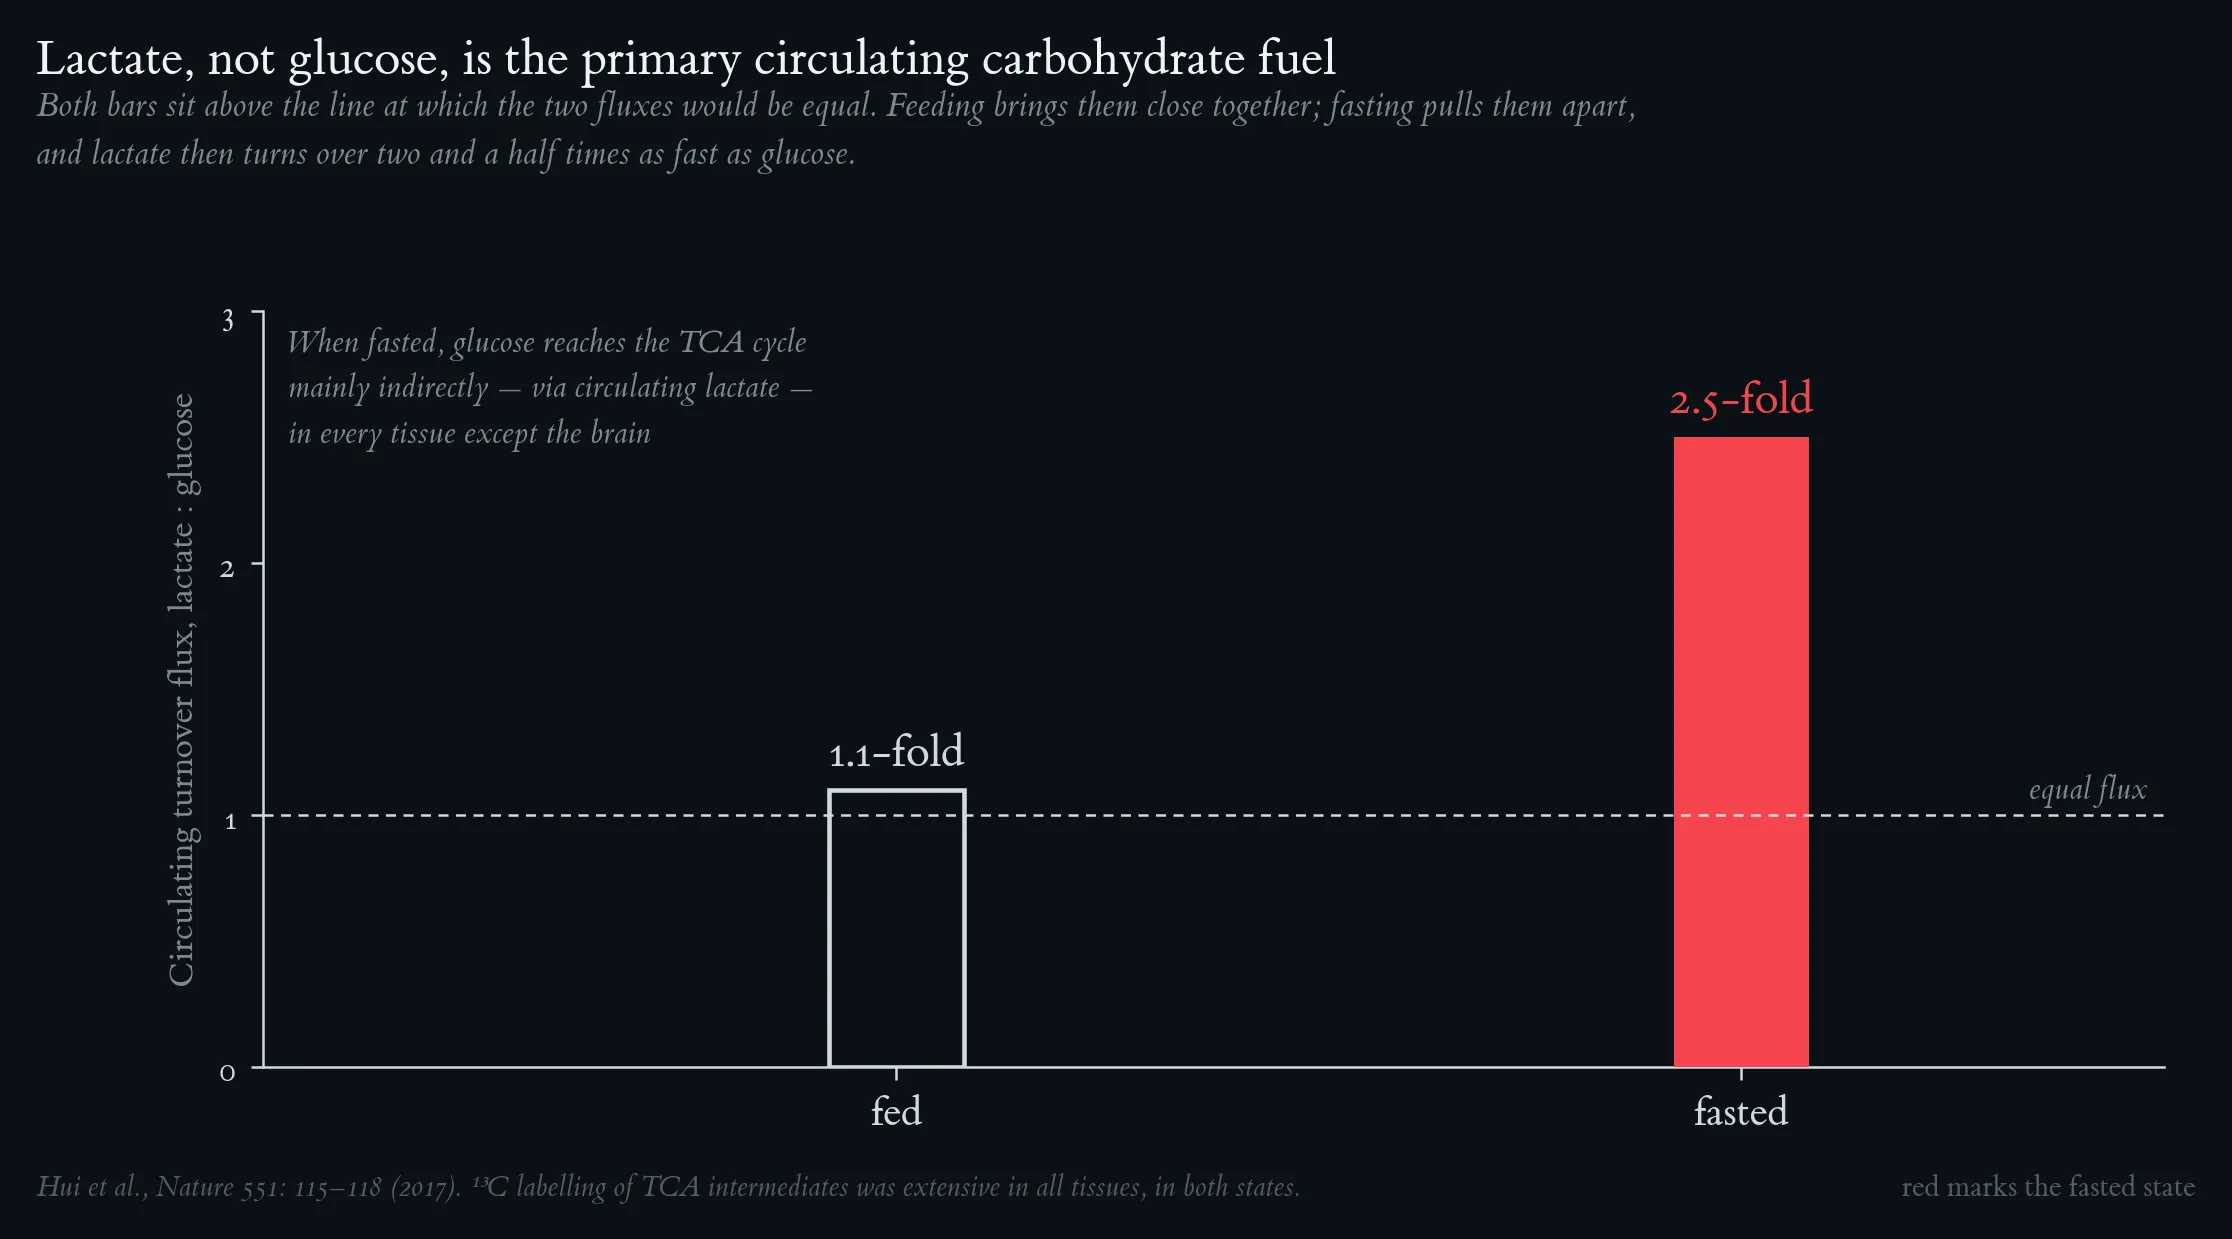
Both bars sit above the line at which the two fluxes would be equal — lactate, not glucose, is the primary circulating carbohydrate fuel. Feeding brings the two close together; fasting pulls them apart, and lactate then turns over two and a half times as fast as glucose. After Hui et al., Nature 551: 115–118 (2017).
The enteric rise from intestinal metabolism of the ingested carbohydrate appears while blood glucose is still at its fasting value; the larger systemic rise follows, synchronous with the glucose peak, and accounts for roughly 38 % of the 75 g load. Glycolysis is not the emergency route — it is the ordinary one. Schematic after Leija et al. (2024); the ordering and timing of the two rises are the finding.
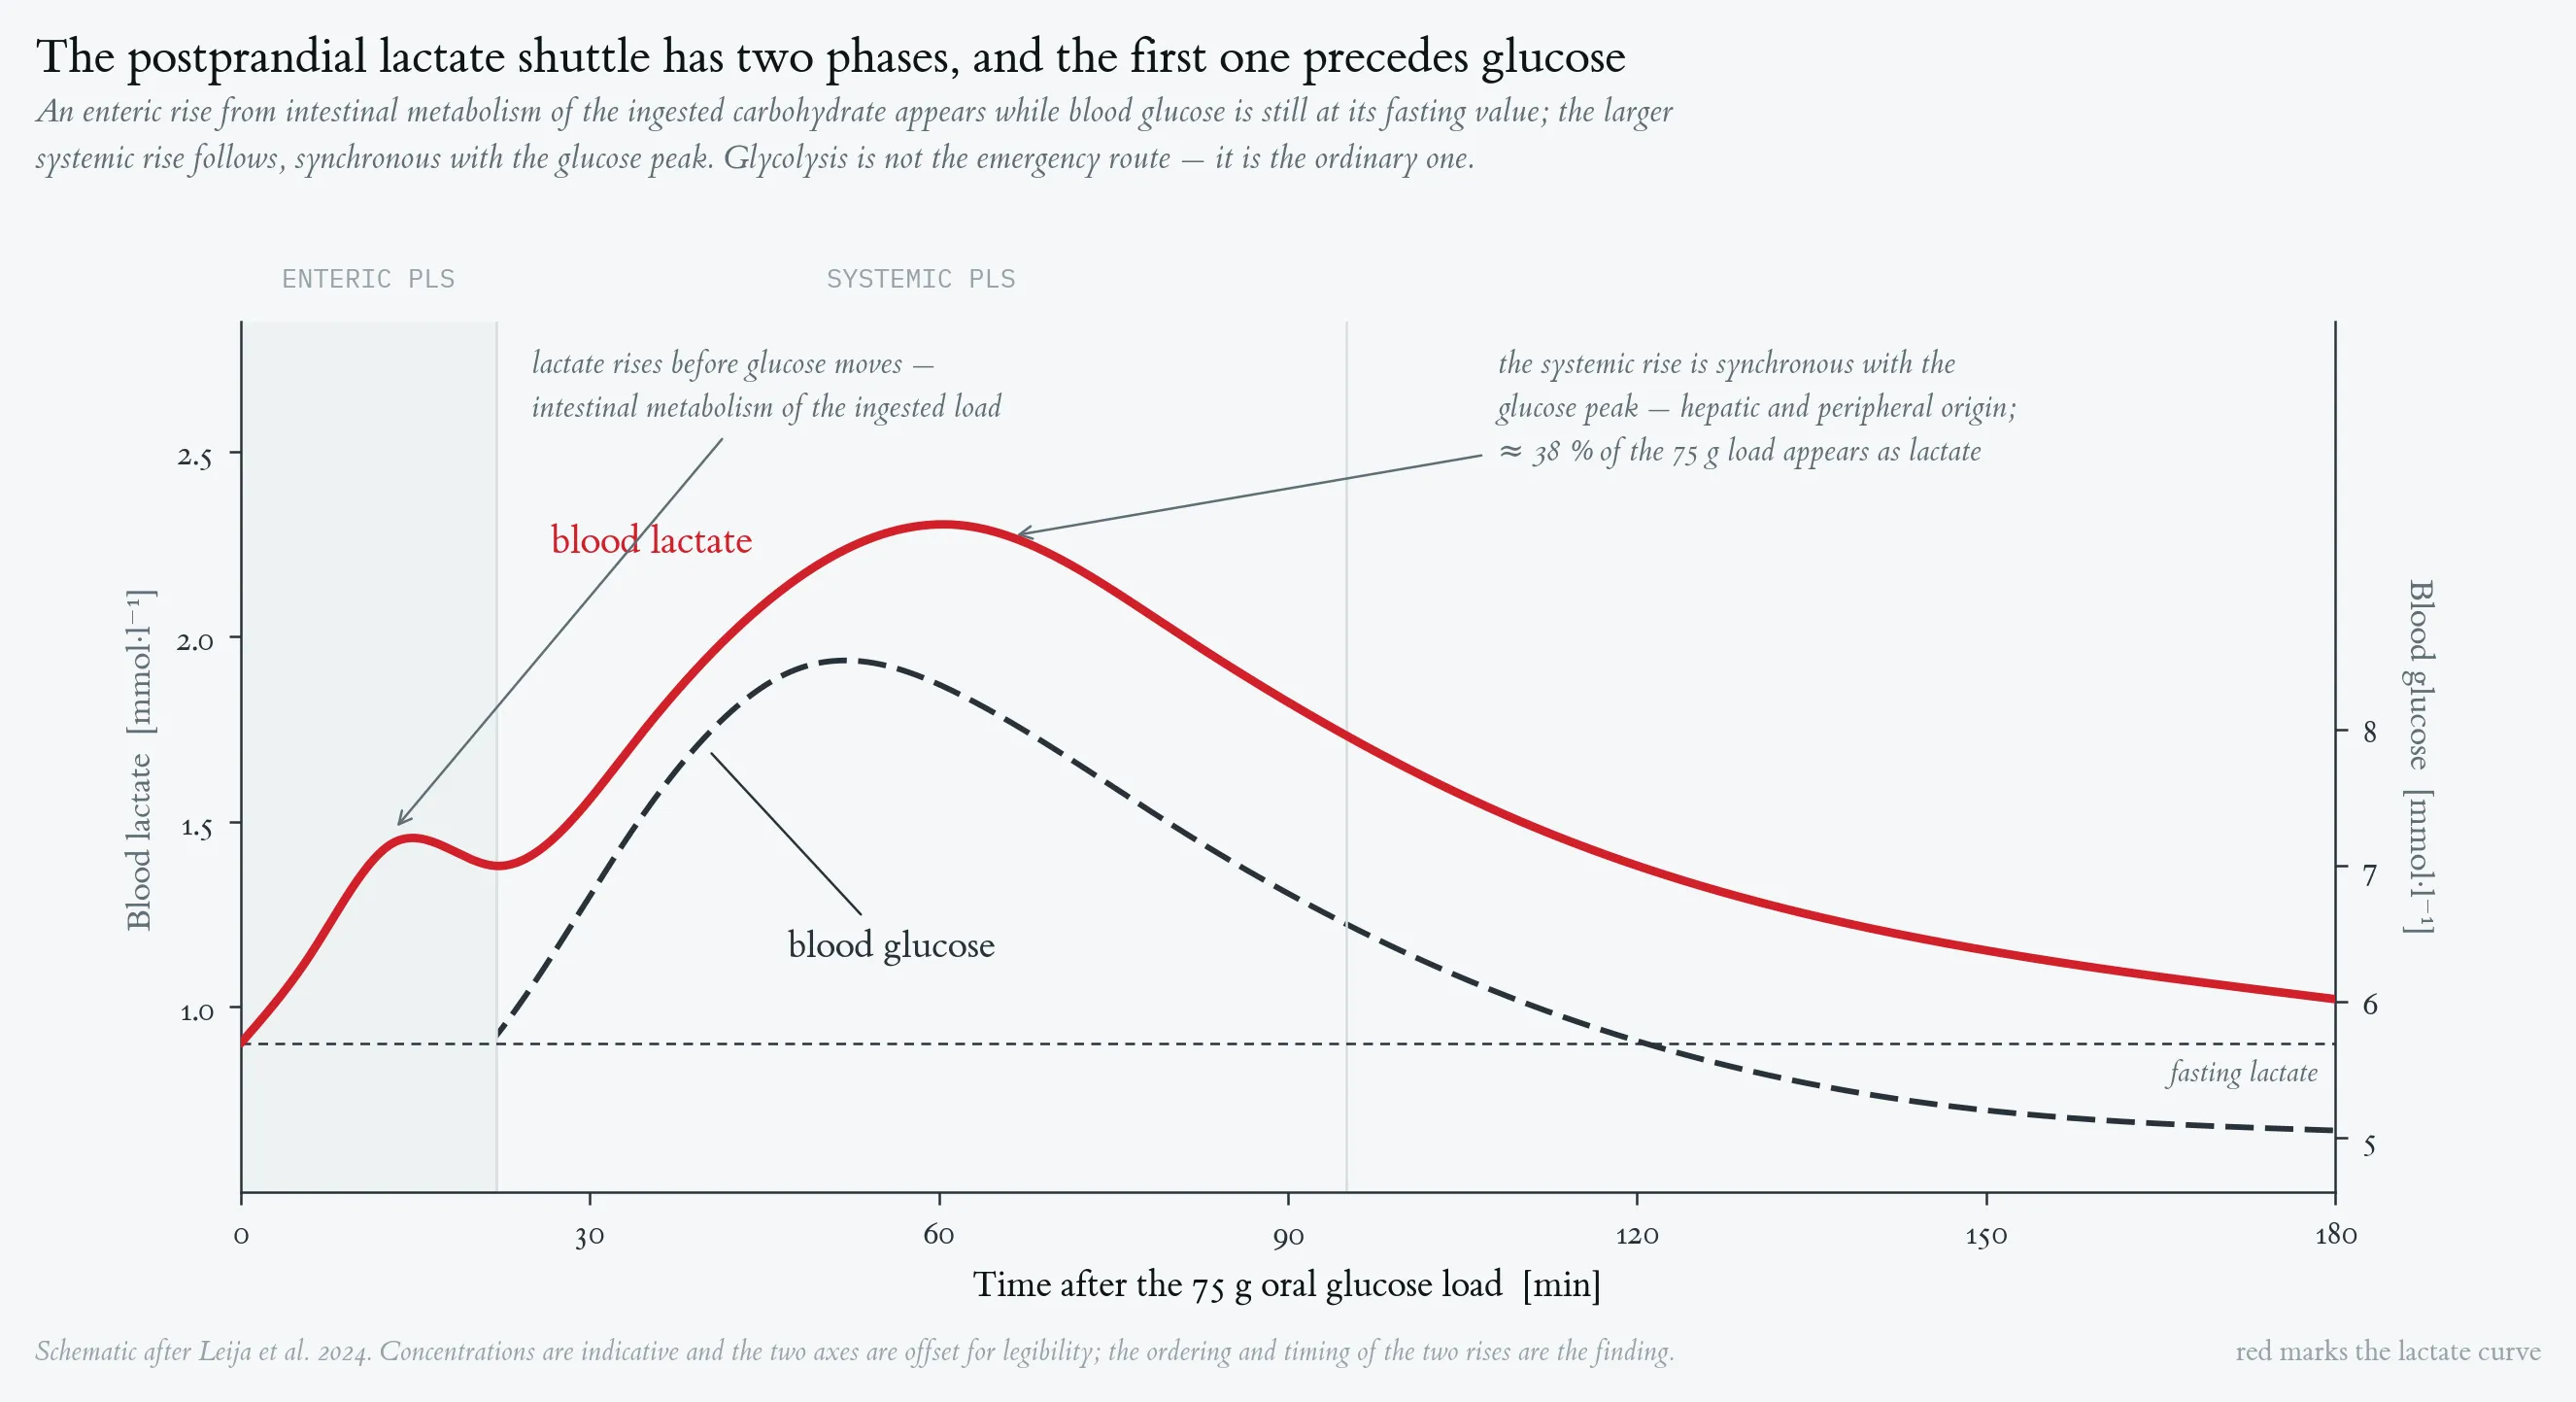
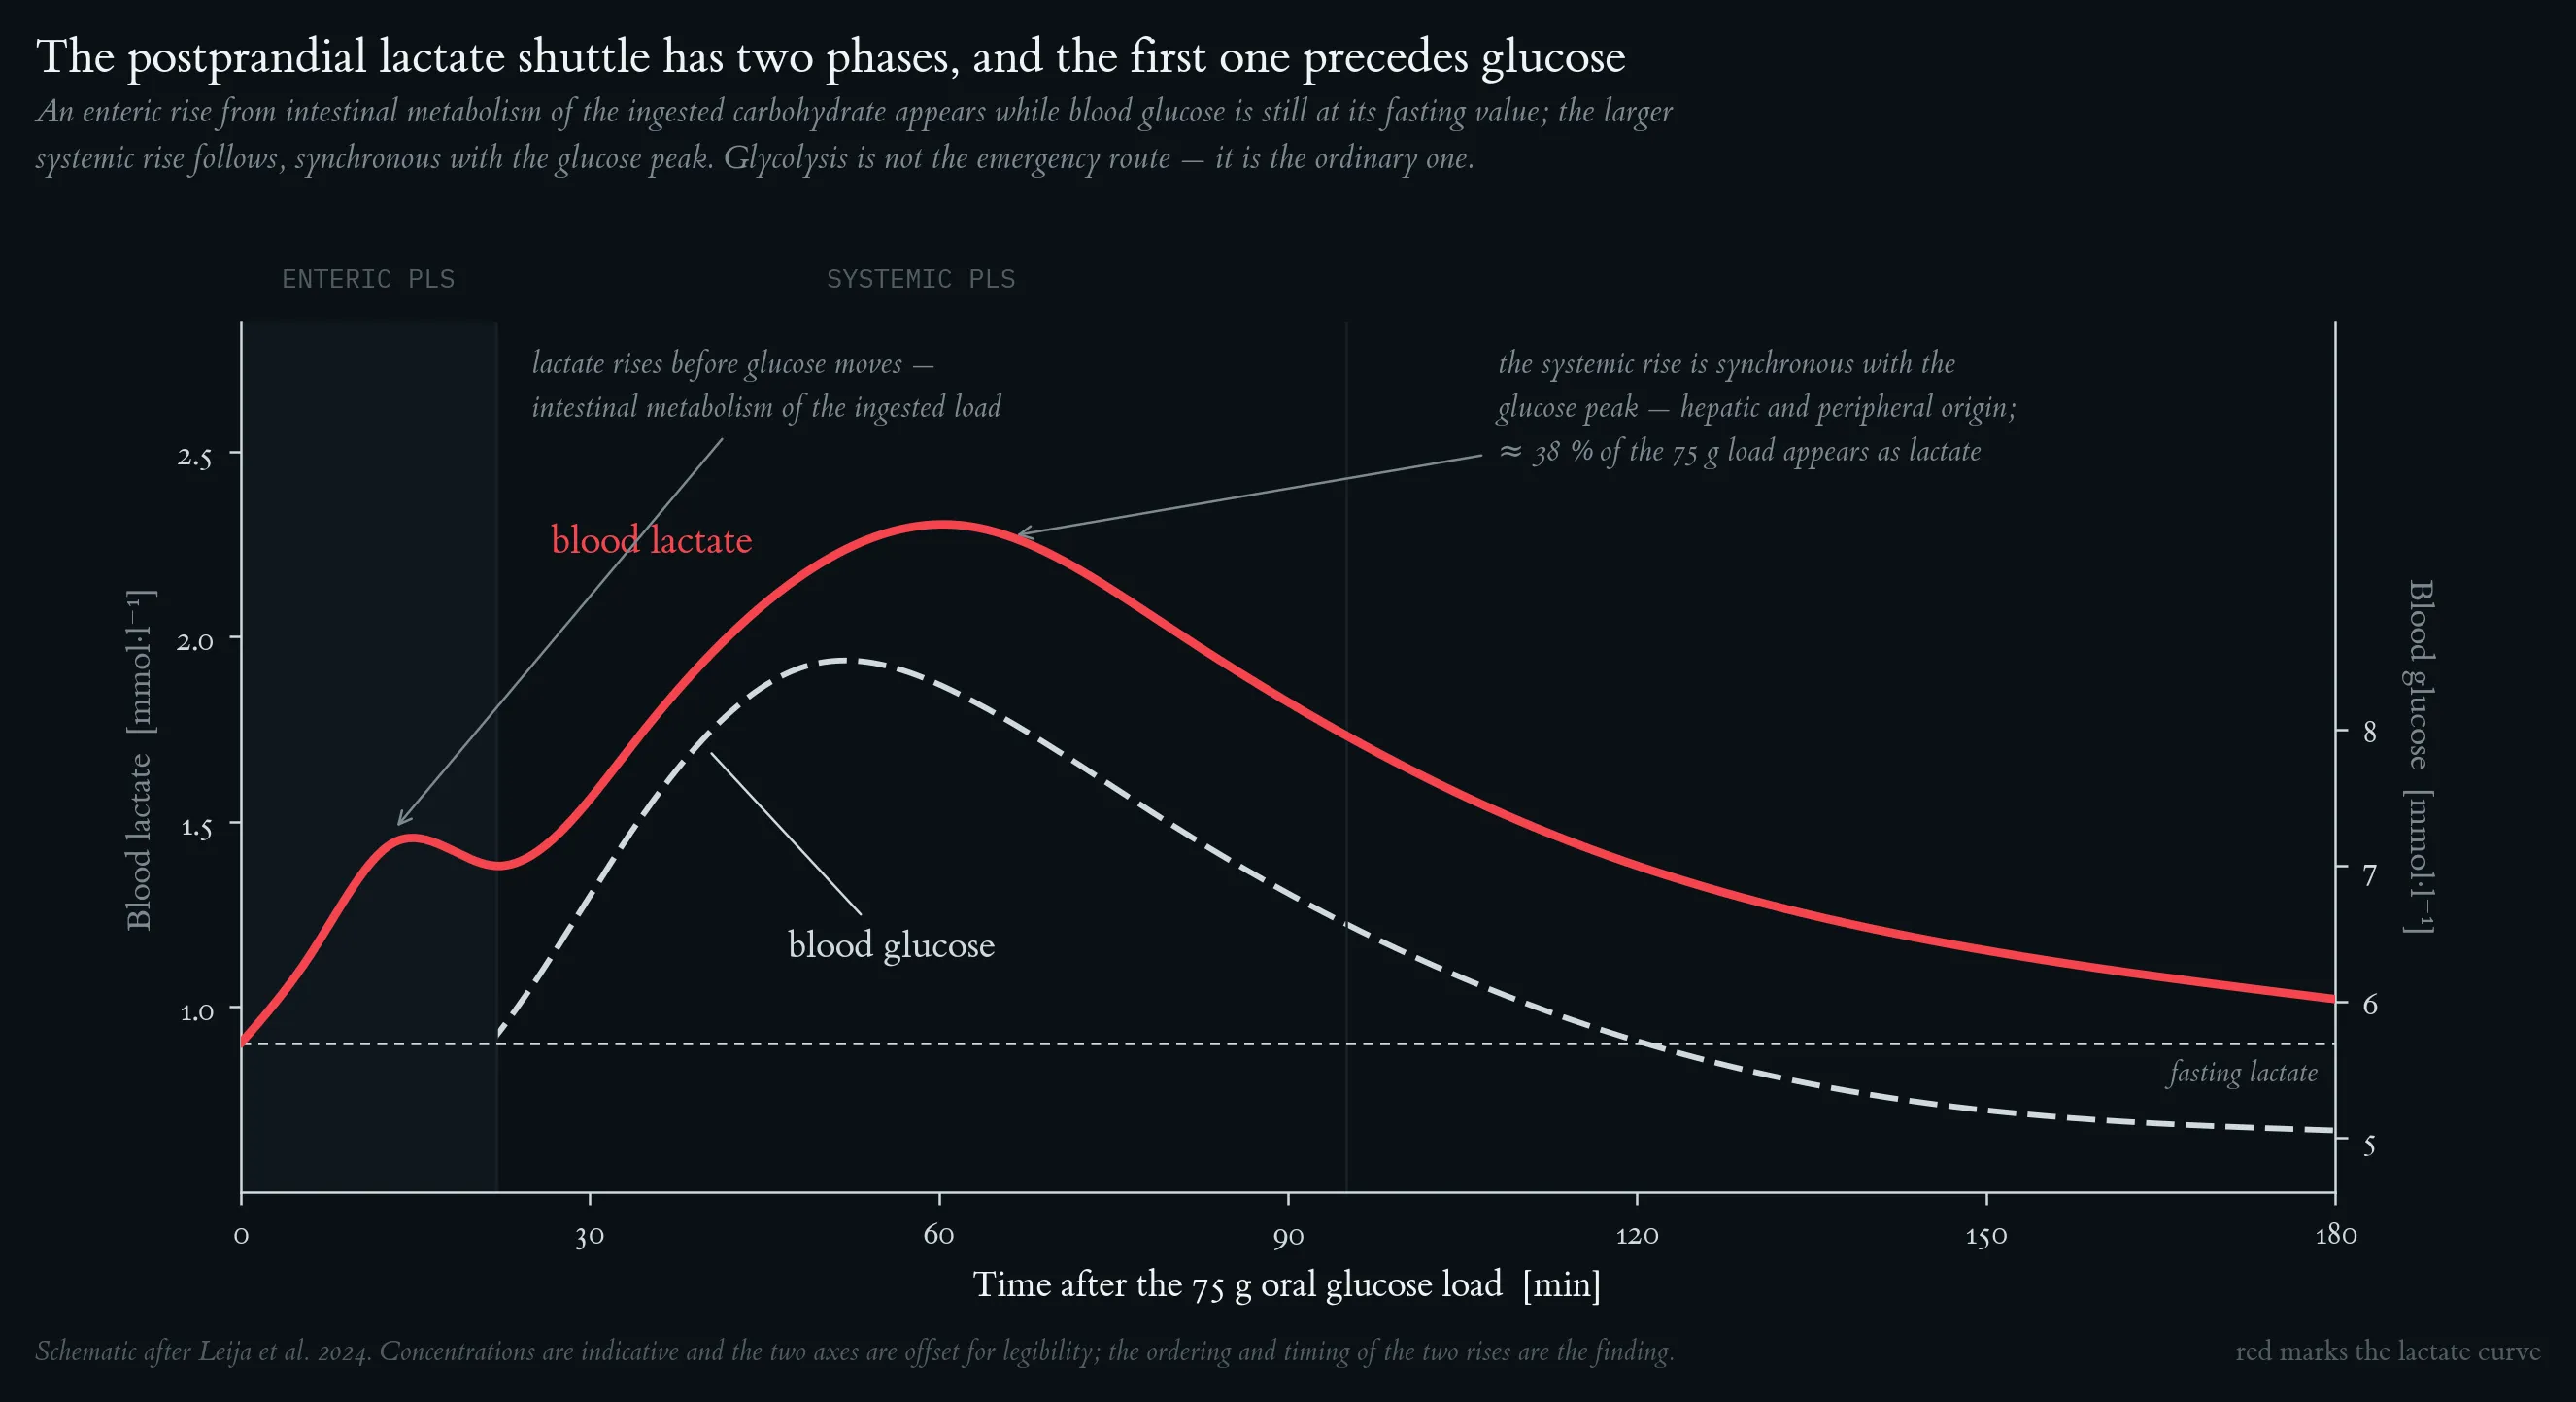
The enteric rise from intestinal metabolism of the ingested carbohydrate appears while blood glucose is still at its fasting value; the larger systemic rise follows, synchronous with the glucose peak, and accounts for roughly 38 % of the 75 g load. Glycolysis is not the emergency route — it is the ordinary one. Schematic after Leija et al. (2024); the ordering and timing of the two rises are the finding.
Lecture 6: Cardiorespiratory Fitness measured in metabolic equivalent task
Cardiorespiratory fitness and mortality risk. Each 1-MET increment in exercise capacity is associated with a 14–15 % reduction in all-cause mortality, plotted here relative to the 7.9-MET reference. Shaded band = 95 % CI. Meta-analysis of 33 studies (n = 102,980; Kodama et al. 2009).
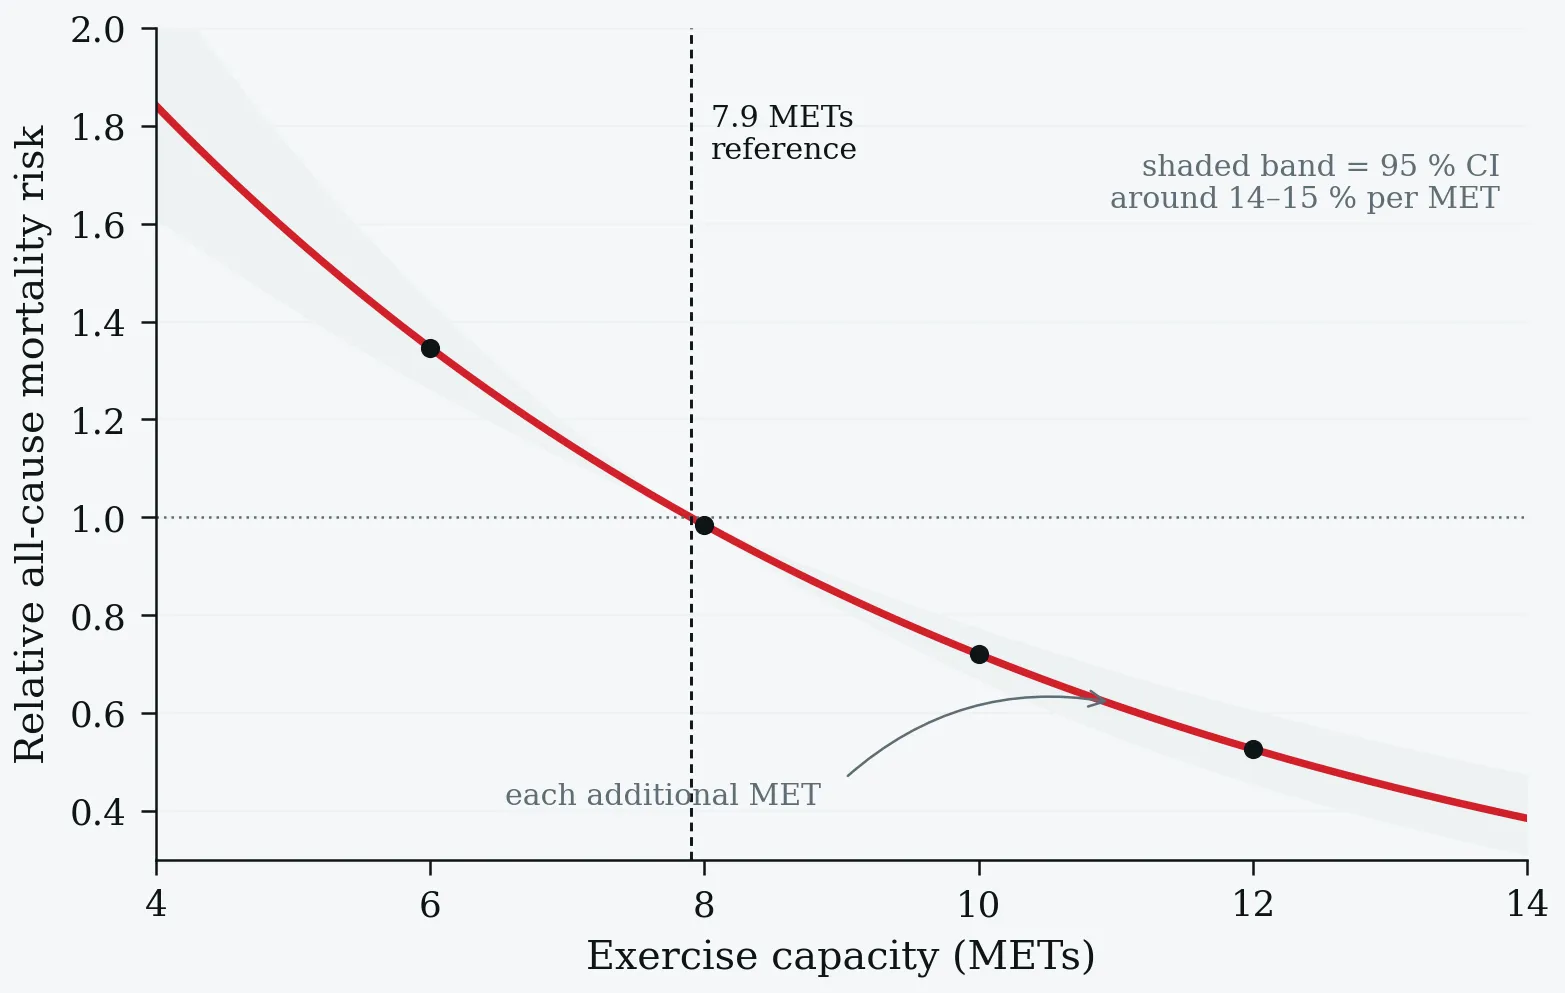
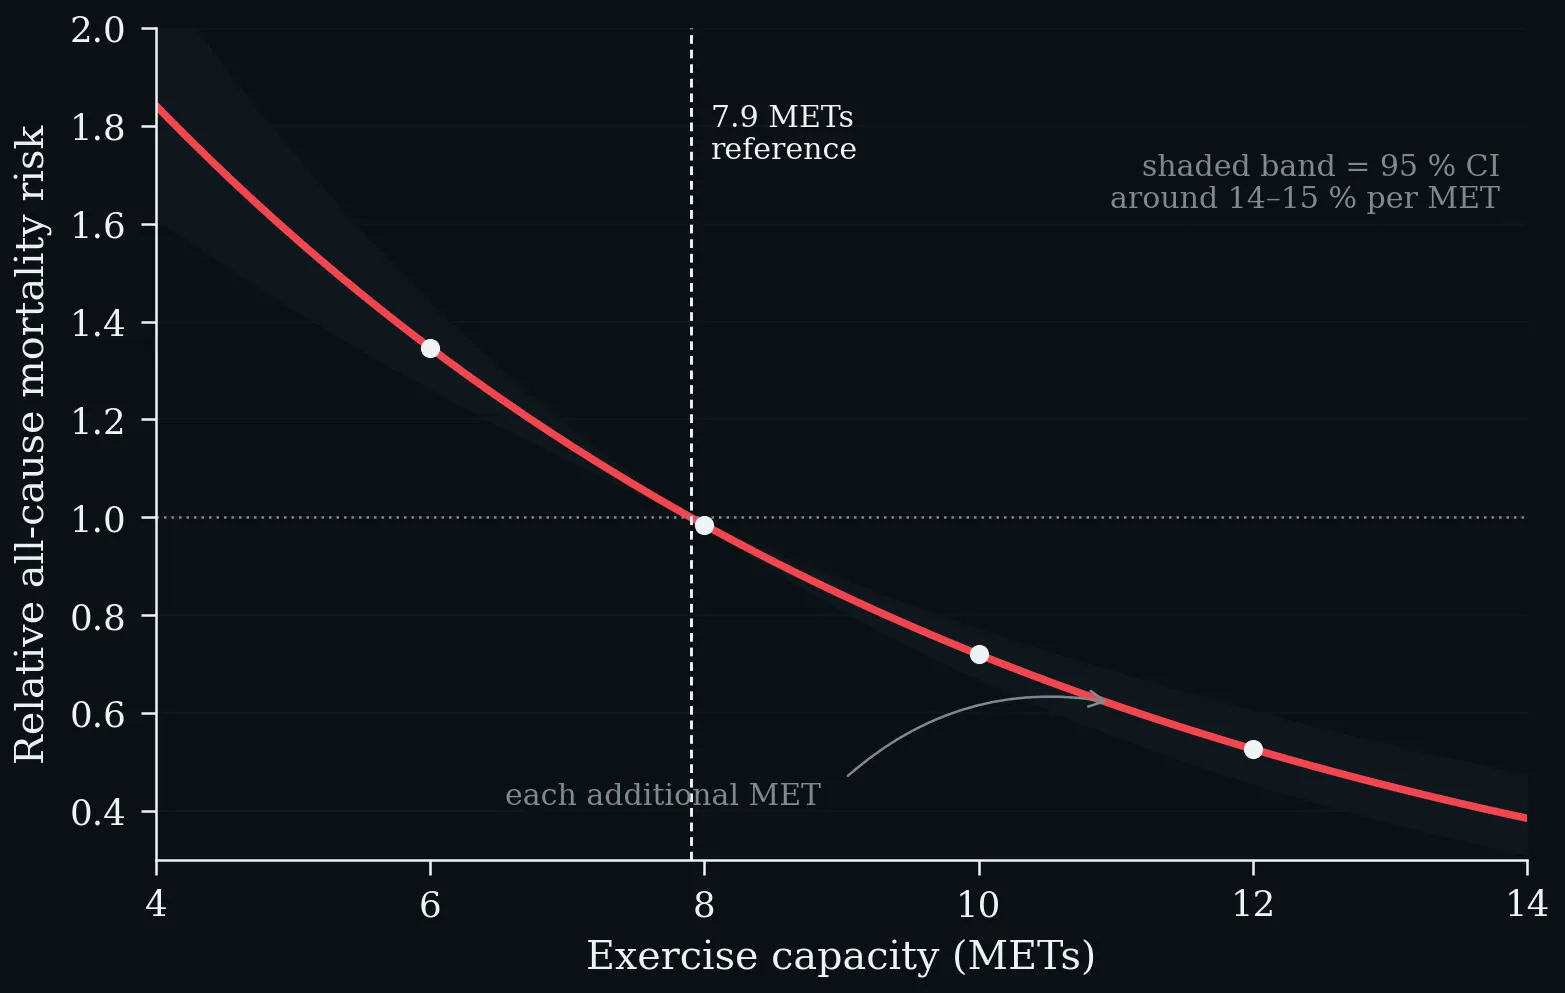
Cardiorespiratory fitness and mortality risk. Each 1-MET increment in exercise capacity is associated with a 14–15 % reduction in all-cause mortality, plotted here relative to the 7.9-MET reference. Shaded band = 95 % CI. Meta-analysis of 33 studies (n = 102,980; Kodama et al. 2009).
All-cause mortality hazard ratios by fitness category on a common logarithmic axis. Left: Cleveland Clinic cohort (n = 122,007); the above-average vs. below-average hazard ratio of 1.41 equates to the excess mortality risk of smoking or diabetes, and the Low-to-Elite gradient exceeds 5-fold (Mandsager et al. 2018). Right: US Veterans Affairs cohort (n = 750,302; mean follow-up 10.2 years) with a ≈4-fold Very-Low to Very-High gradient and no ceiling risk at the top; error bars = 95 % CI (Kokkinos et al. 2022).
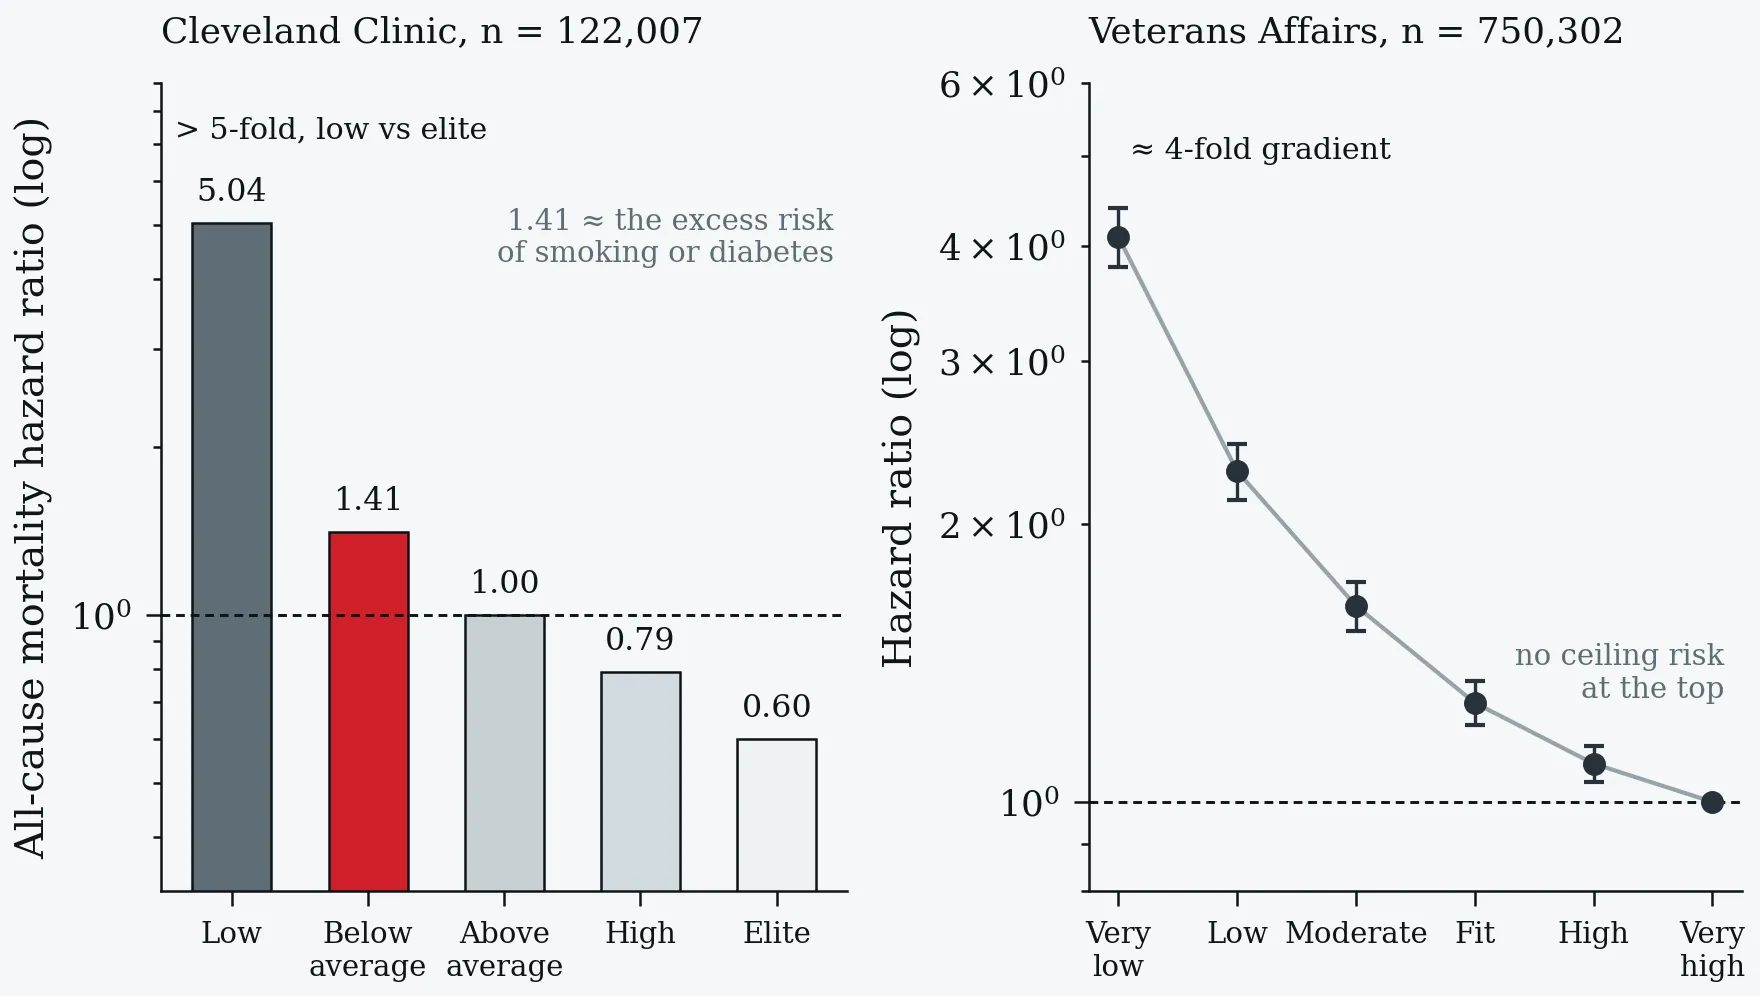
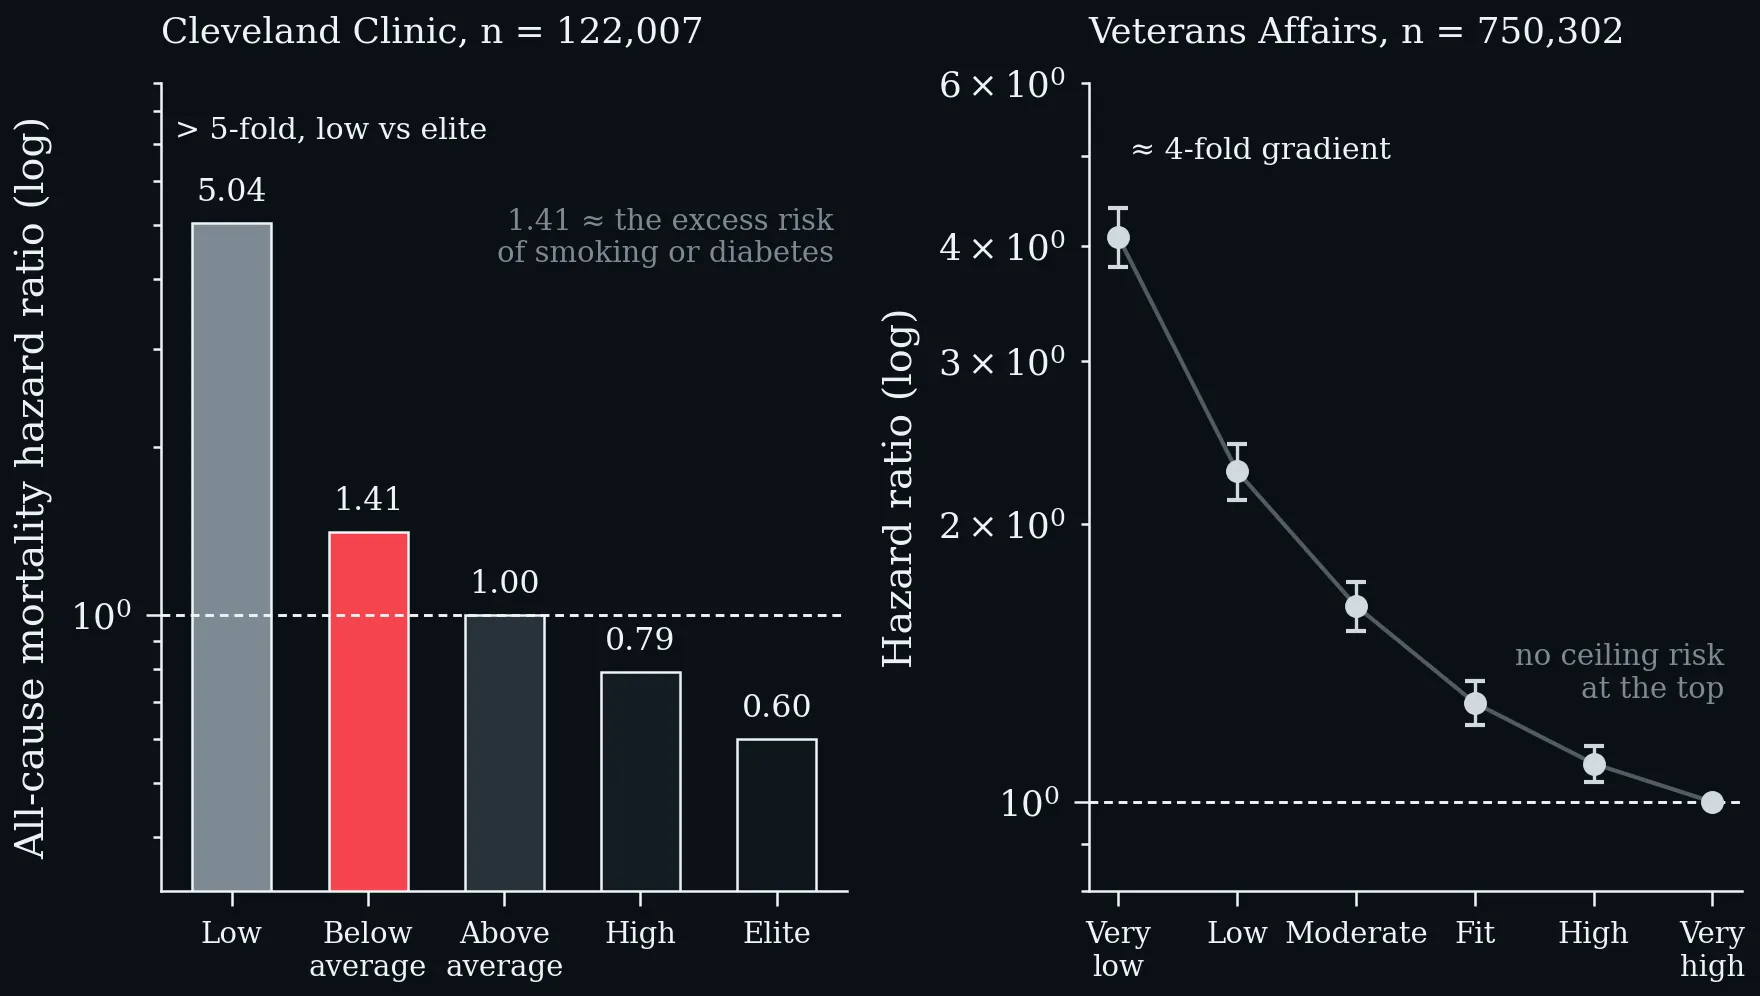
All-cause mortality hazard ratios by fitness category on a common logarithmic axis. Left: Cleveland Clinic cohort (n = 122,007); the above-average vs. below-average hazard ratio of 1.41 equates to the excess mortality risk of smoking or diabetes, and the Low-to-Elite gradient exceeds 5-fold (Mandsager et al. 2018). Right: US Veterans Affairs cohort (n = 750,302; mean follow-up 10.2 years) with a ≈4-fold Very-Low to Very-High gradient and no ceiling risk at the top; error bars = 95 % CI (Kokkinos et al. 2022).
Data imbalance between METs-based CRF and direct VO₂ max evidence. a: >99 % of outcome-linked participants contributed MET data; <1 % contributed direct VO₂ max data. b: The same imbalance as a relative participant count — 234-fold more participants in the MET arm. c: Point estimates for cardiovascular mortality reduction are remarkably similar (≈14 %), confirming construct validity — but the evidence base rests almost entirely on METs (Swain and Franklin 2024).
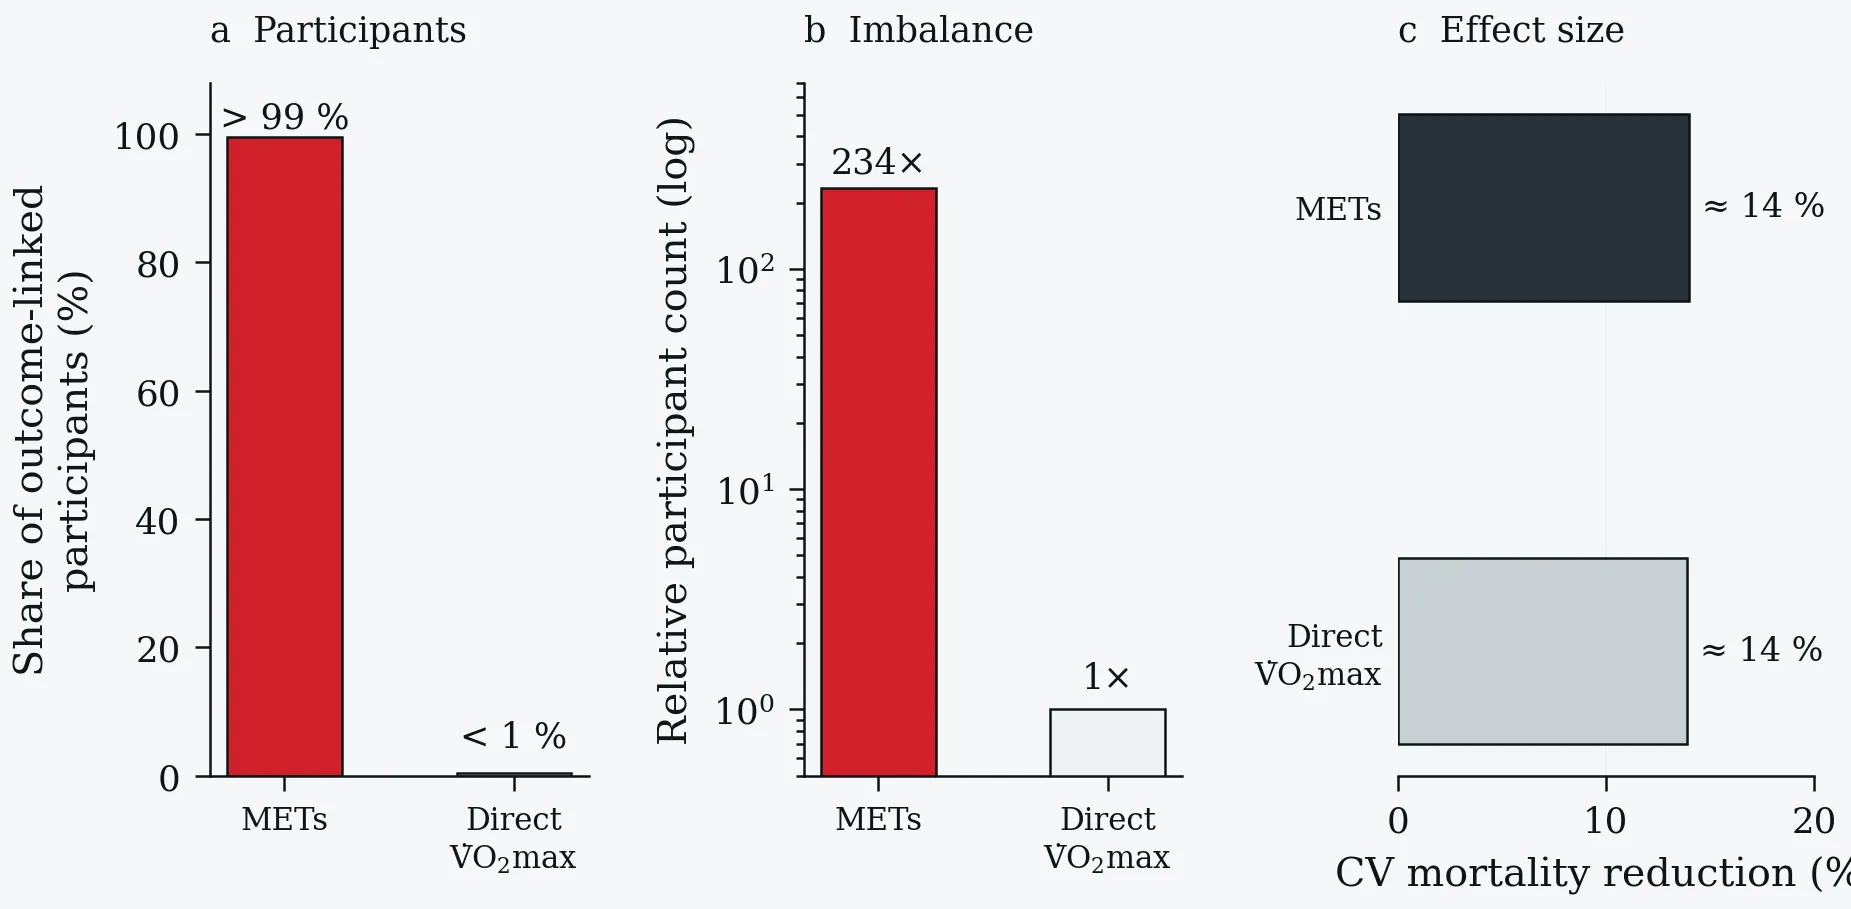
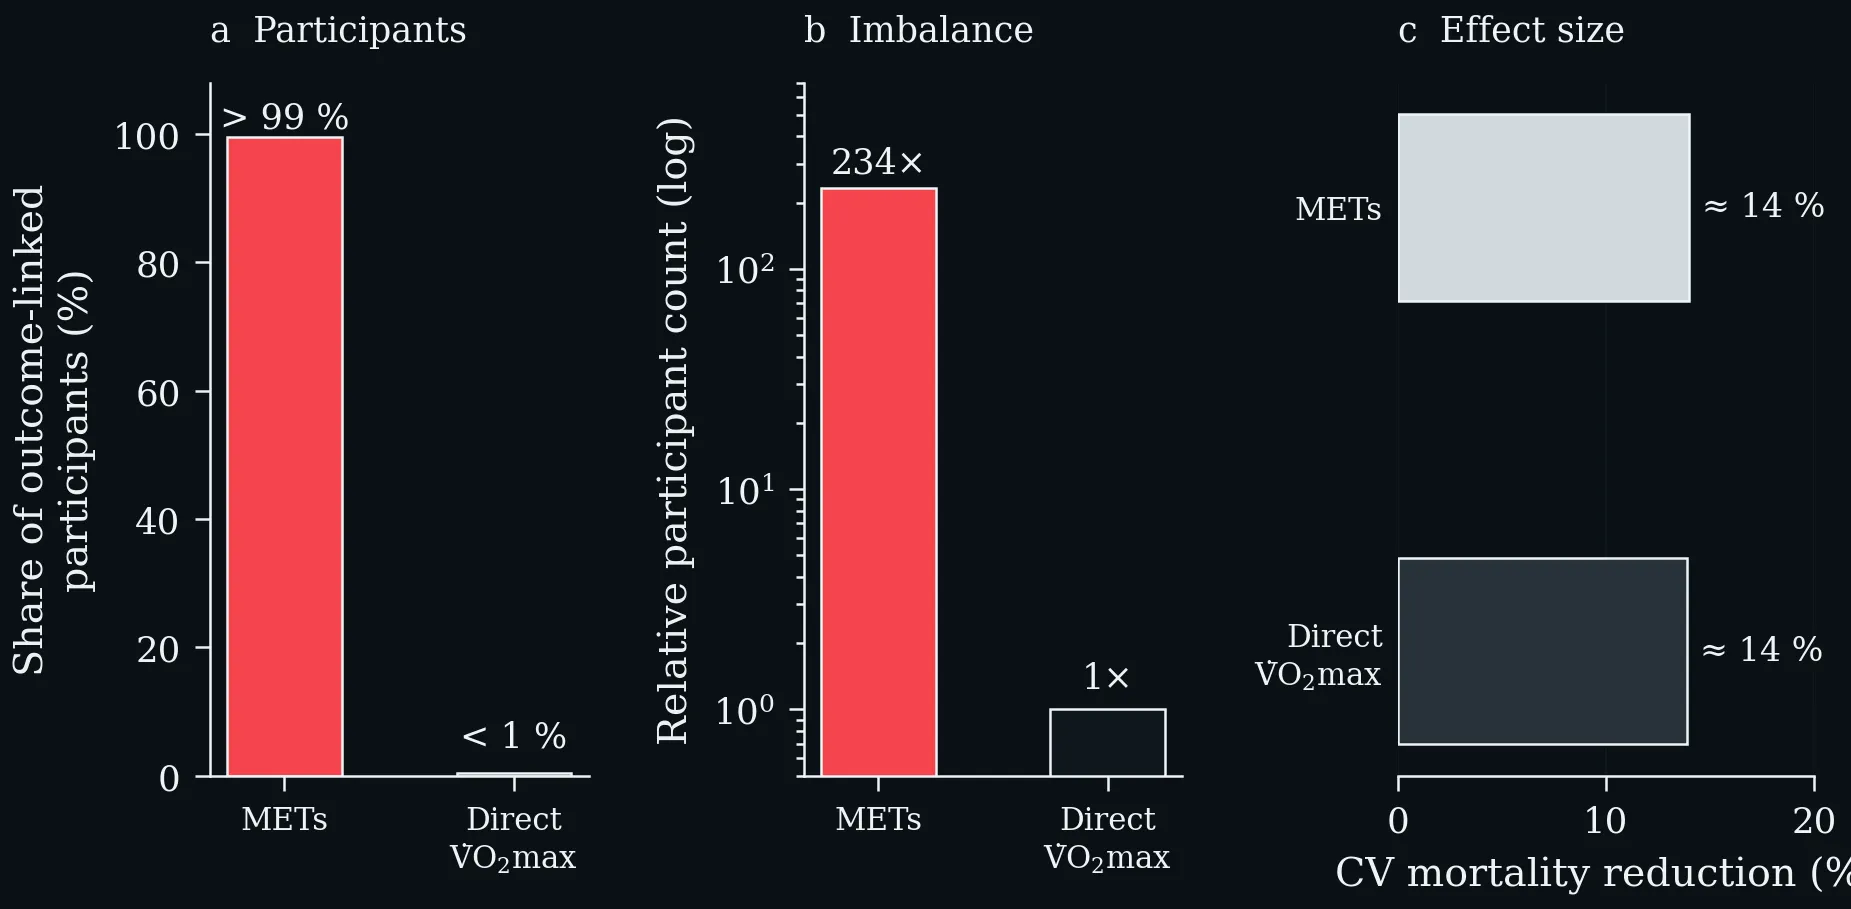
Data imbalance between METs-based CRF and direct VO₂ max evidence. a: >99 % of outcome-linked participants contributed MET data; <1 % contributed direct VO₂ max data. b: The same imbalance as a relative participant count — 234-fold more participants in the MET arm. c: Point estimates for cardiovascular mortality reduction are remarkably similar (≈14 %), confirming construct validity — but the evidence base rests almost entirely on METs (Swain and Franklin 2024).
Lecture 7: Exercise Snacks
Summary of evidence-based effects on energy metabolism, muscular adaptations, aerobic capacity and immunological signalling pathways of Exercise Snacks (created in BioRender; Puta C, 2025).
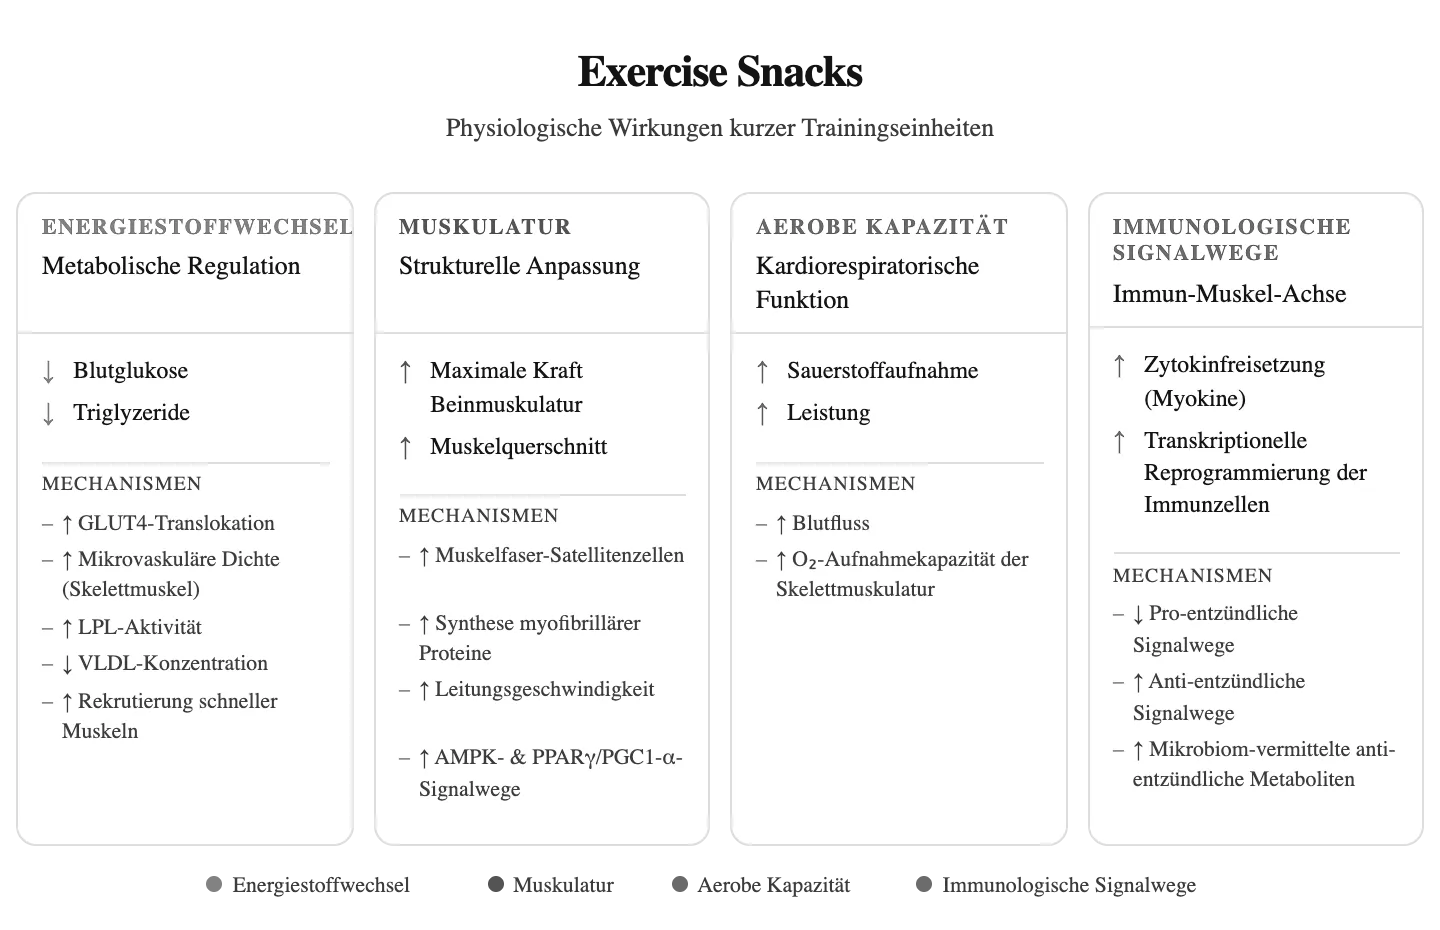
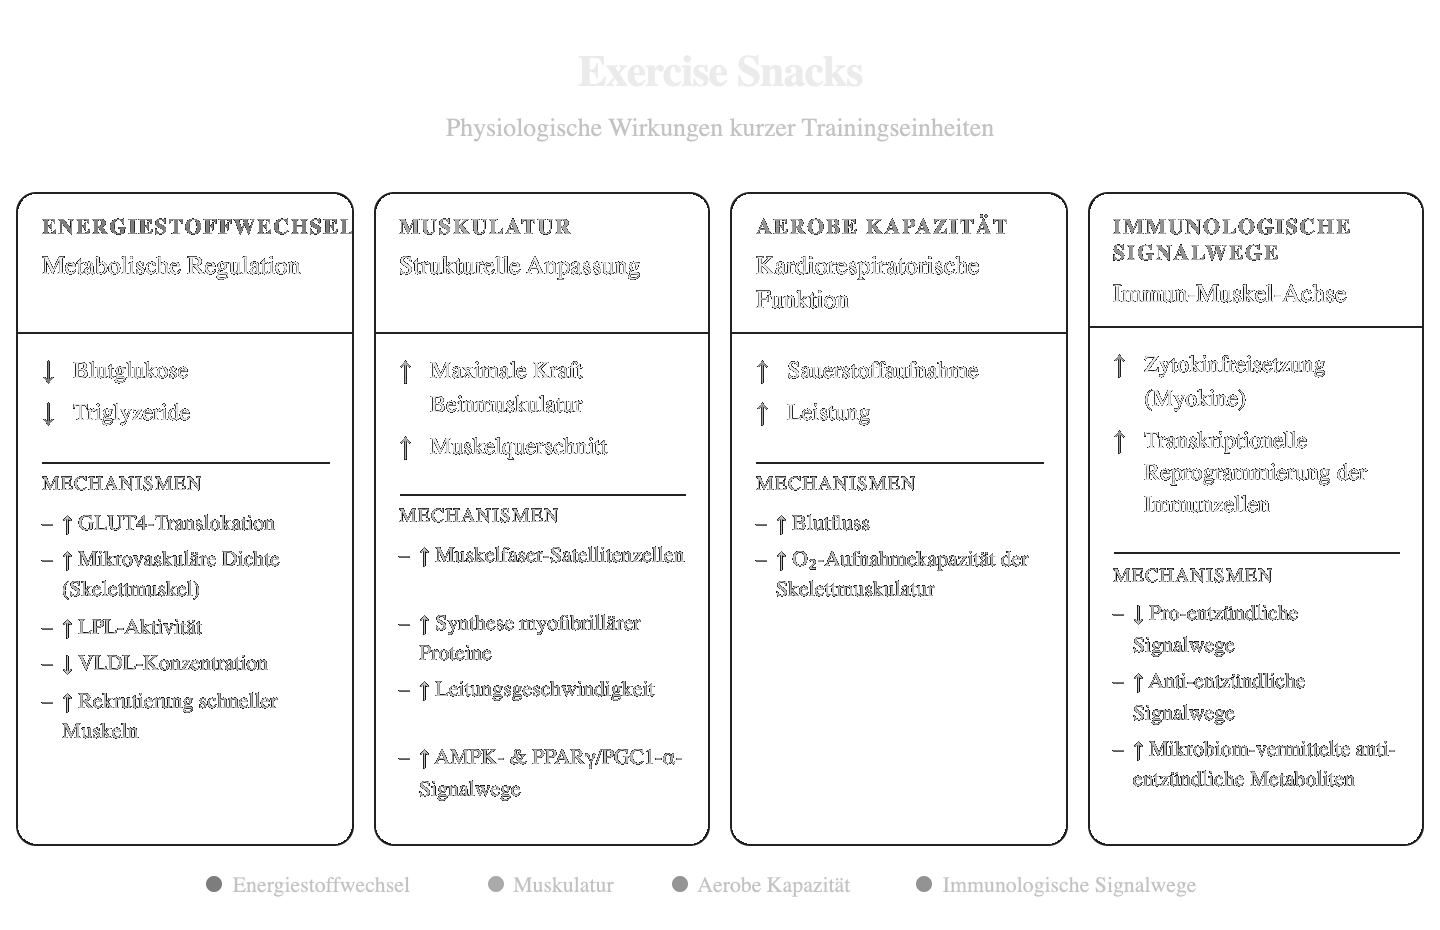
Summary of evidence-based effects on energy metabolism, muscular adaptations, aerobic capacity and immunological signalling pathways of Exercise Snacks (created in BioRender; Puta C, 2025).
Left: blood glucose after a meal preceded by six one-minute exercise snacks versus a no-exercise control; the shaded area is the difference in glycaemic excursion. Right: the two summary effects — a ~1.4 mmol·L⁻¹ lower 3-hour postprandial peak after breakfast and a ~0.7 mmol·L⁻¹ lower 24-hour mean glucose, in insulin-resistant adults (Carter & Solomon 2020).
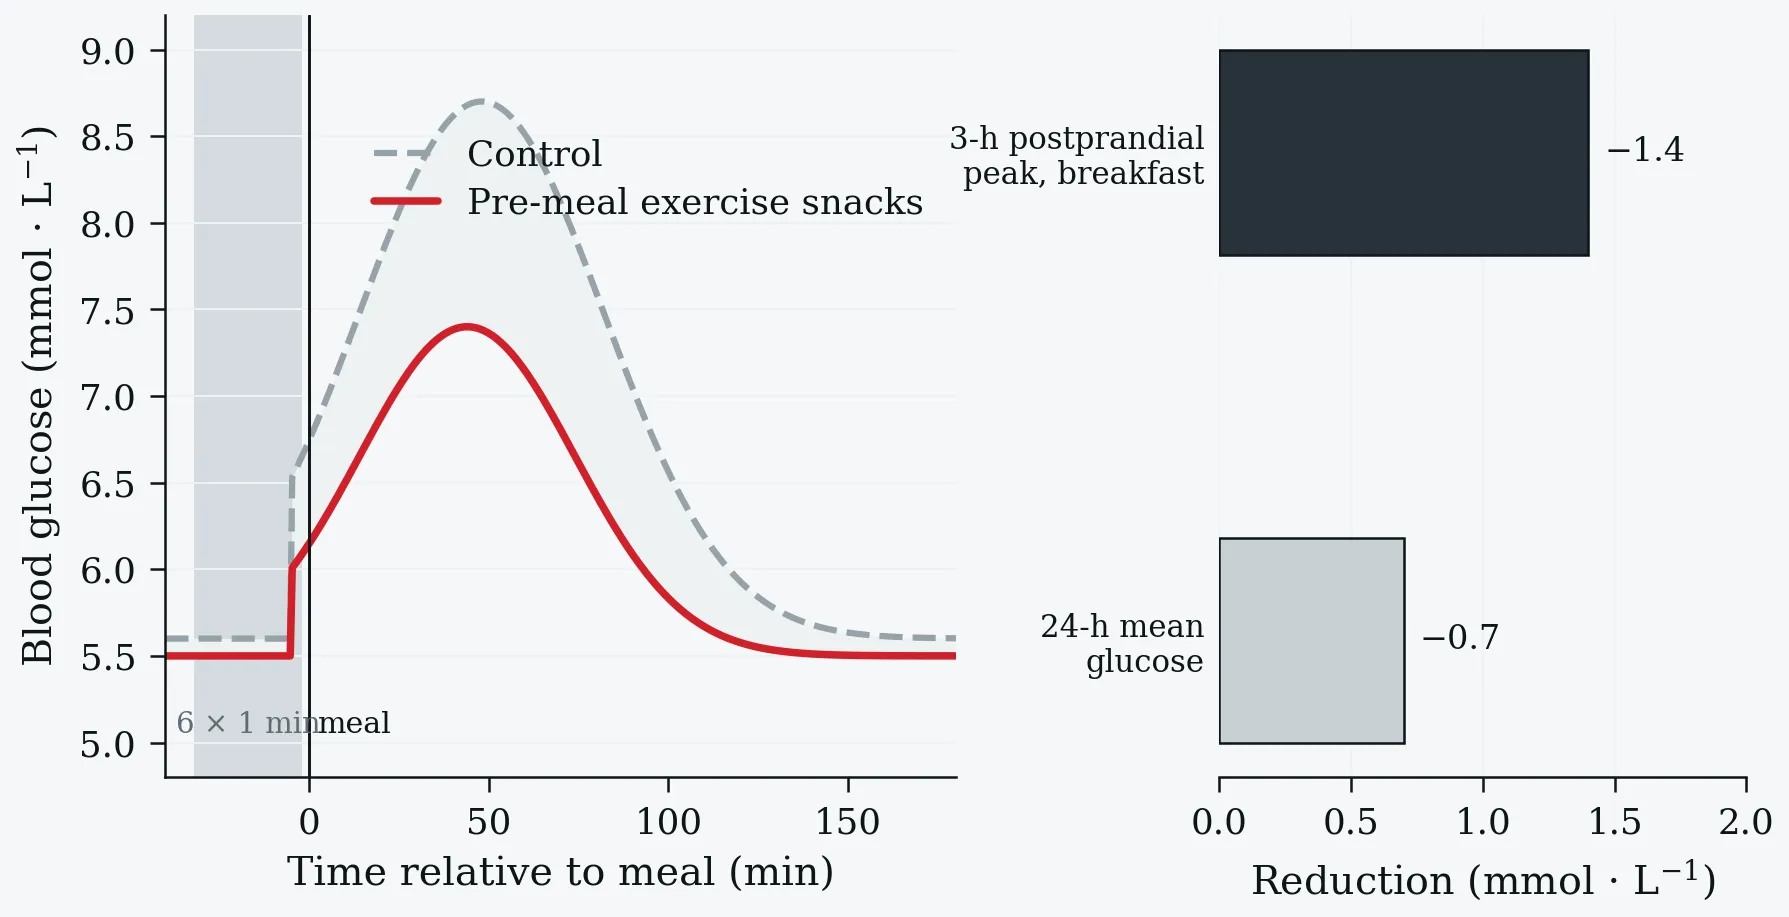
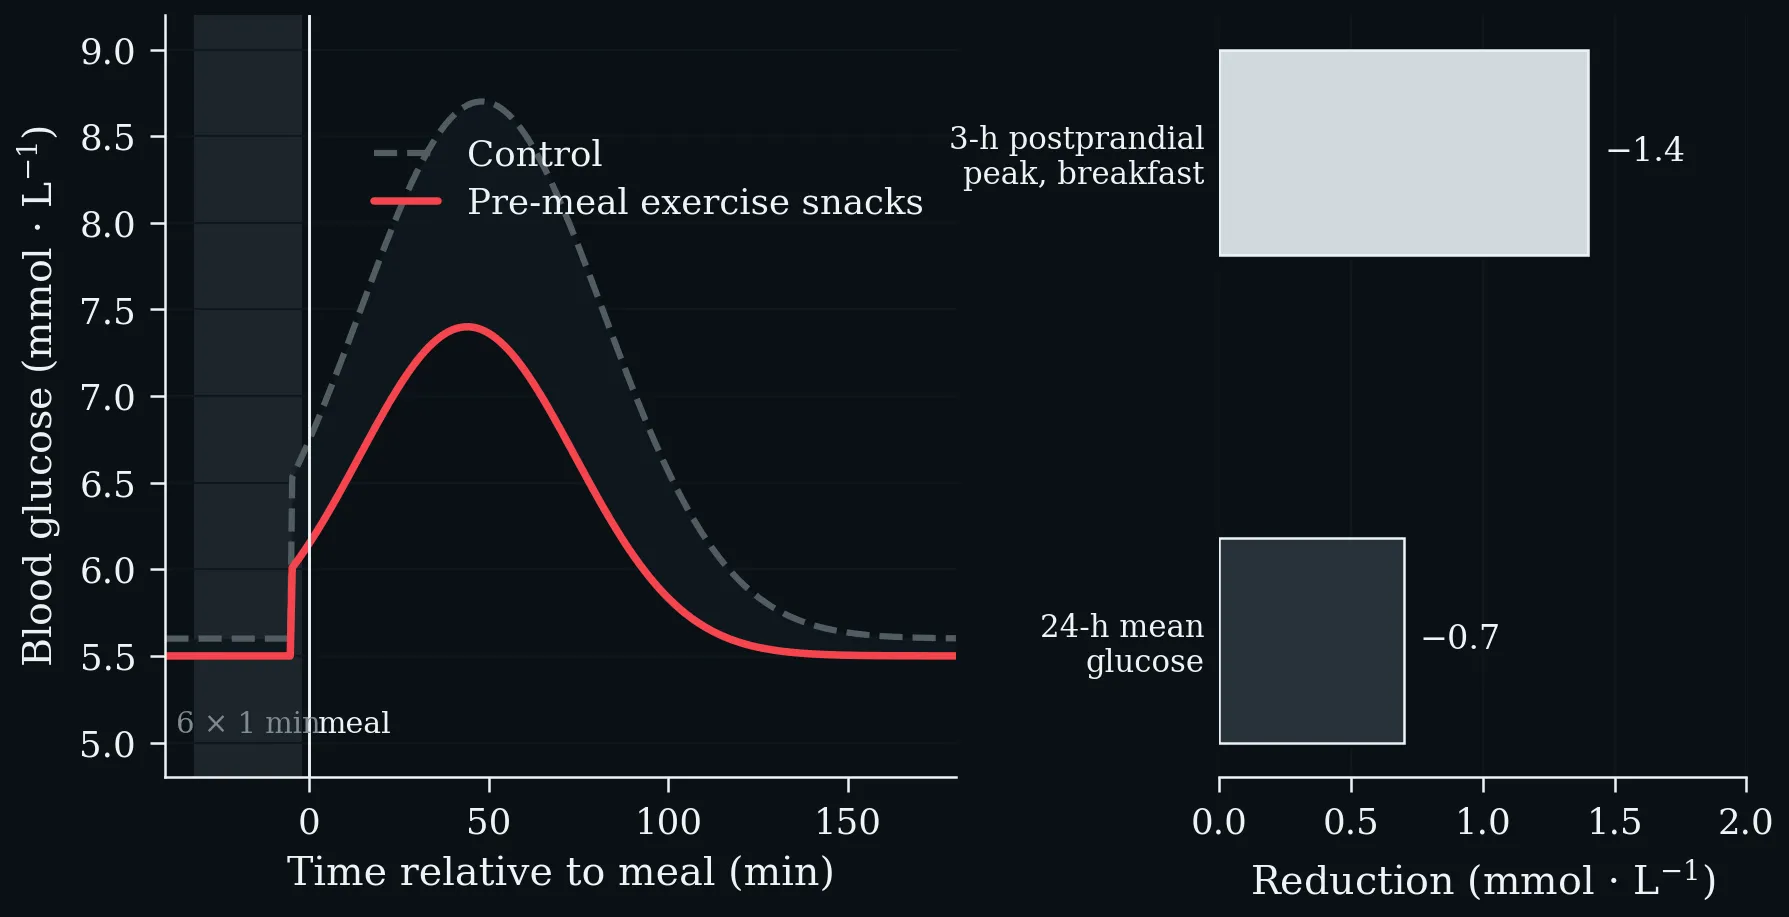
Left: blood glucose after a meal preceded by six one-minute exercise snacks versus a no-exercise control; the shaded area is the difference in glycaemic excursion. Right: the two summary effects — a ~1.4 mmol·L⁻¹ lower 3-hour postprandial peak after breakfast and a ~0.7 mmol·L⁻¹ lower 24-hour mean glucose, in insulin-resistant adults (Carter & Solomon 2020).
Reduction in mortality risk associated with vigorous intermittent lifestyle physical activity, by outcome. Three separate bouts of 1–2 min per day are associated with larger reductions than a single daily bout of 4.4 min, and the effect is largest for cardiovascular mortality. UK Biobank, n = 25,241 non-exercisers, mean age 61.8 y (Stamatakis et al. 2022).
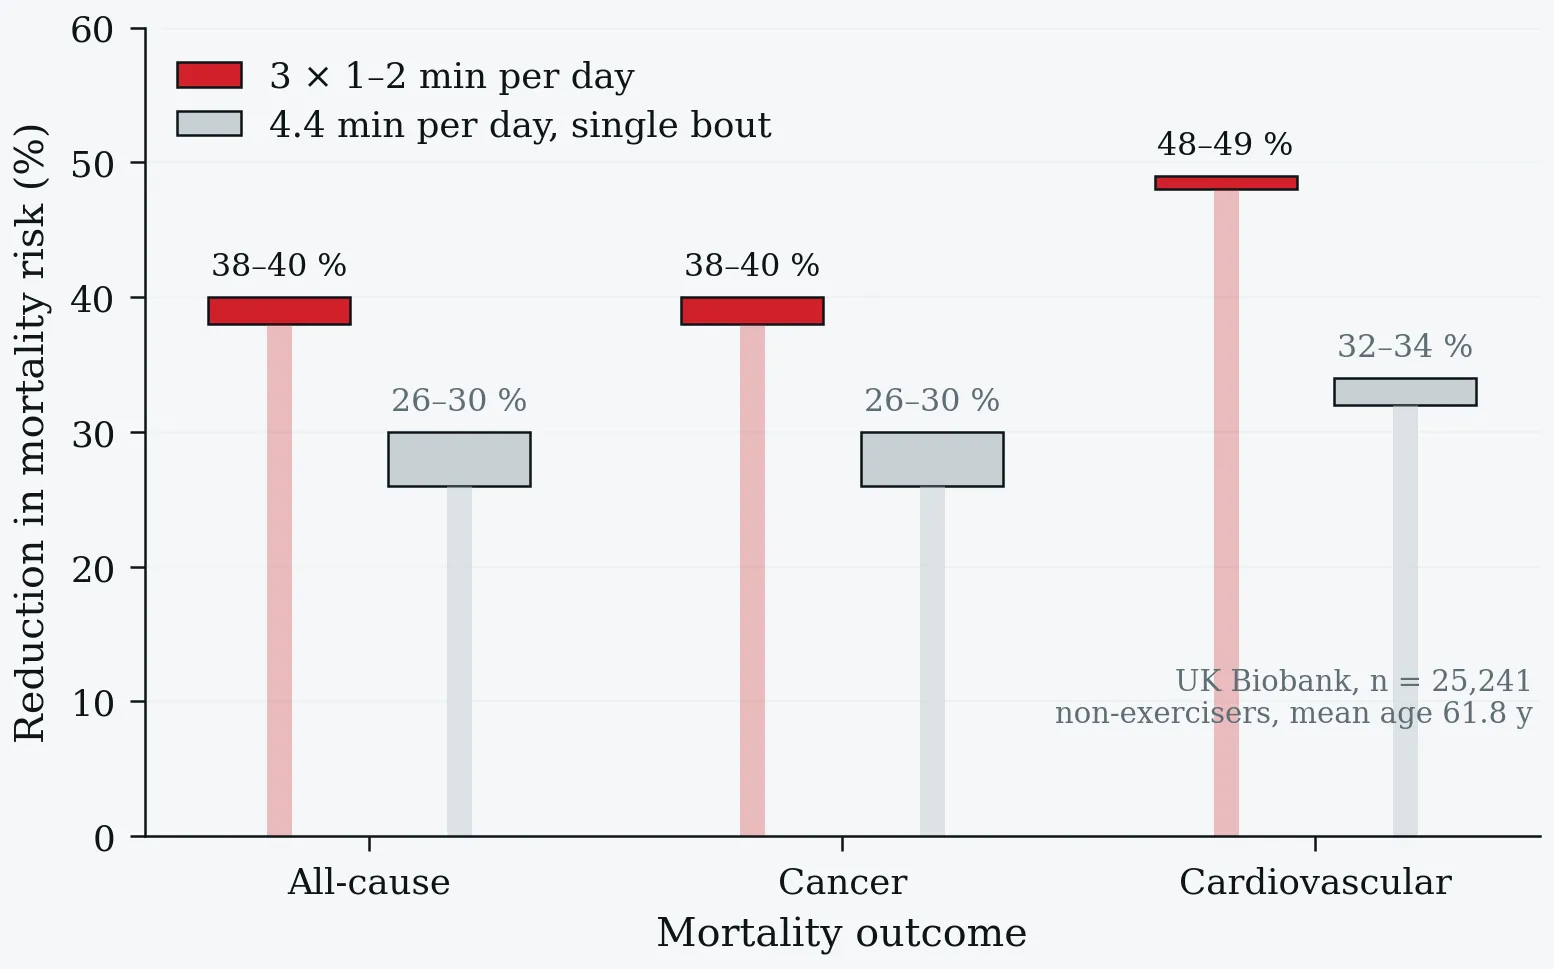
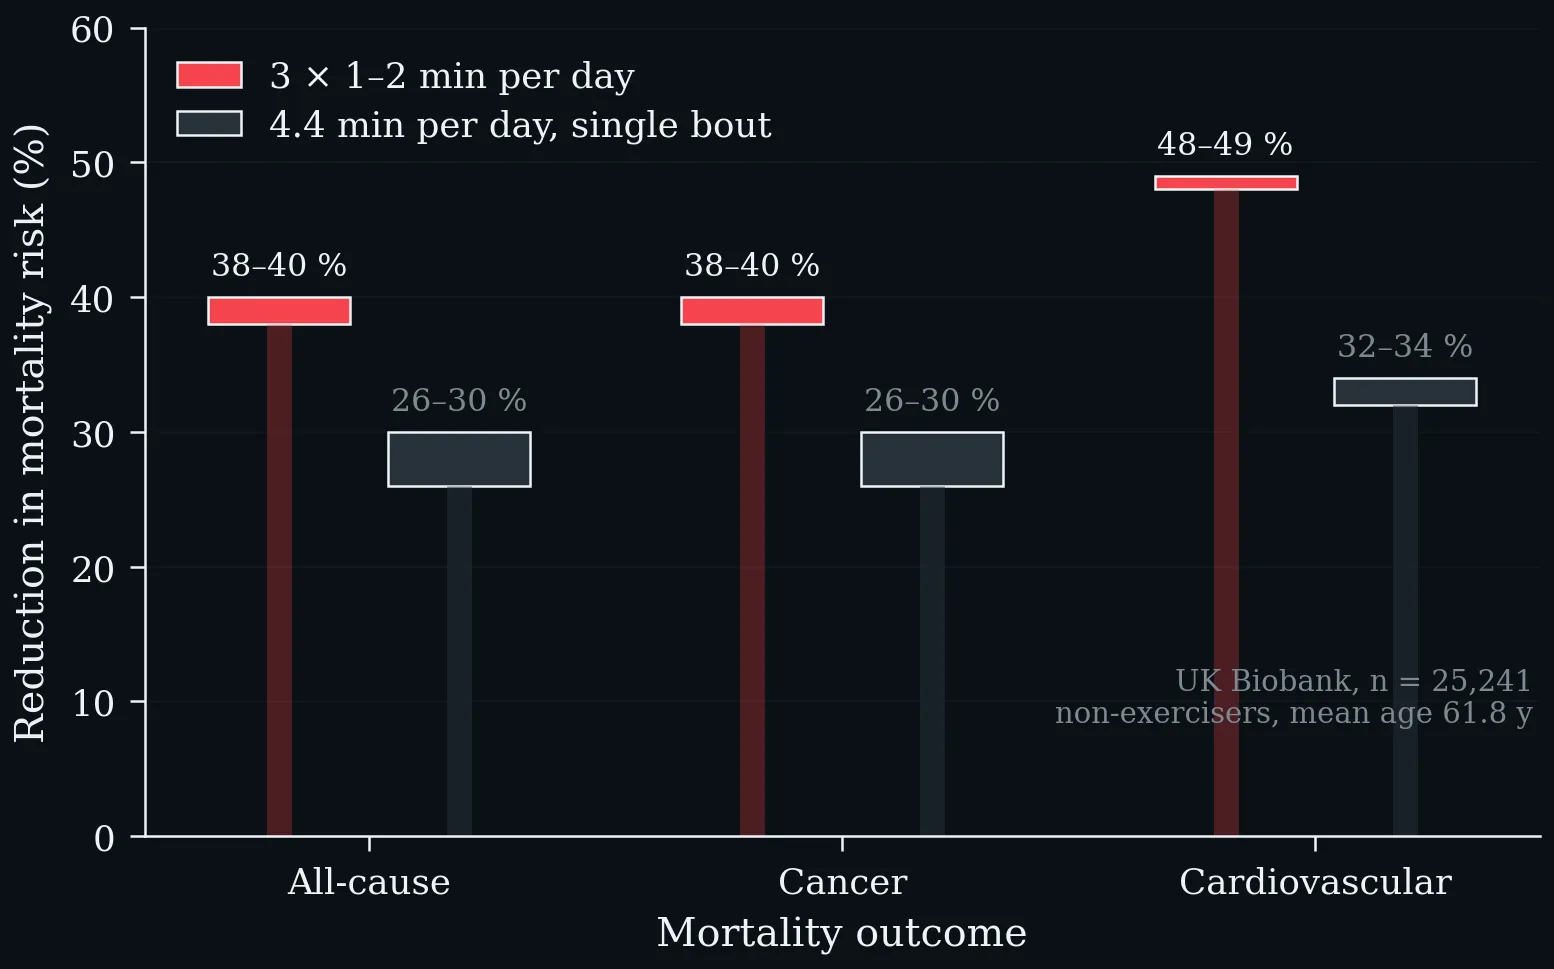
Reduction in mortality risk associated with vigorous intermittent lifestyle physical activity, by outcome. Three separate bouts of 1–2 min per day are associated with larger reductions than a single daily bout of 4.4 min, and the effect is largest for cardiovascular mortality. UK Biobank, n = 25,241 non-exercisers, mean age 61.8 y (Stamatakis et al. 2022).
Exercise Snack protocols and anti-inflammatory efficacy (data: literature analysis). HIIT: high-intensity interval training.
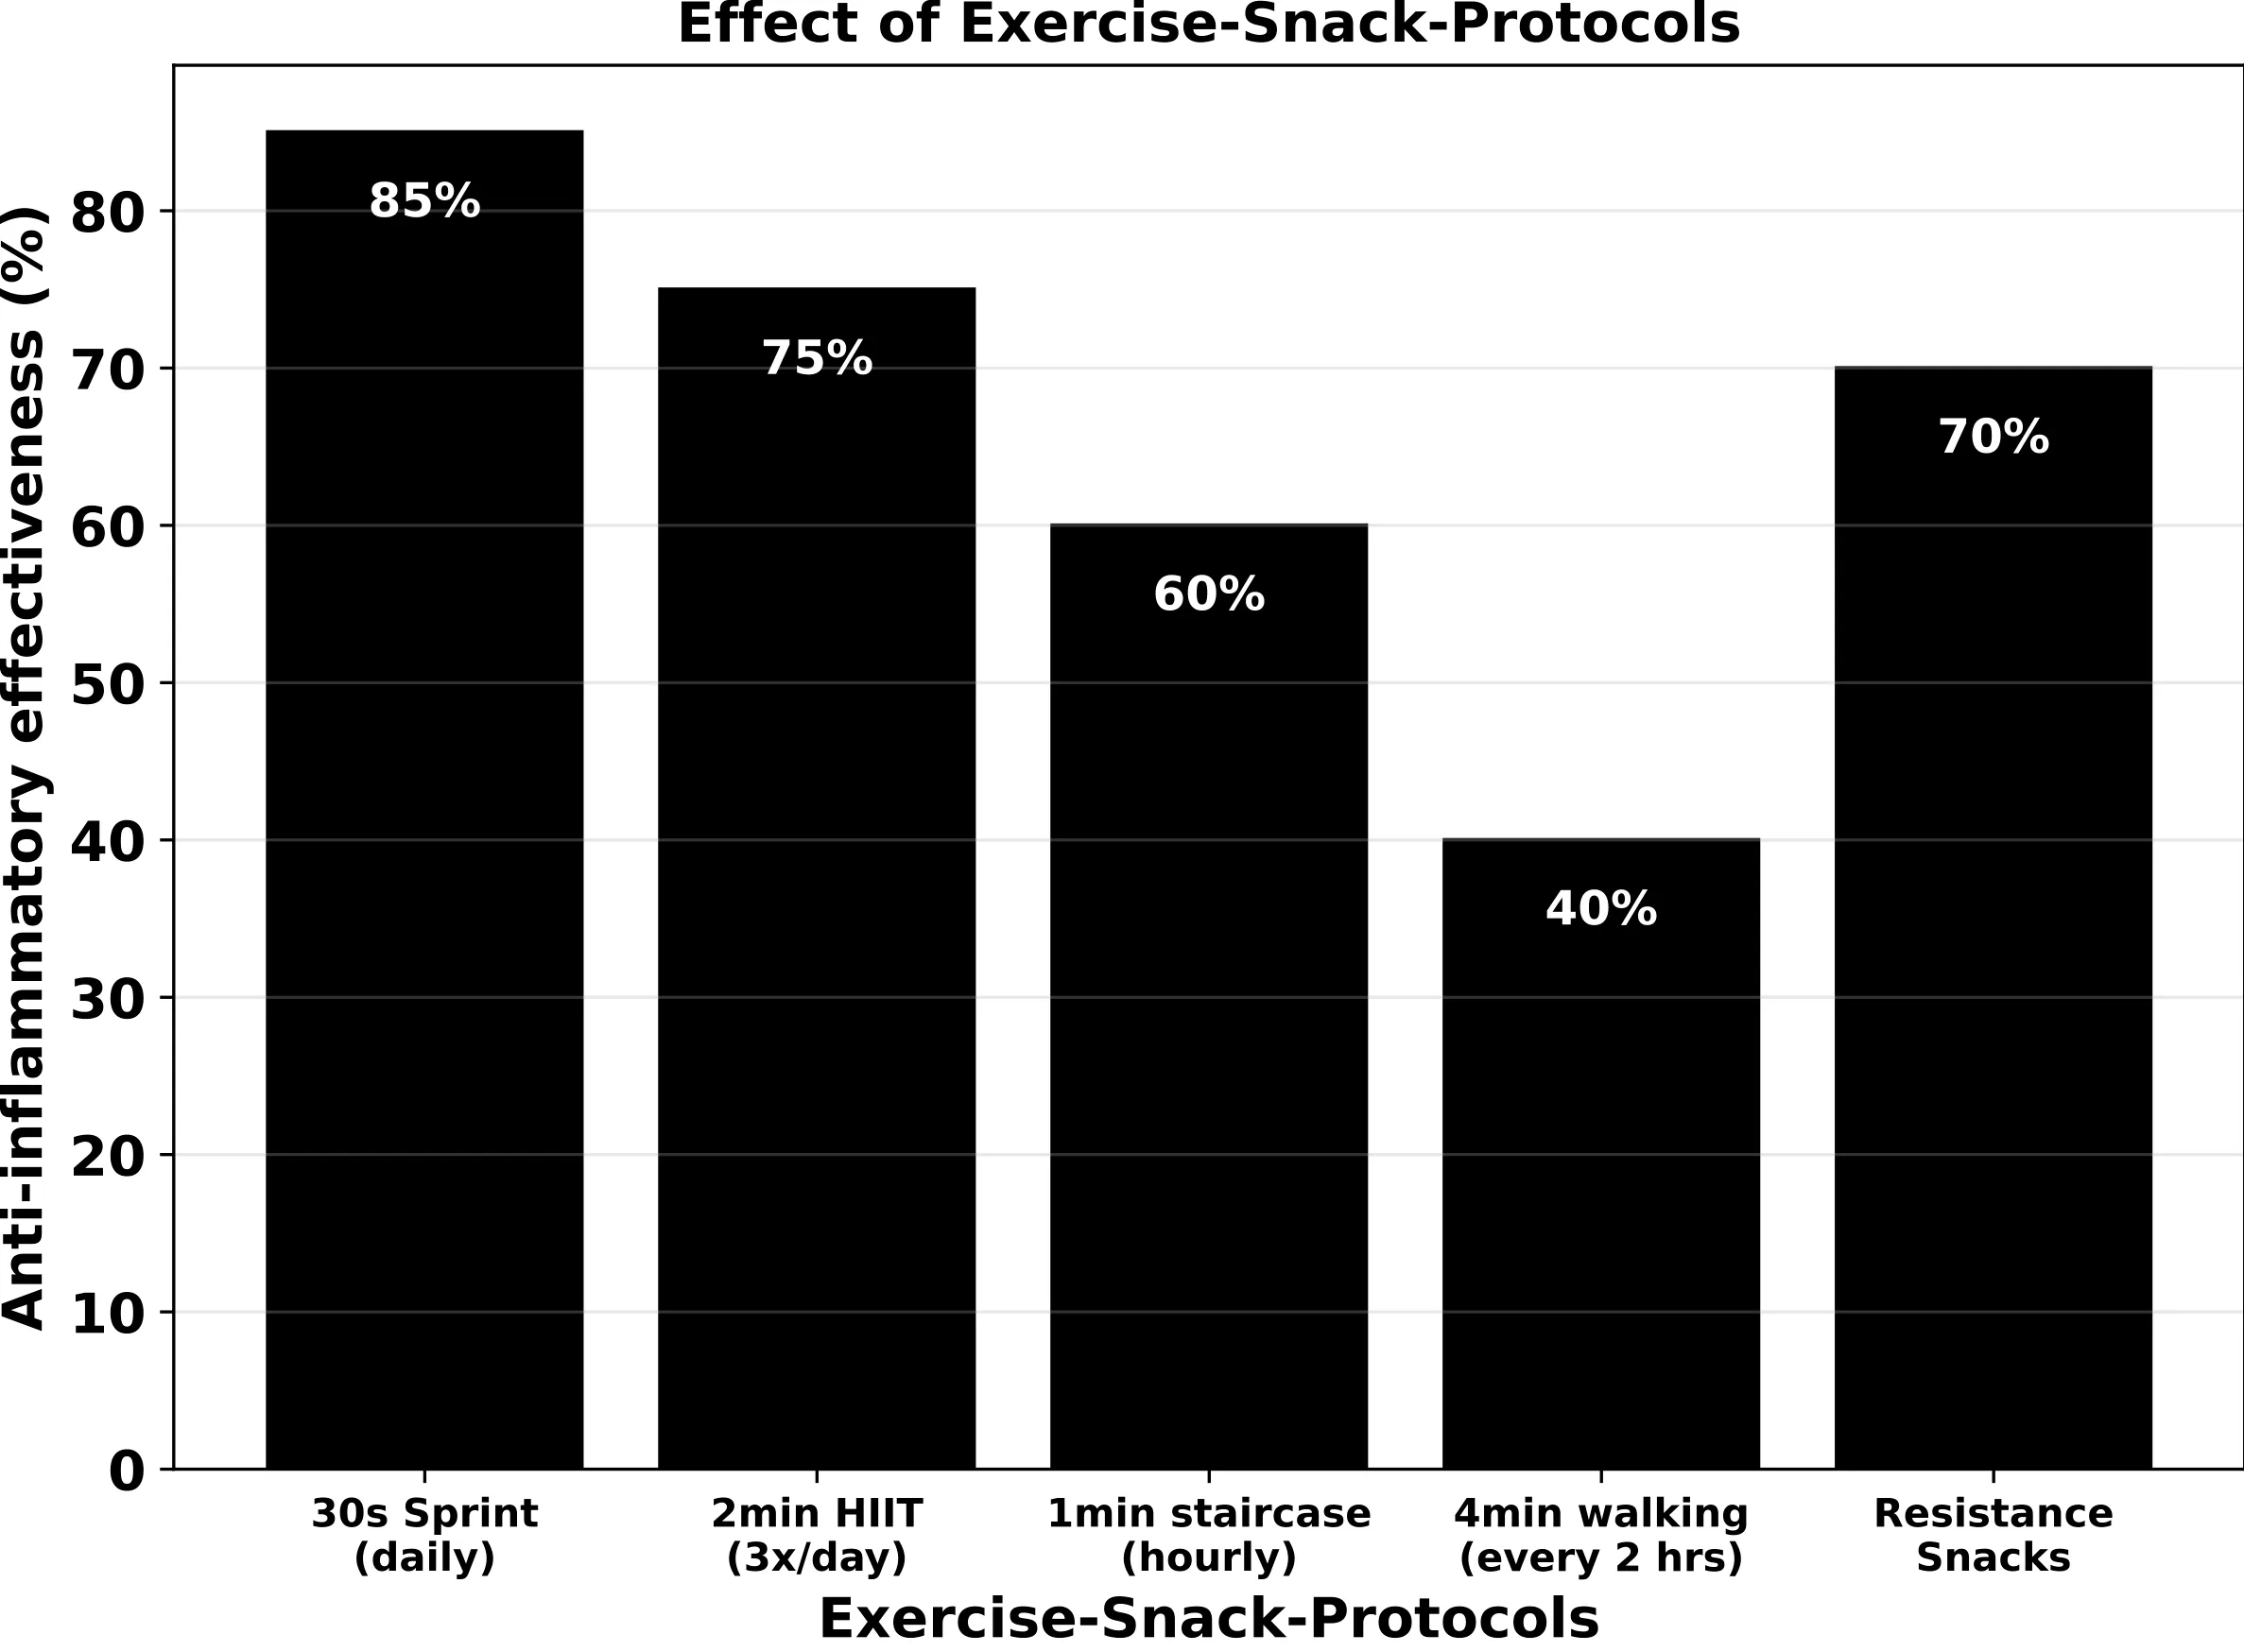
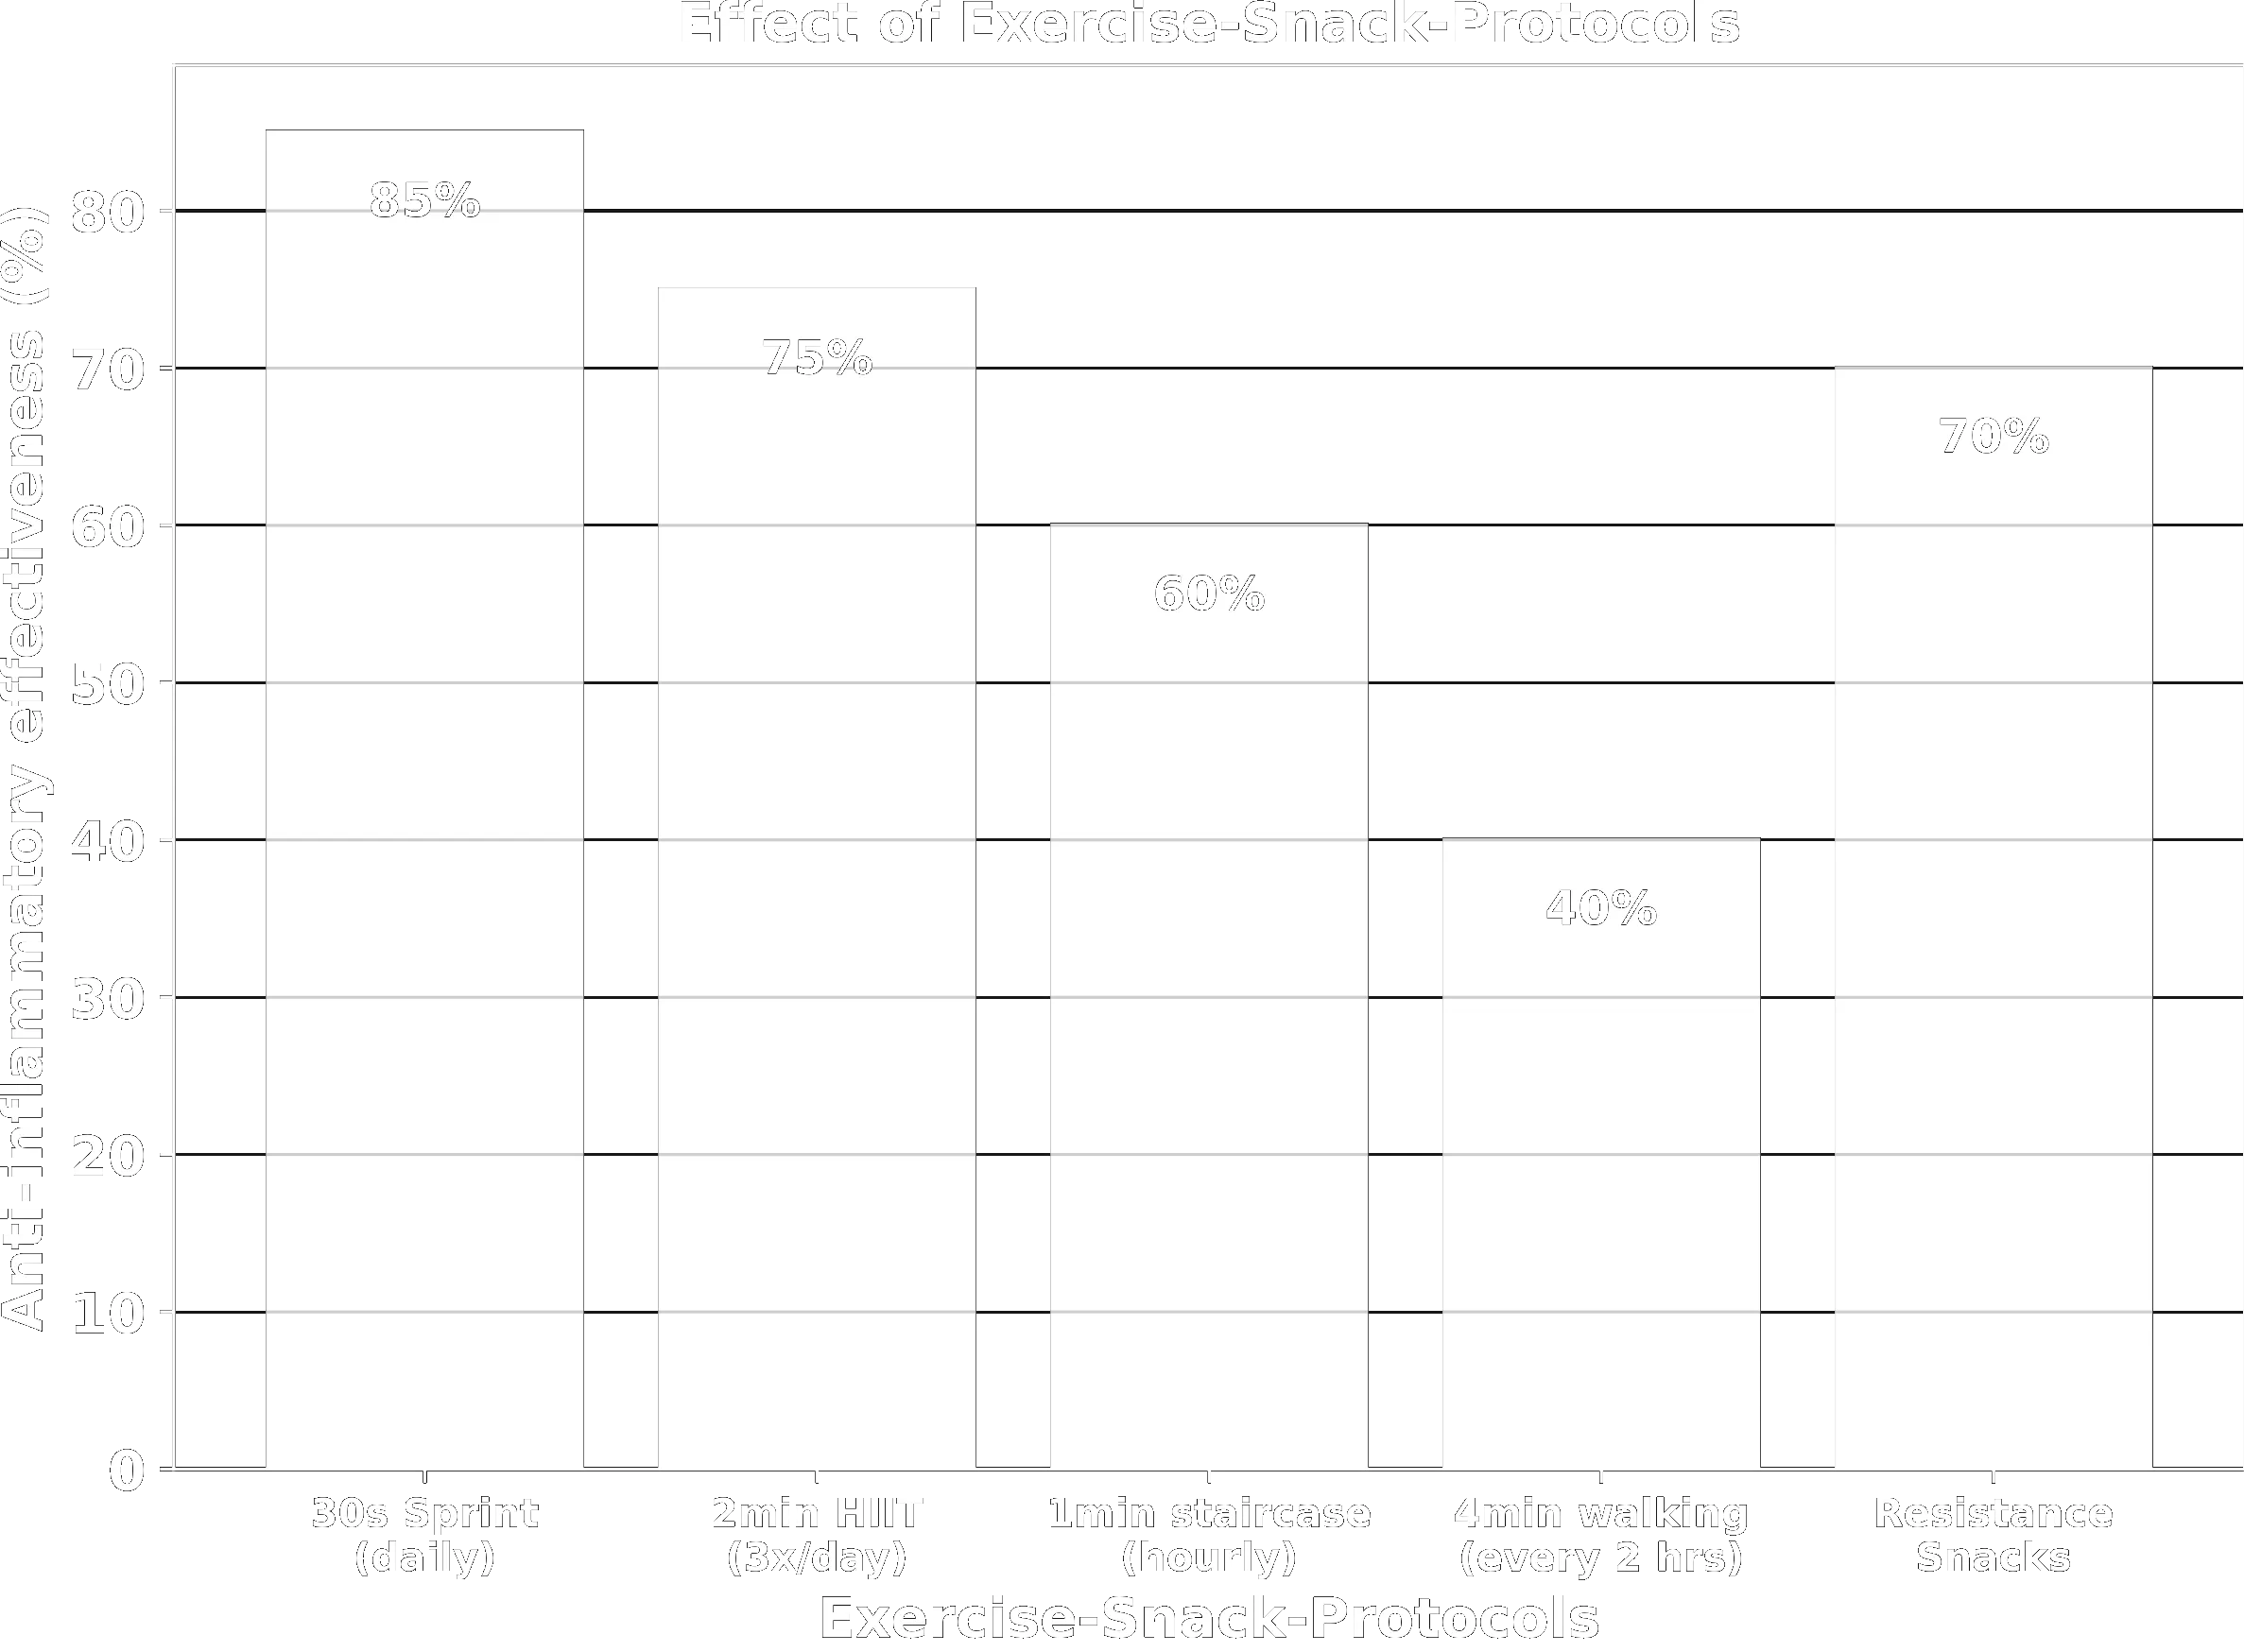
Exercise Snack protocols and anti-inflammatory efficacy (data: literature analysis). HIIT: high-intensity interval training.
Exercise Snacks — energy-metabolism signalling. Both the GLUT4 and LPL axes operate insulin-independently via AMPK, converging on reduced insulin resistance and lower cardiovascular risk.
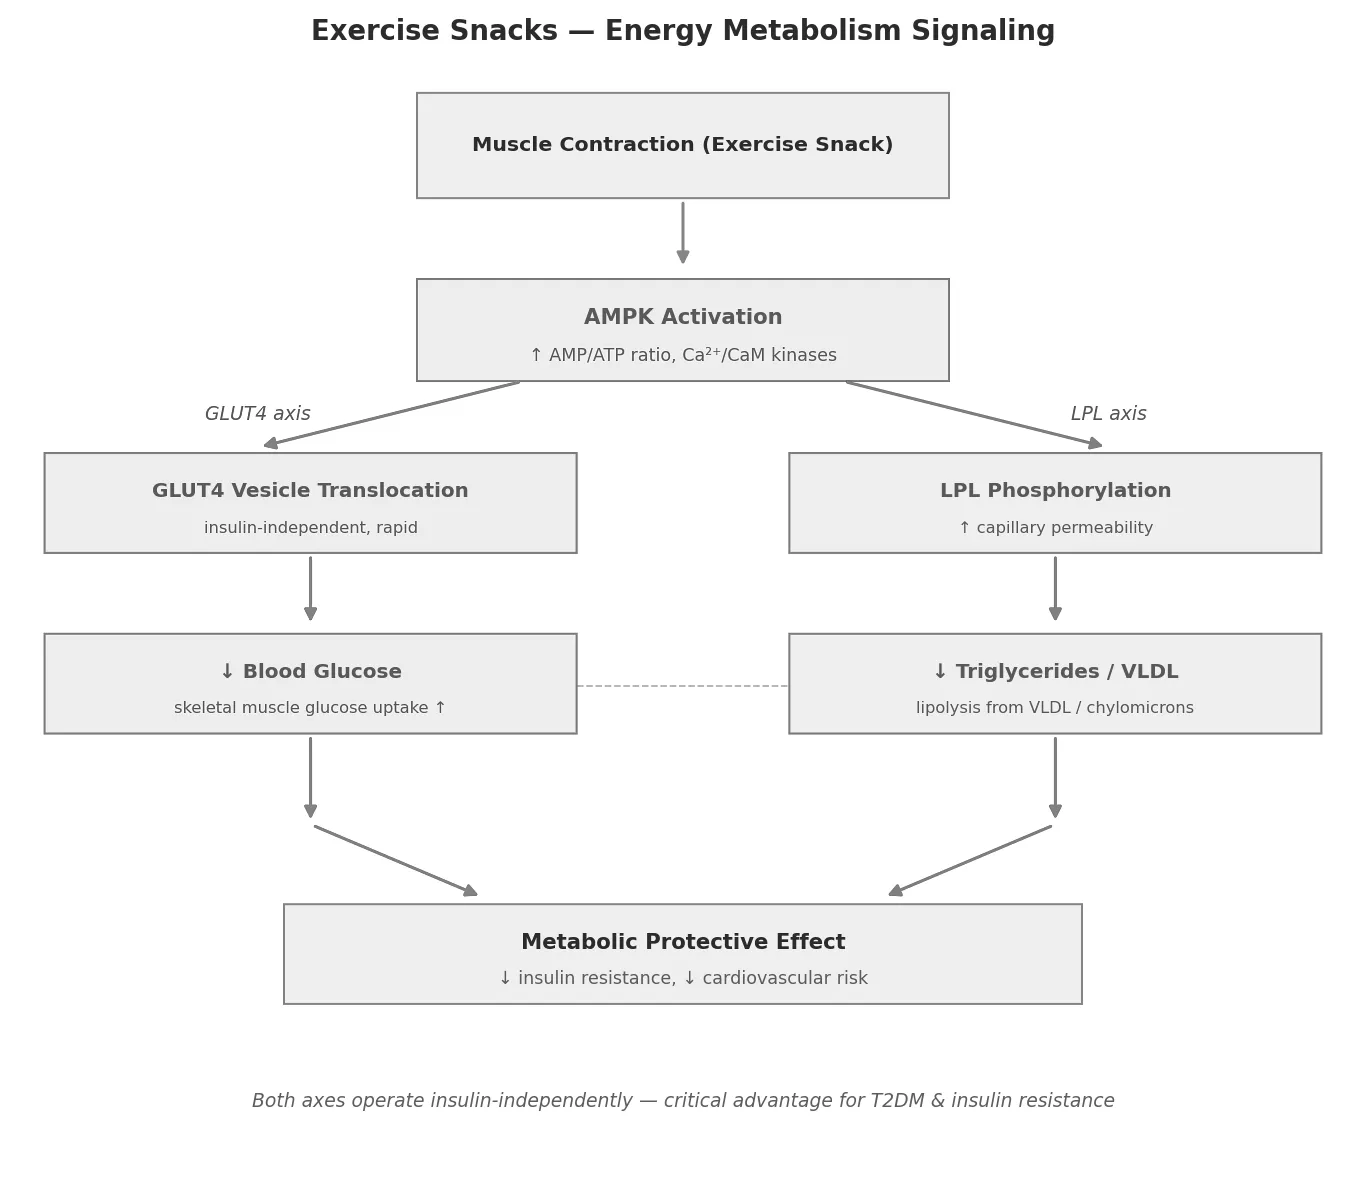
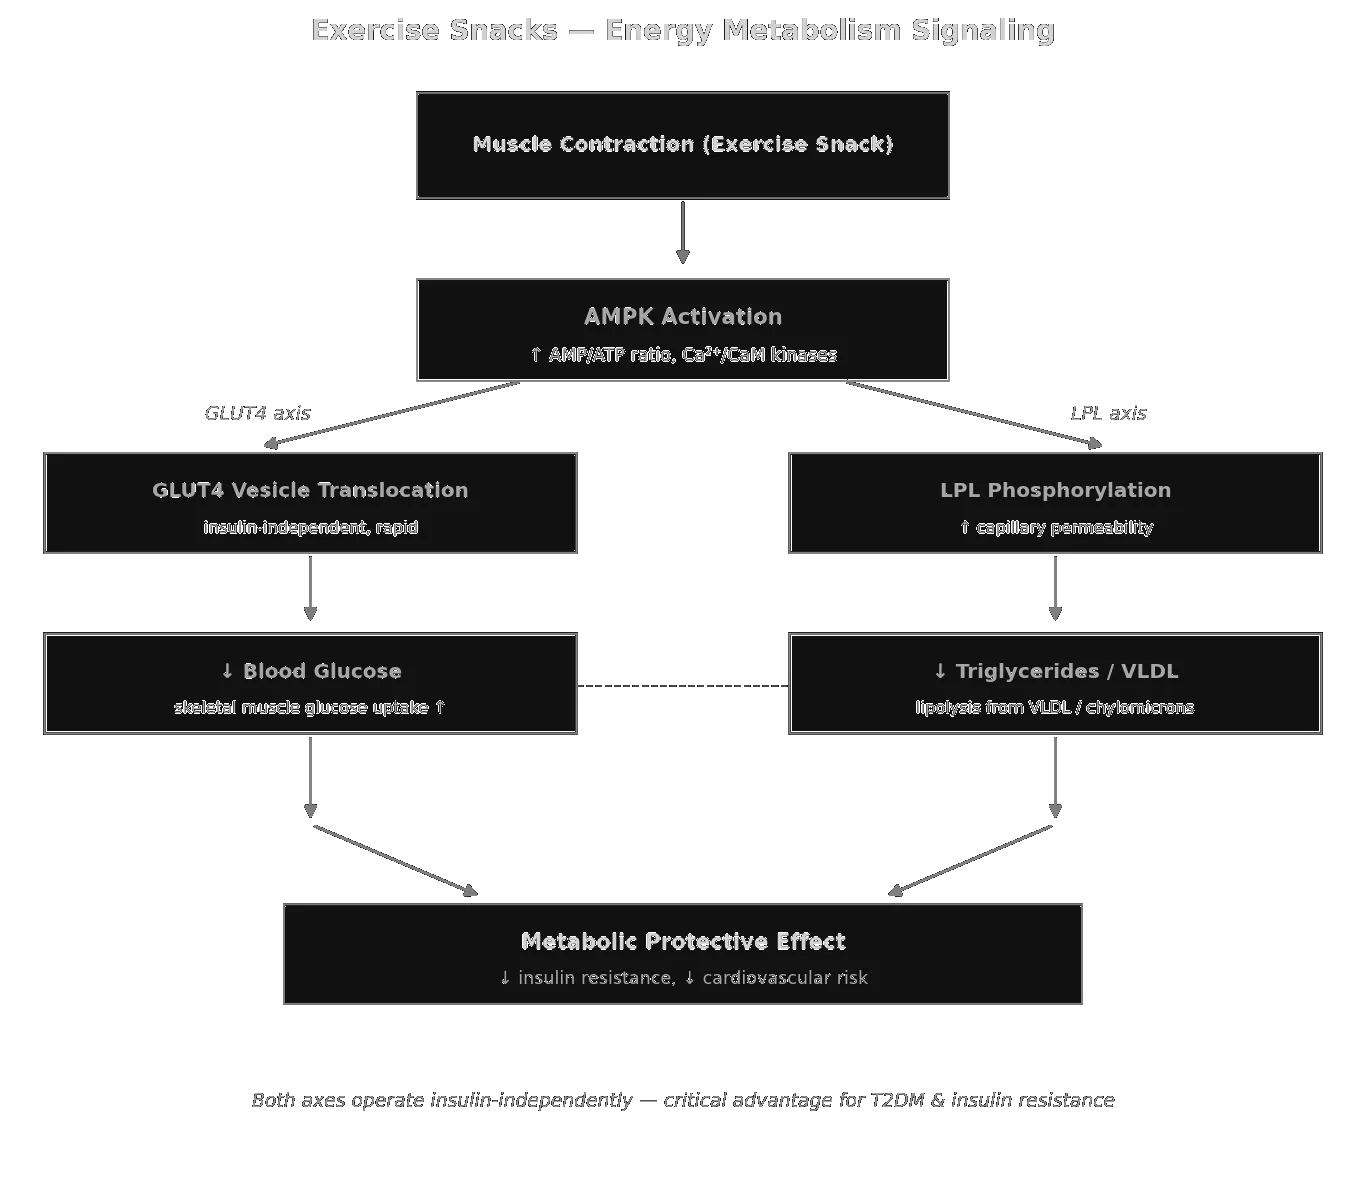
Exercise Snacks — energy-metabolism signalling. Both the GLUT4 and LPL axes operate insulin-independently via AMPK, converging on reduced insulin resistance and lower cardiovascular risk.
Exercise Snacks — muscle signalling: three staggered phases from acute AMPK/PGC-1α through mTORC1-driven protein synthesis to satellite-cell hypertrophy.
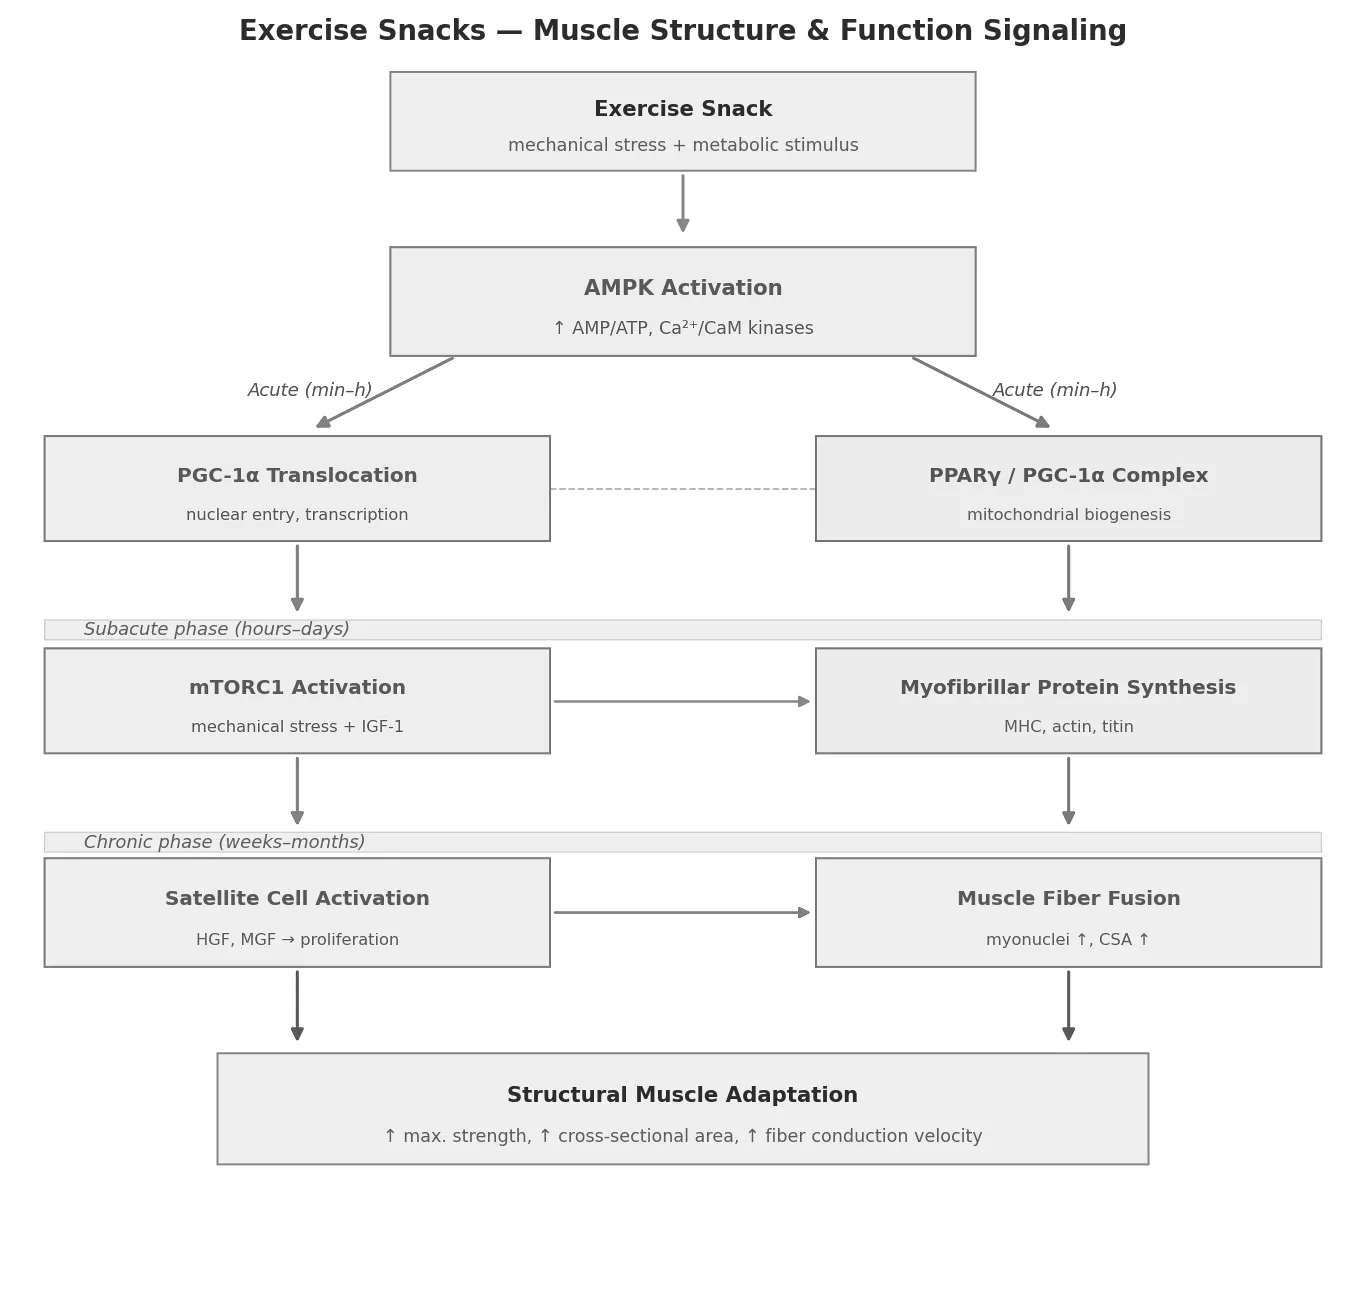
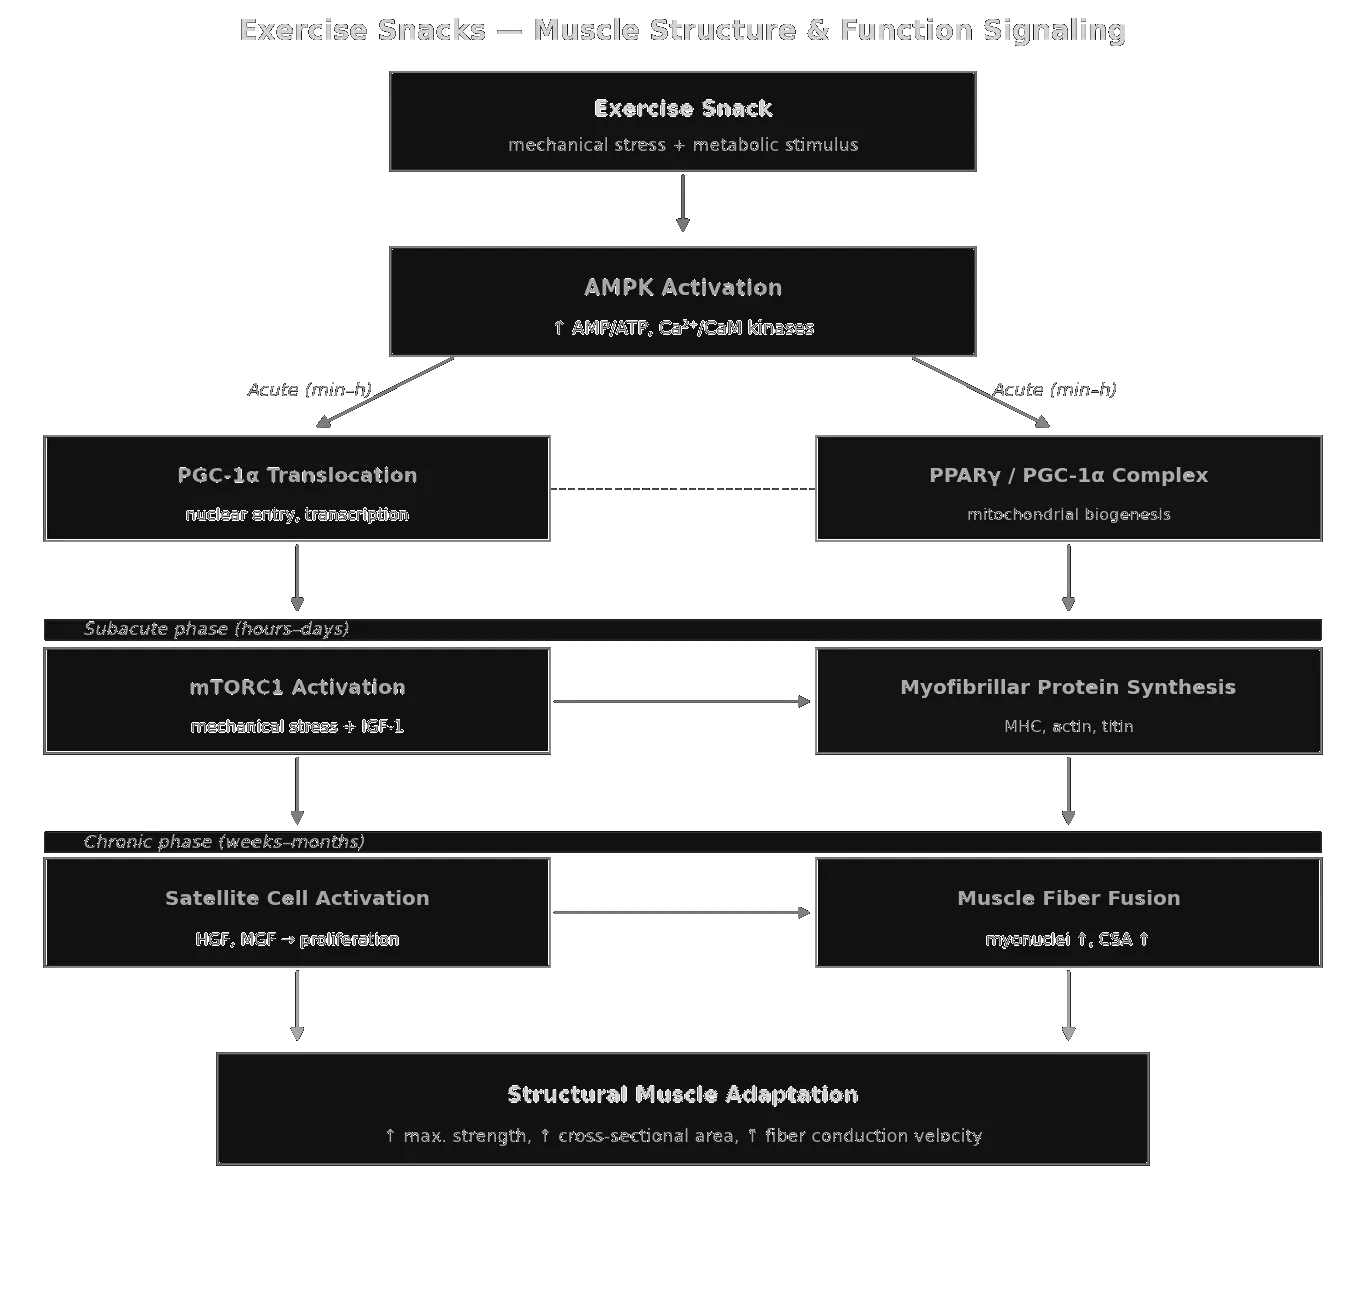
Exercise Snacks — muscle signalling: three staggered phases from acute AMPK/PGC-1α through mTORC1-driven protein synthesis to satellite-cell hypertrophy.
Exercise Snacks — aerobic-capacity signalling: central (CO) and peripheral (a-vO₂ diff) adaptations framed by the Fick equation, with snacks disproportionately targeting the peripheral side.
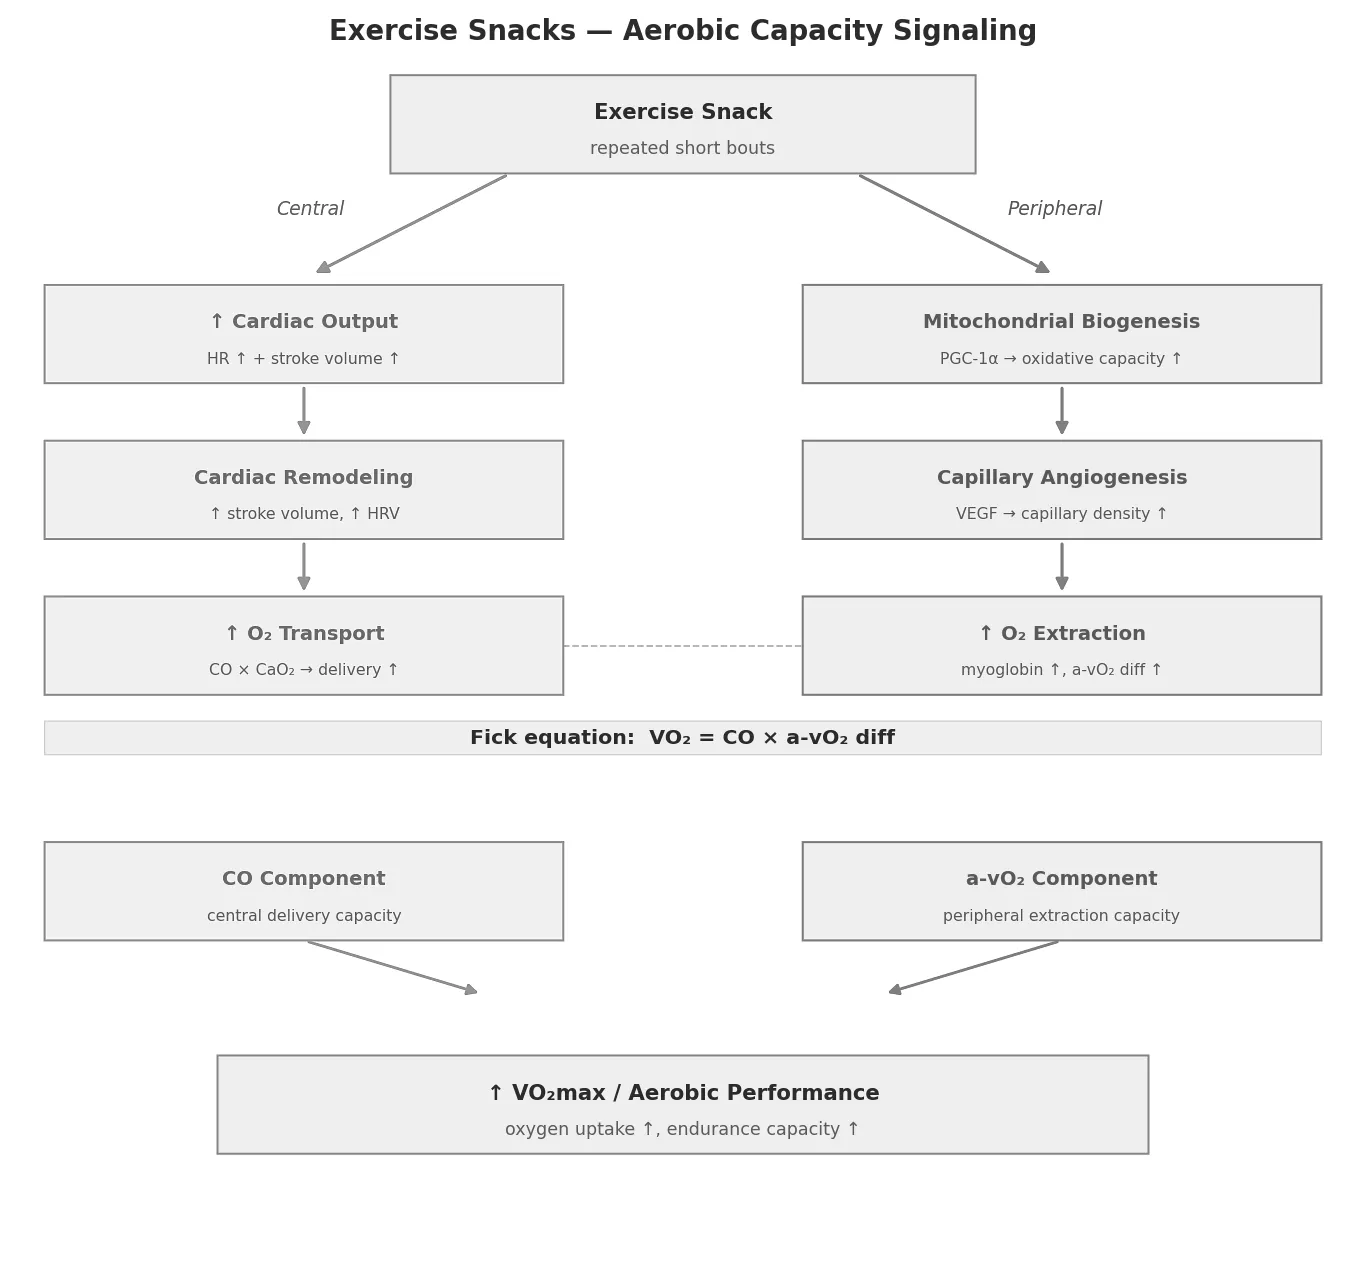
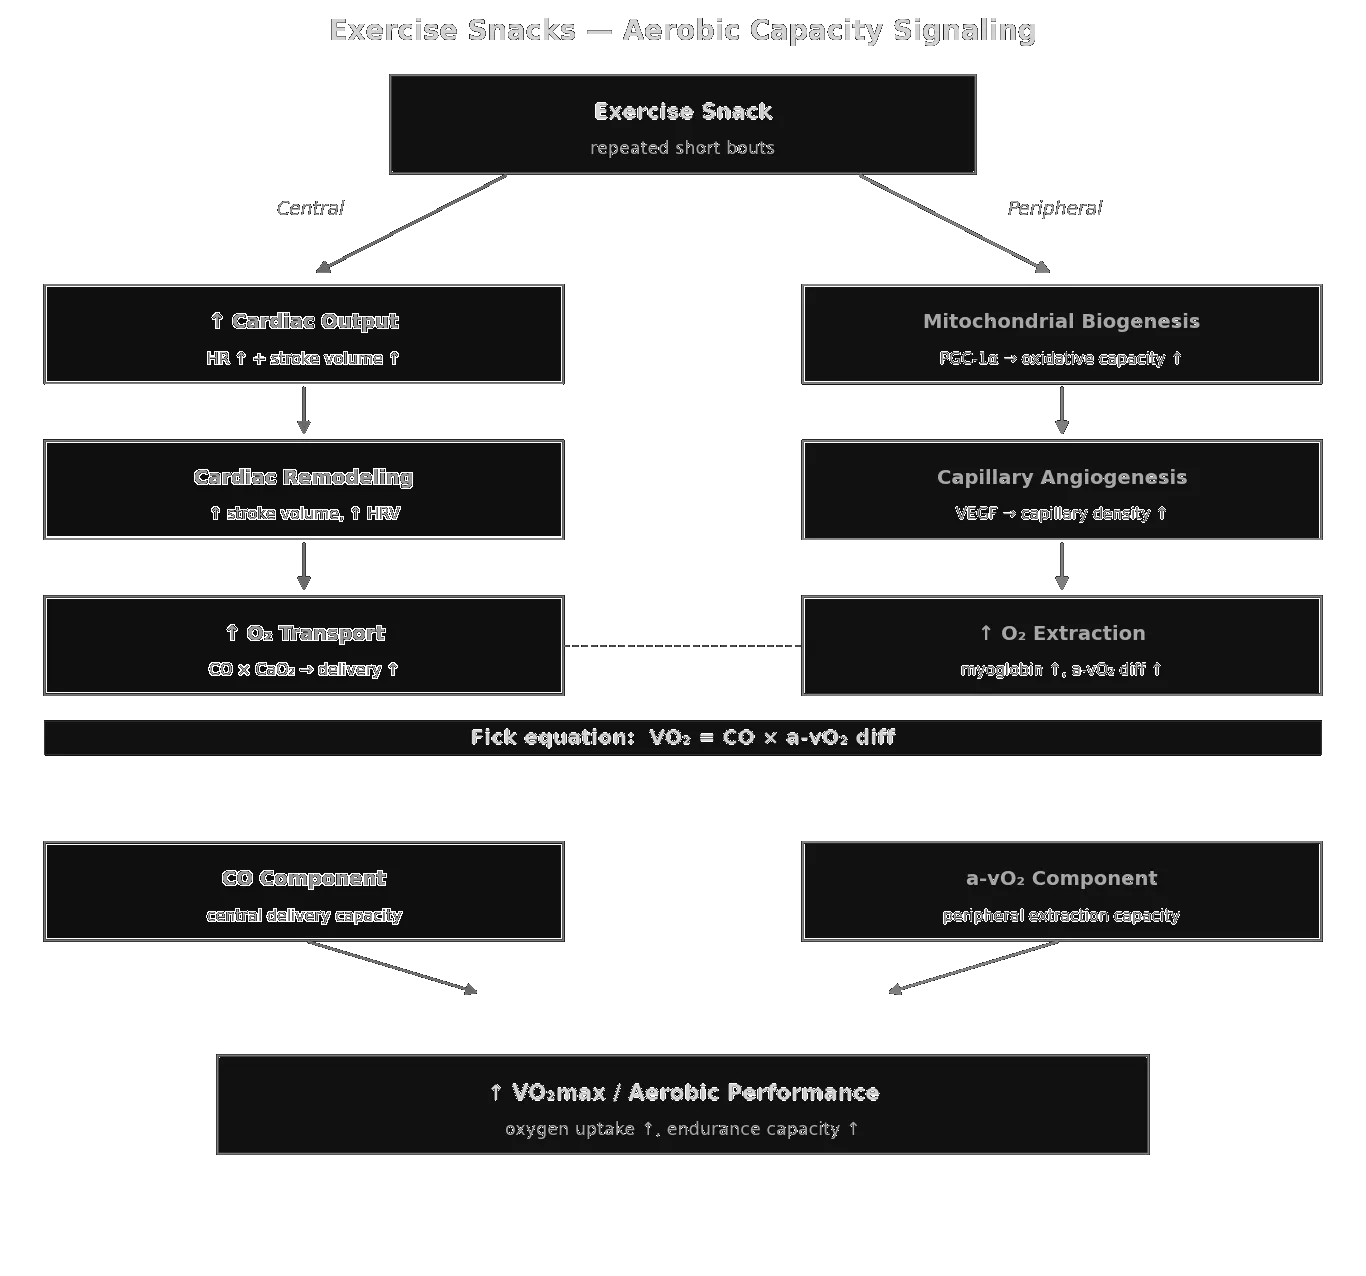
Exercise Snacks — aerobic-capacity signalling: central (CO) and peripheral (a-vO₂ diff) adaptations framed by the Fick equation, with snacks disproportionately targeting the peripheral side.
Exercise Snacks — immunological signalling: three parallel axes (myokines, transcriptional reprogramming, microbiome metabolites) converging on NF-κB suppression.
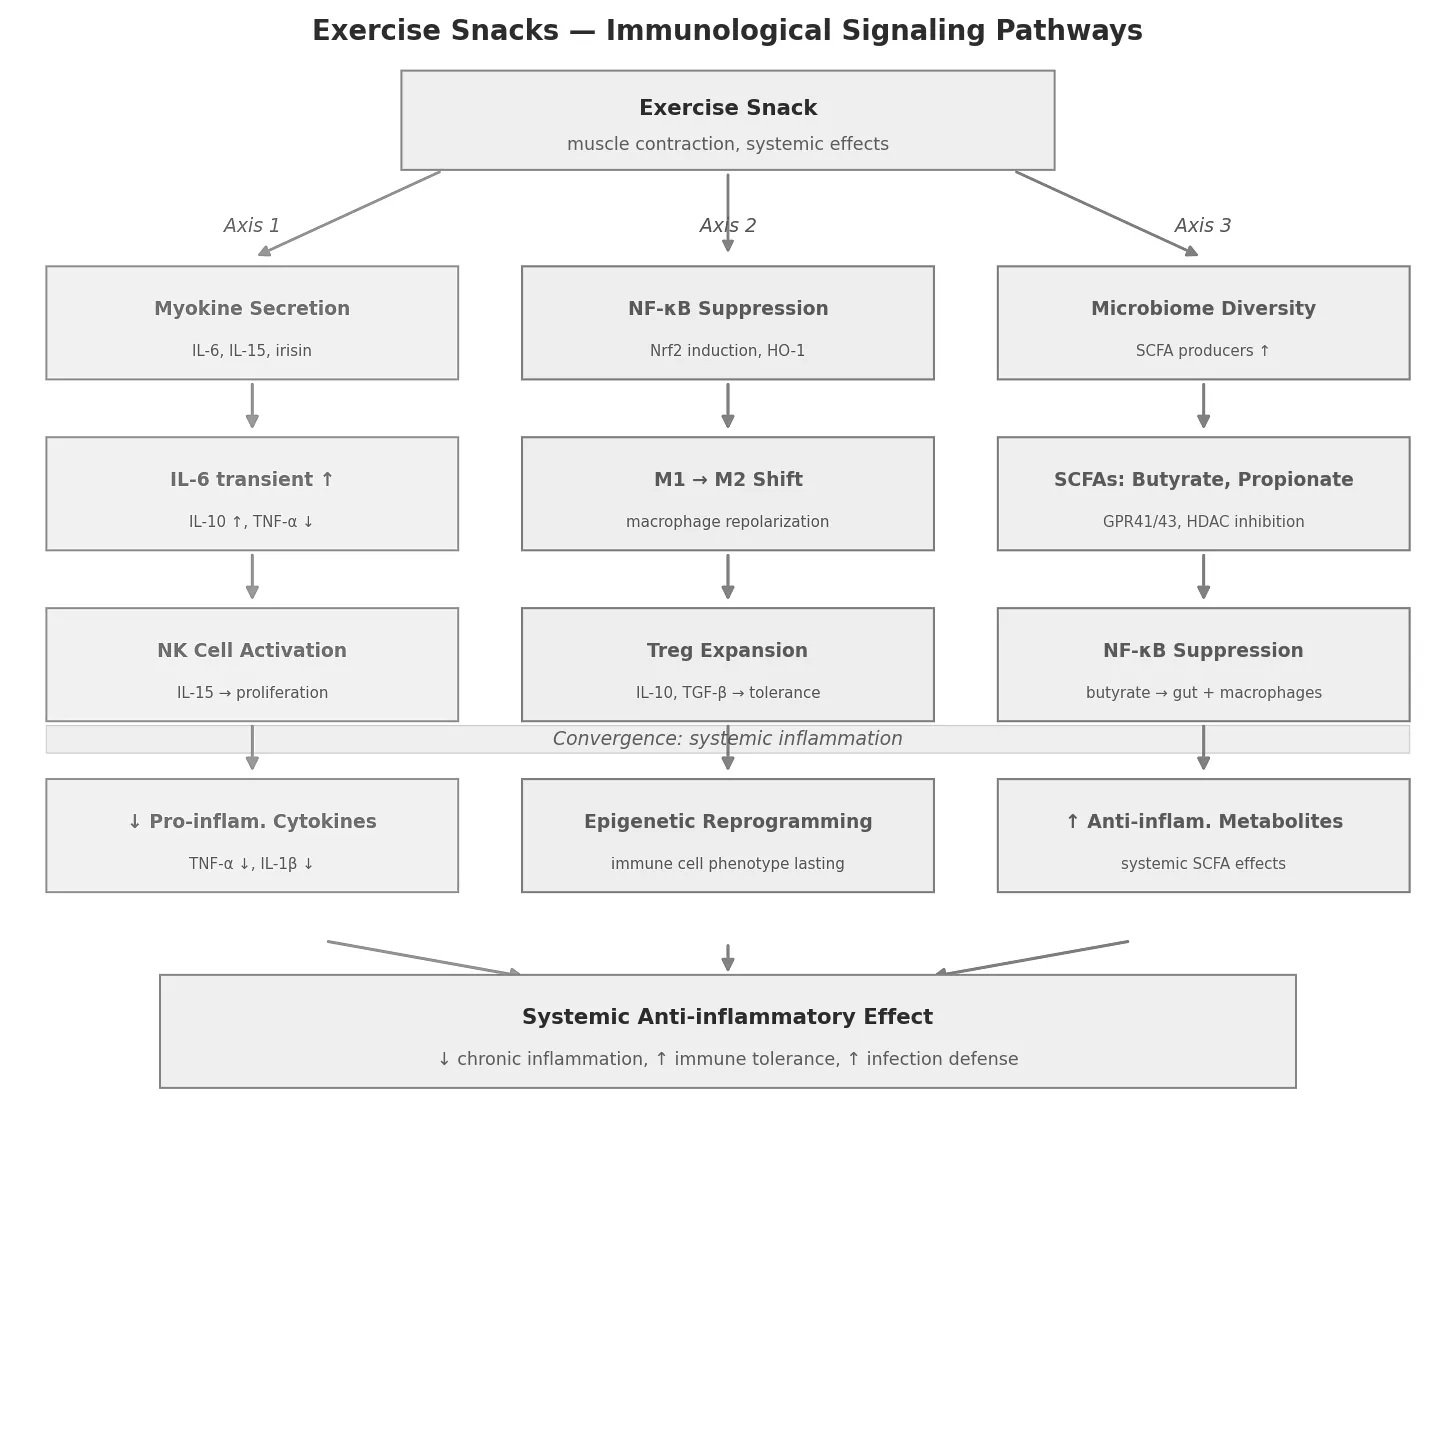
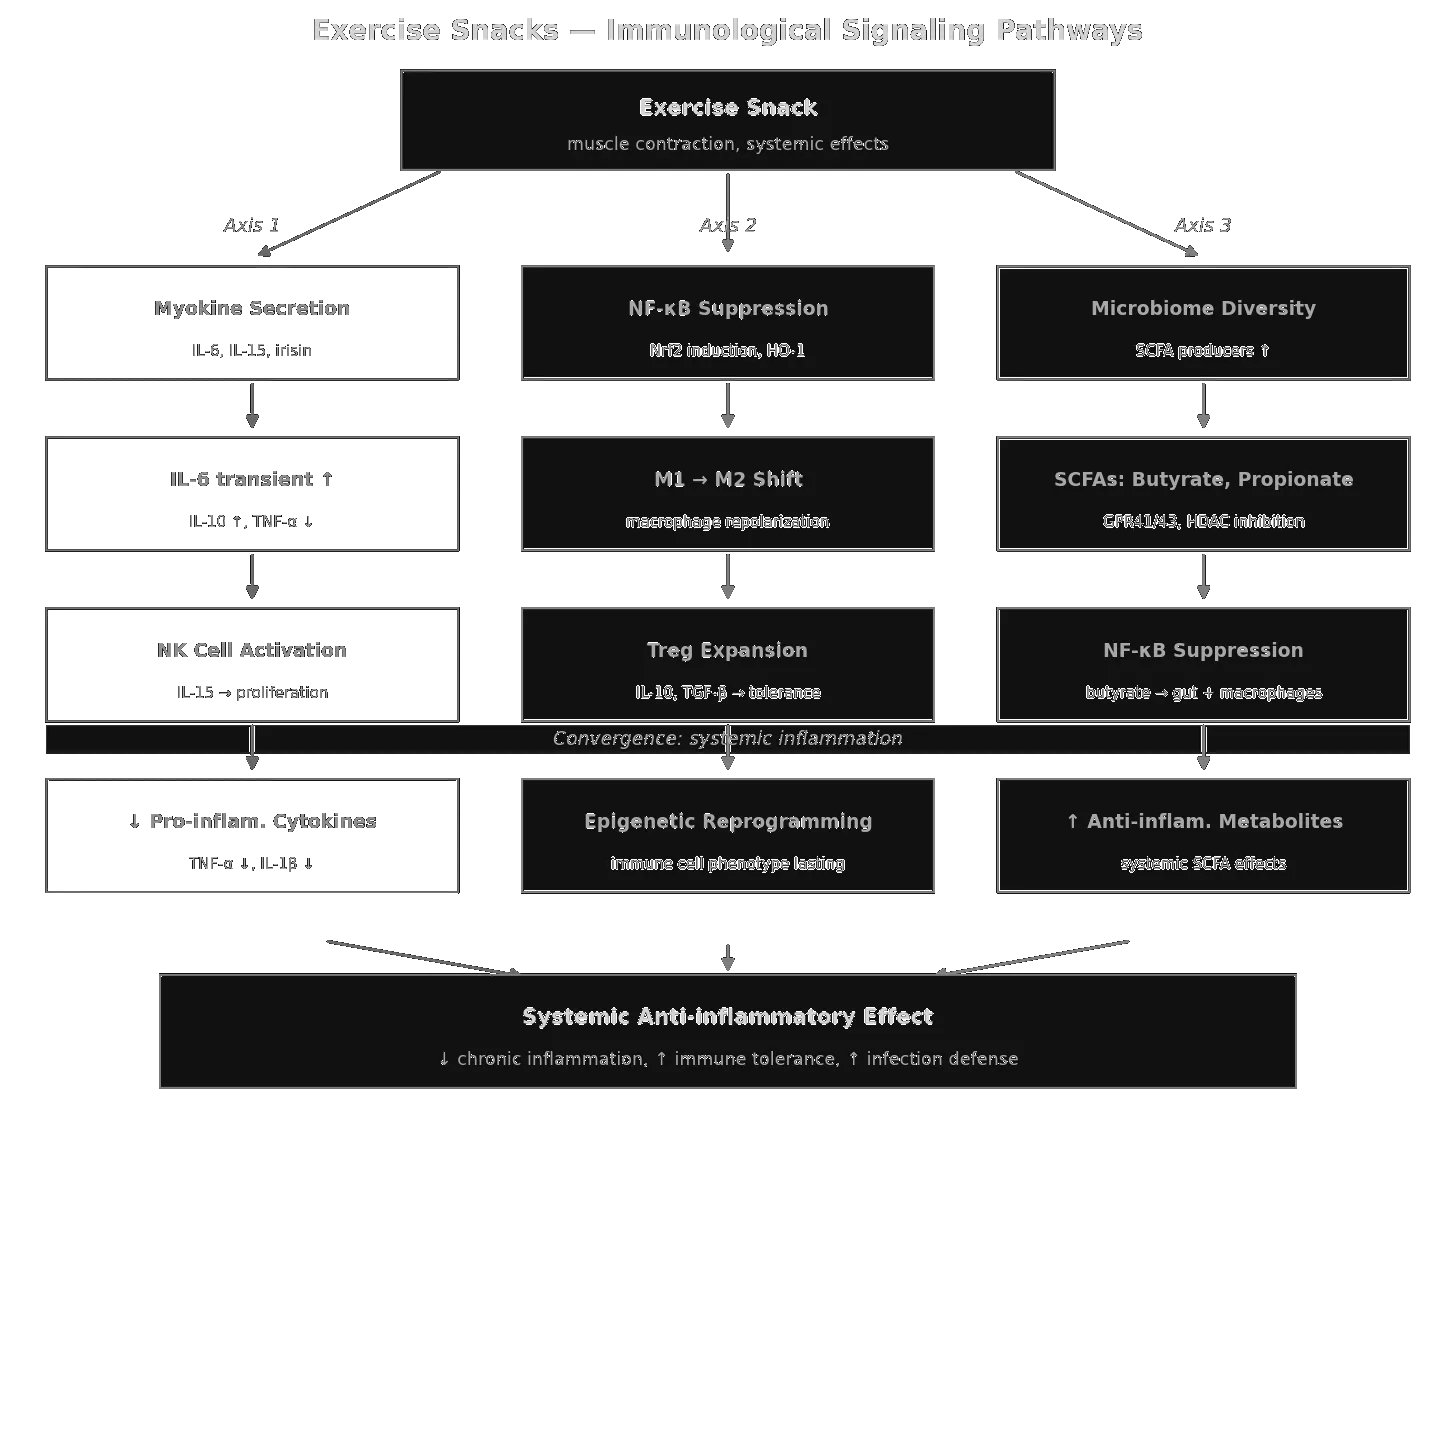
Exercise Snacks — immunological signalling: three parallel axes (myokines, transcriptional reprogramming, microbiome metabolites) converging on NF-κB suppression.
The four domains on a shared logarithmic time axis, from the stimulus to the adaptation. Energy metabolism responds within minutes to hours, immune signalling over hours to weeks, muscle structure over hours to months, and aerobic capacity only after weeks — which is why a single snack is measurable in glucose but not in V̇O₂max. Central mediators are named below each bar.
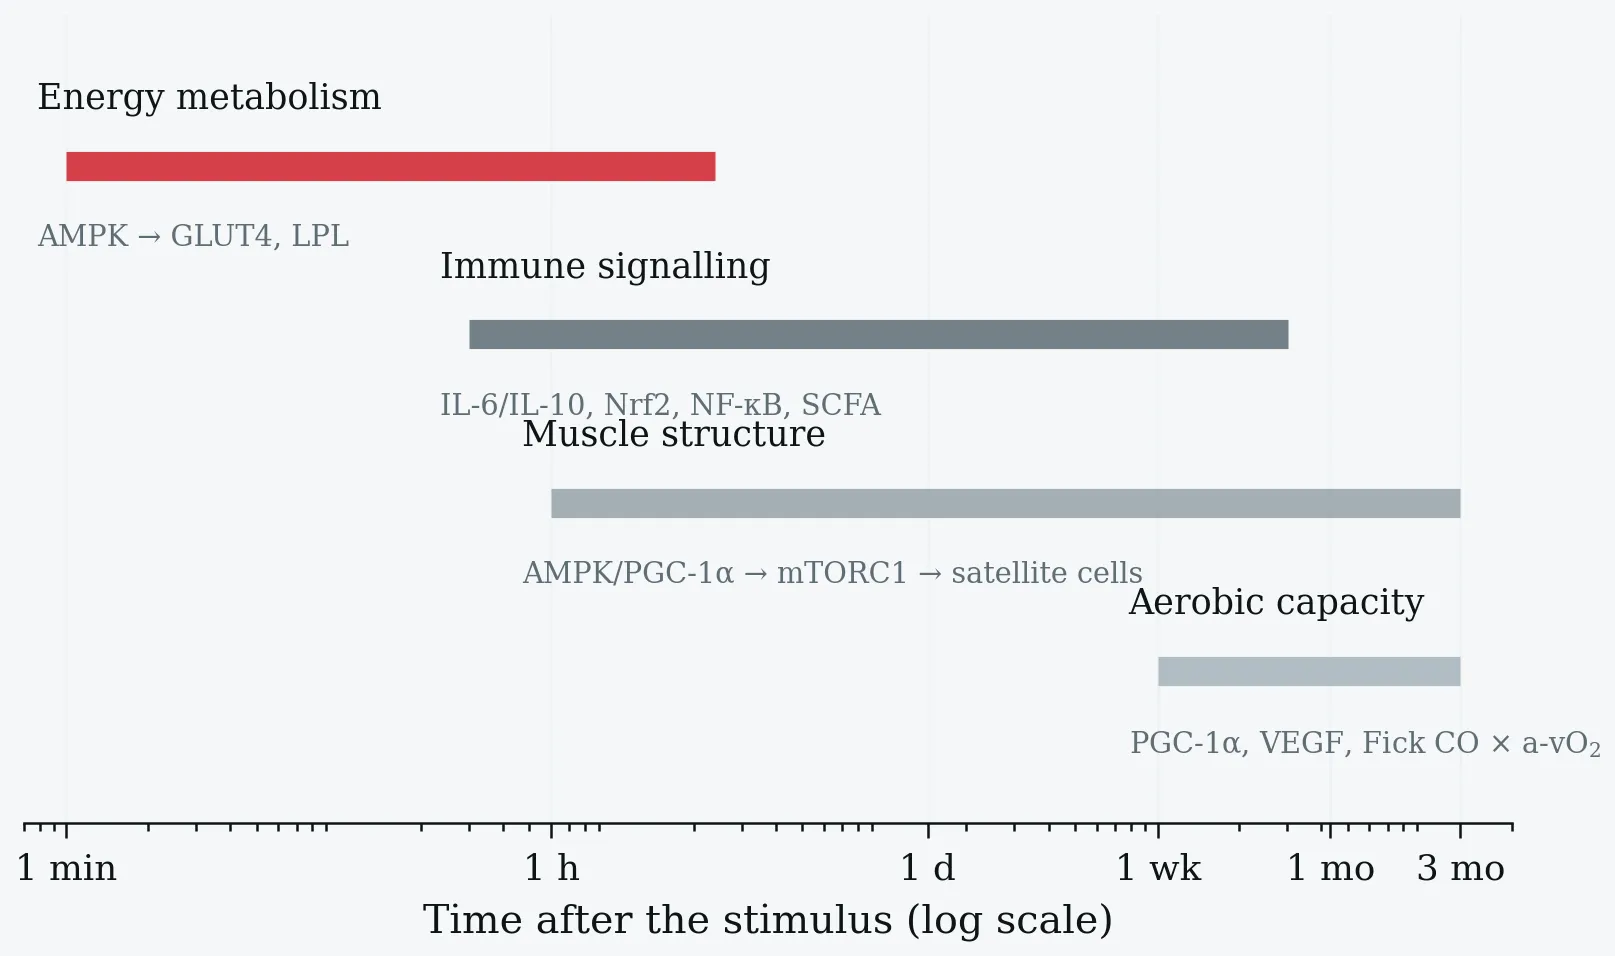
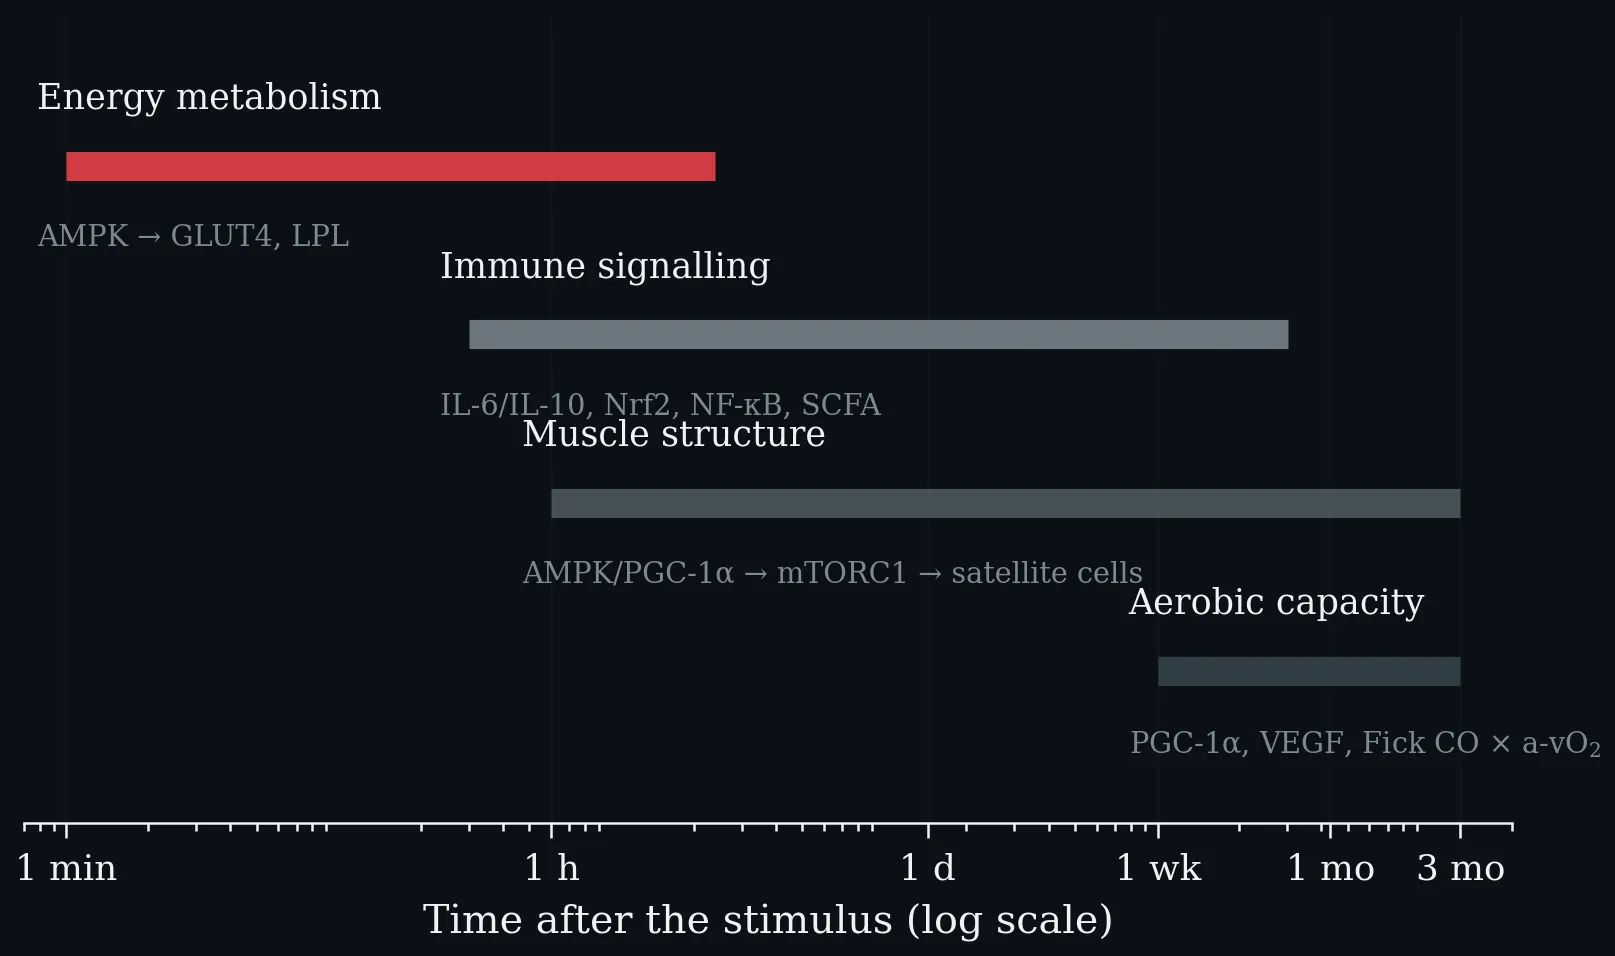
The four domains on a shared logarithmic time axis, from the stimulus to the adaptation. Energy metabolism responds within minutes to hours, immune signalling over hours to weeks, muscle structure over hours to months, and aerobic capacity only after weeks — which is why a single snack is measurable in glucose but not in V̇O₂max. Central mediators are named below each bar.
Backbone 1: Essential Components of the Immune System - Innate and Adaptive Immunity and the Chronological Immune Response to Viral Infections
Phases of the Immune Response -- Gantt-Style Timeline Chart. The innate immune response (black) is initiated within minutes; the adaptive response (dark grey) develops over days to weeks; immunological memory (medium grey, dotted) can persist lifelong. Onset dots mark the beginning of each phase. Adapted from Murphy K & Weaver C (2016). Janeway's Immunobiology, 9th edn.
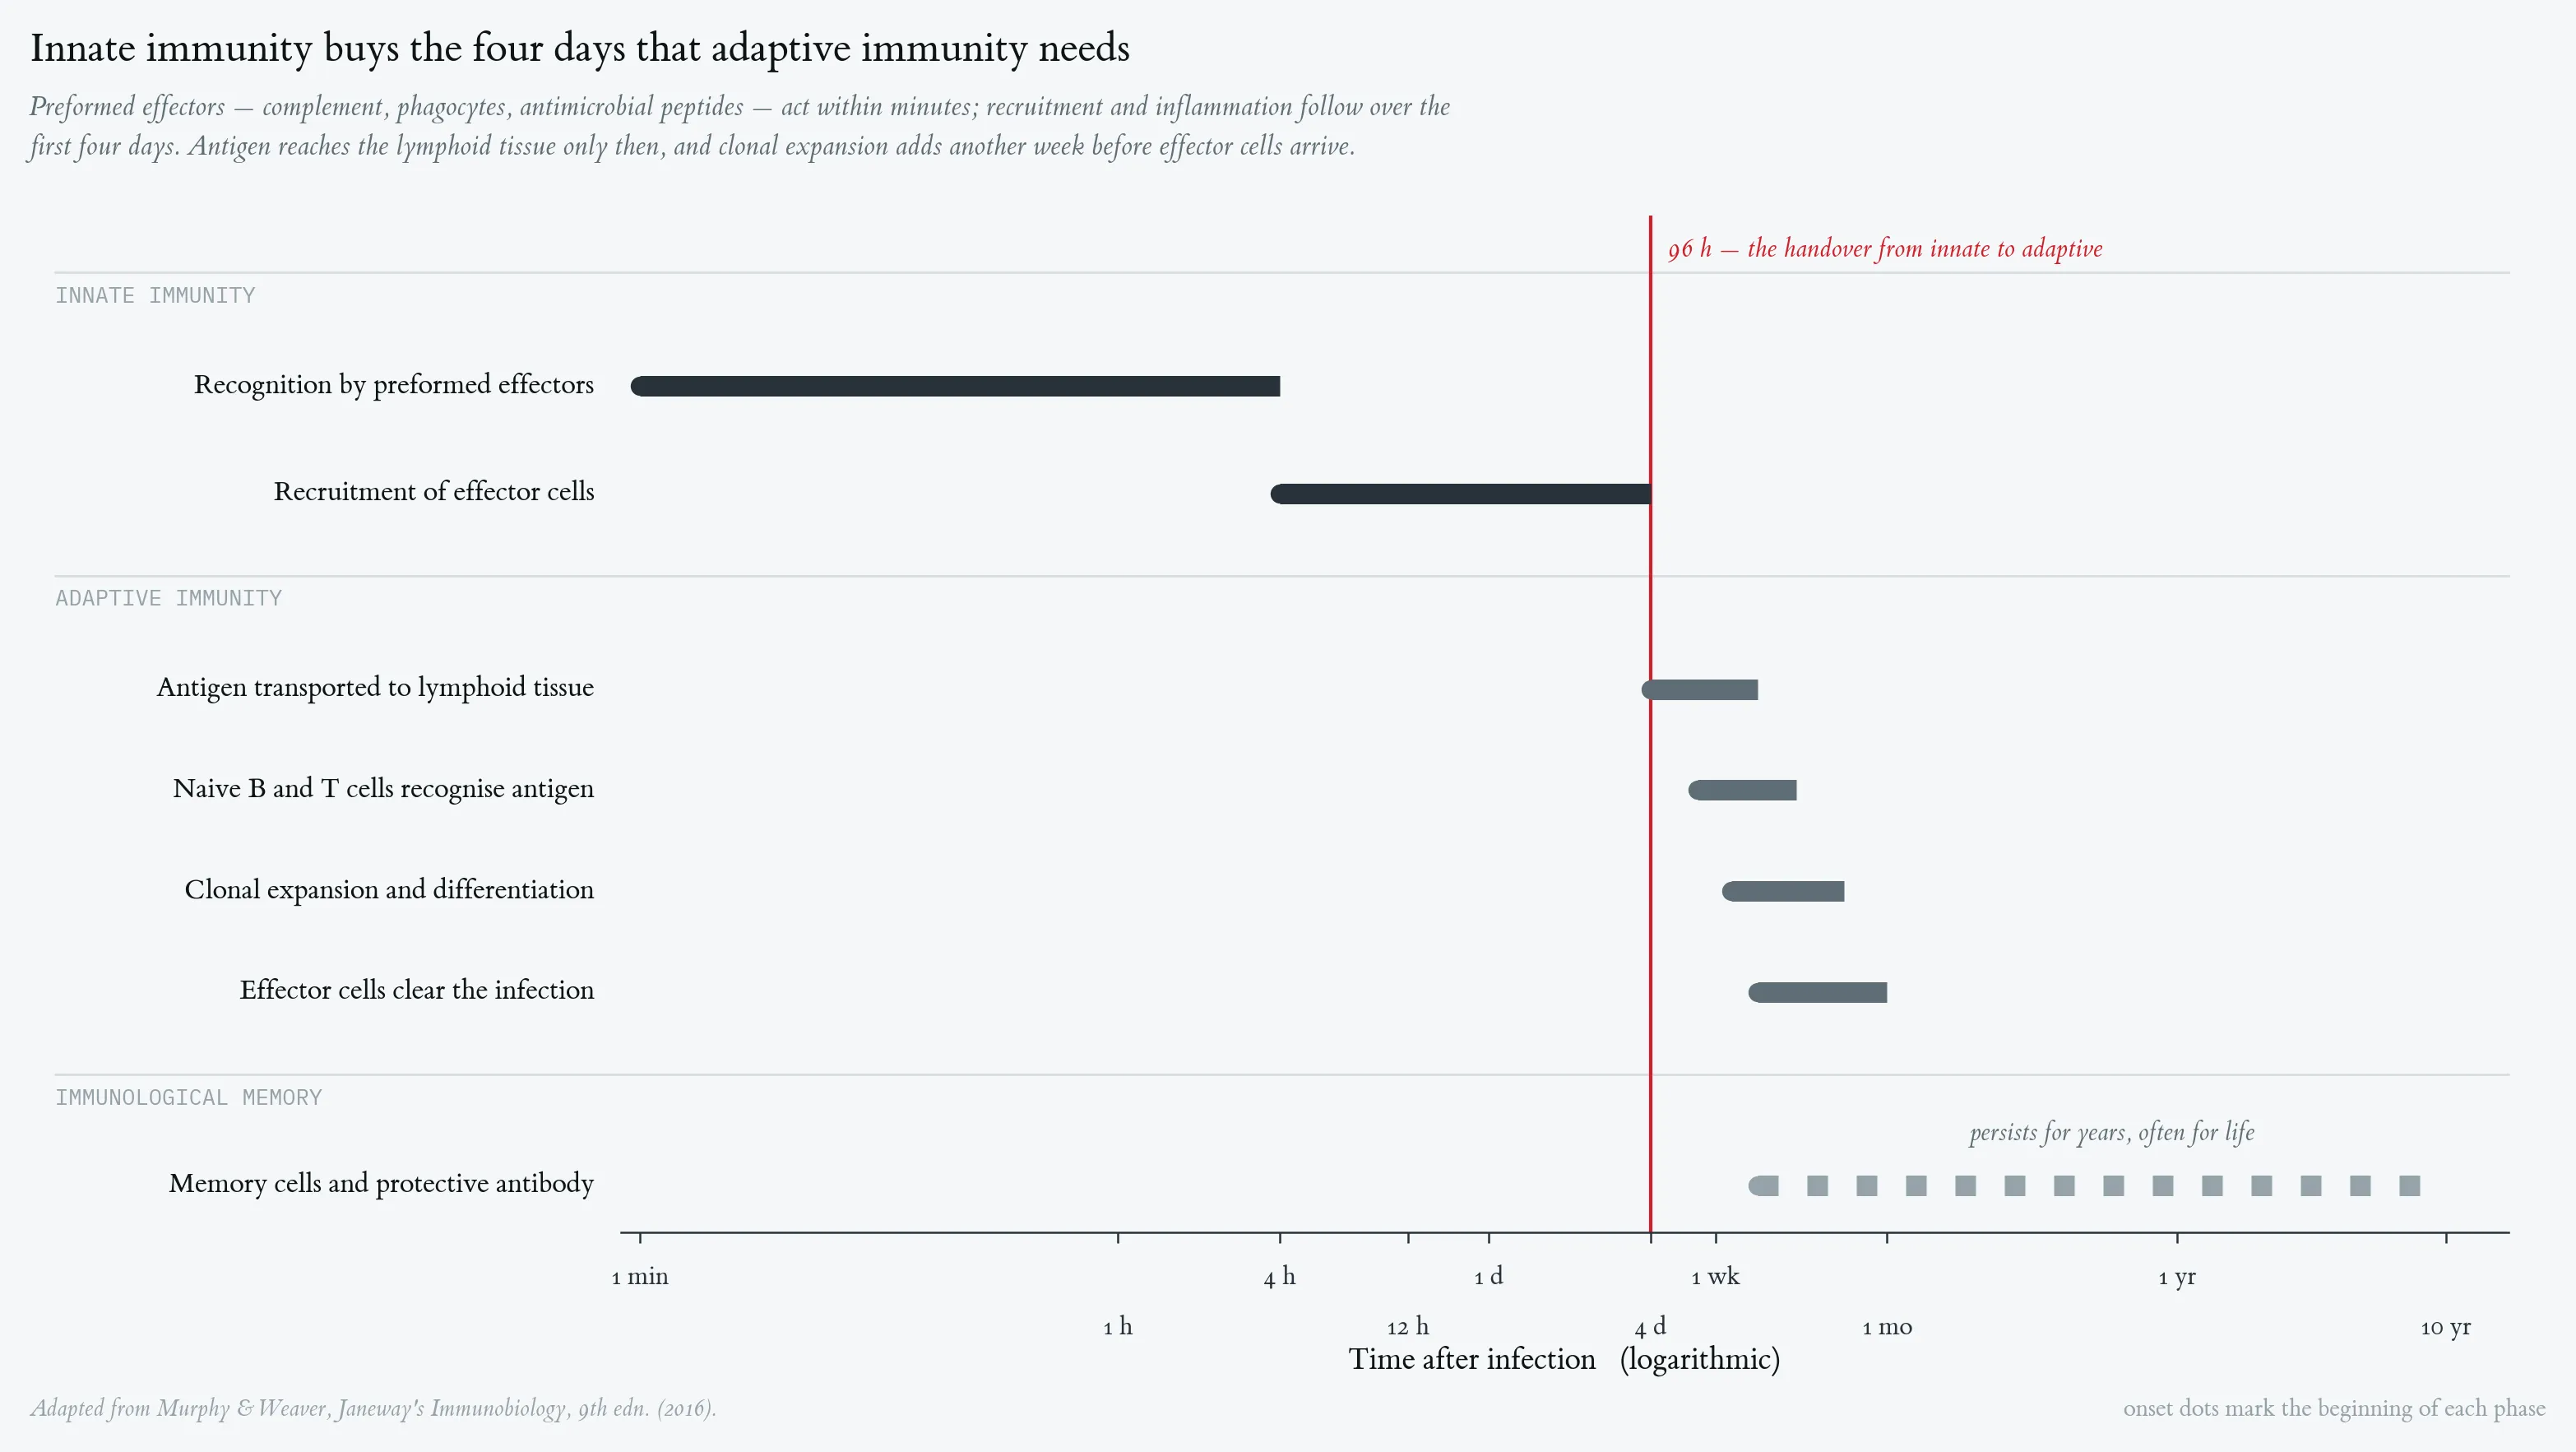
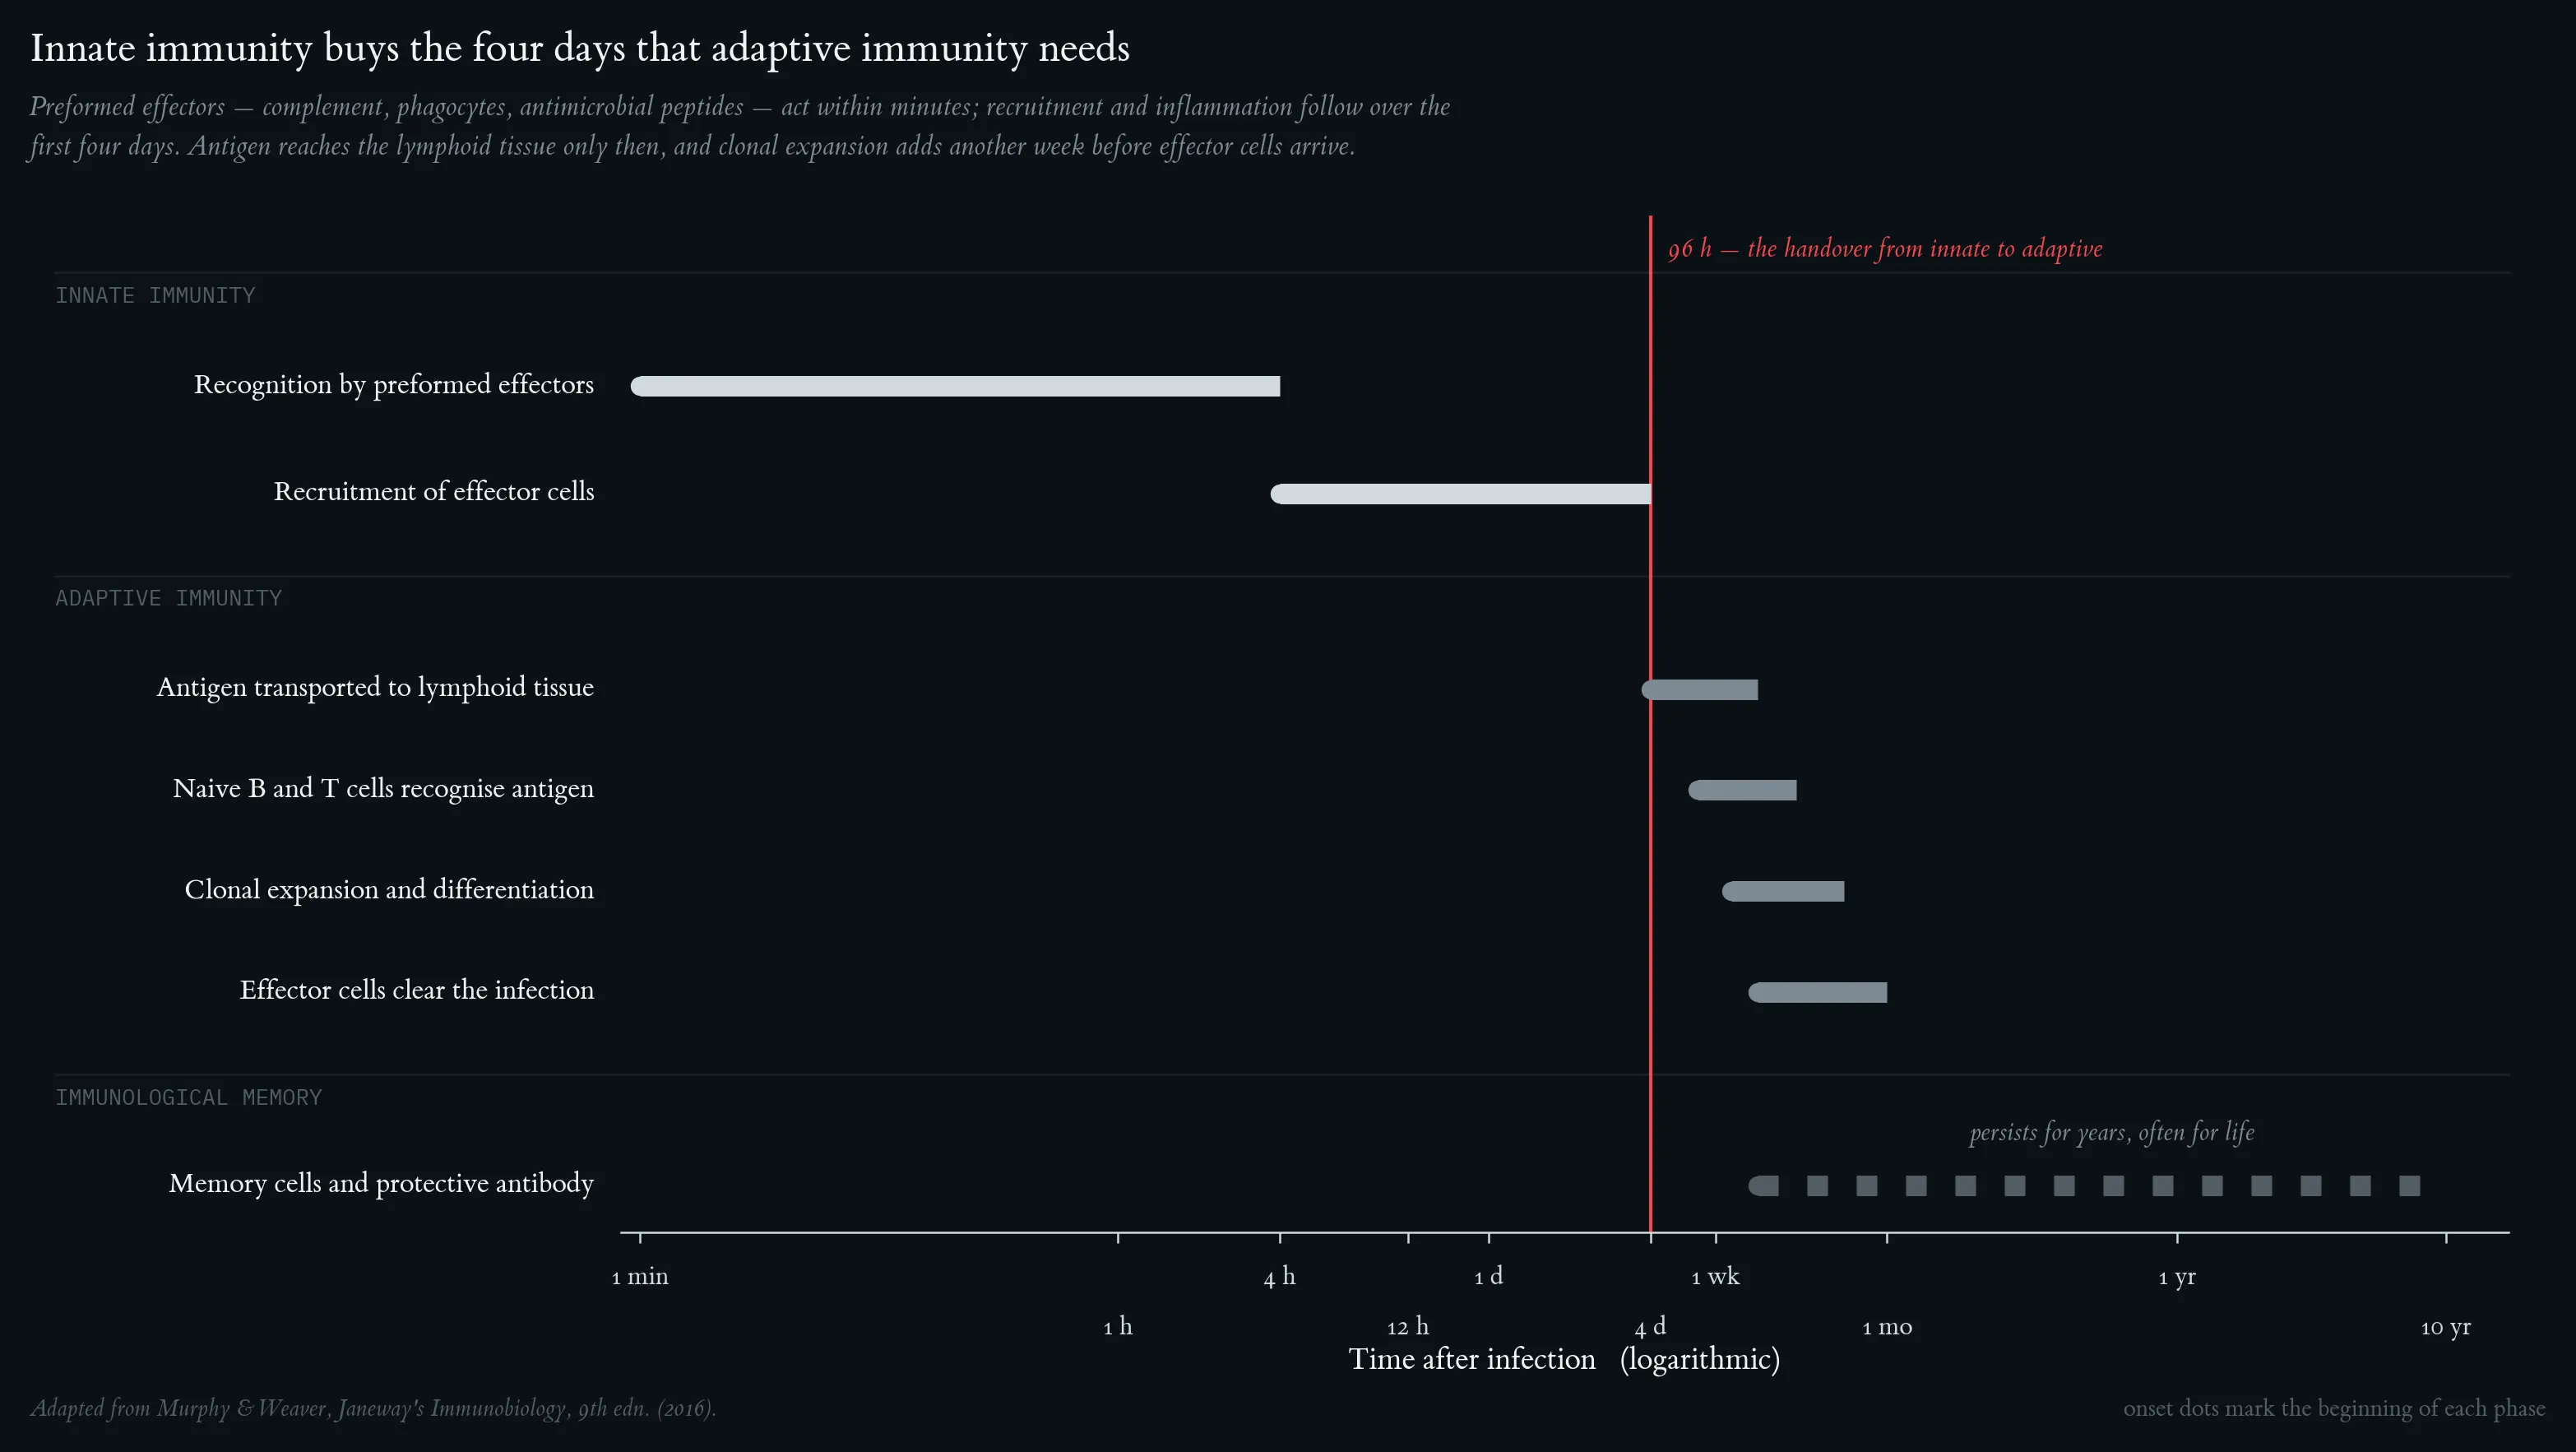
Phases of the Immune Response -- Gantt-Style Timeline Chart. The innate immune response (black) is initiated within minutes; the adaptive response (dark grey) develops over days to weeks; immunological memory (medium grey, dotted) can persist lifelong. Onset dots mark the beginning of each phase. Adapted from Murphy K & Weaver C (2016). Janeway's Immunobiology, 9th edn.
Dendritic cells initiate adaptive immune responses. Immature dendritic cells in peripheral tissue take up pathogens via macropinocytosis and receptor-mediated endocytosis, then migrate to regional lymph nodes where they mature and activate naive T cells via antigen presentation and co-stimulatory molecules. Adapted from Murphy K & Weaver C (2016). Janeway's Immunobiology, 9th edn.
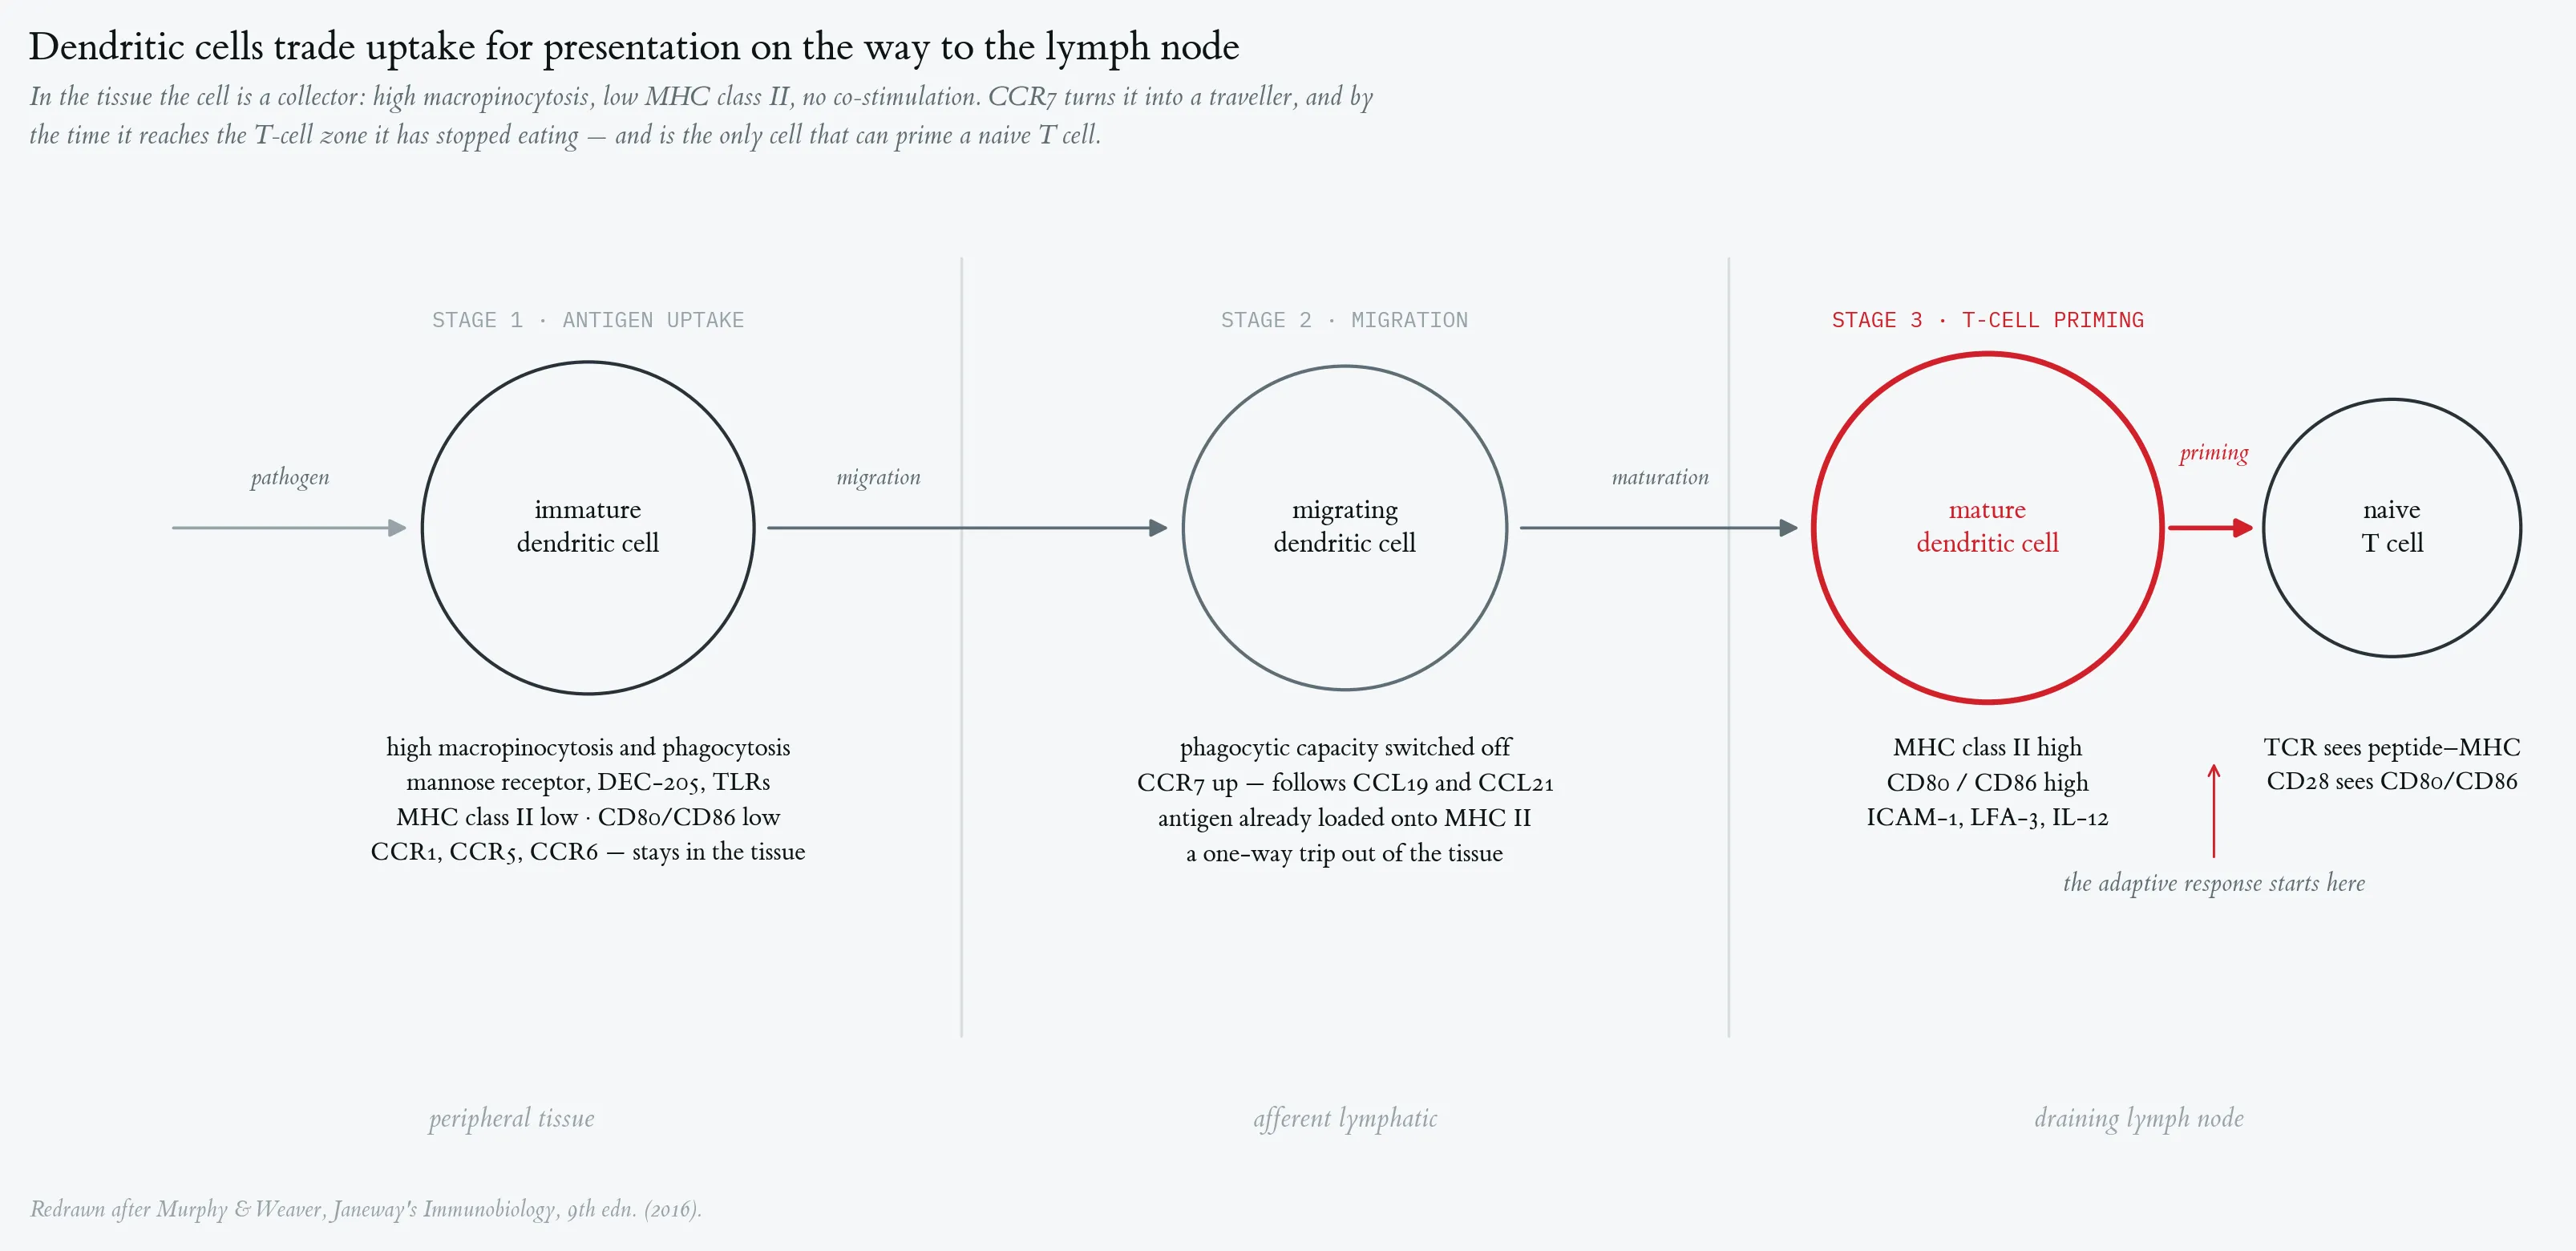
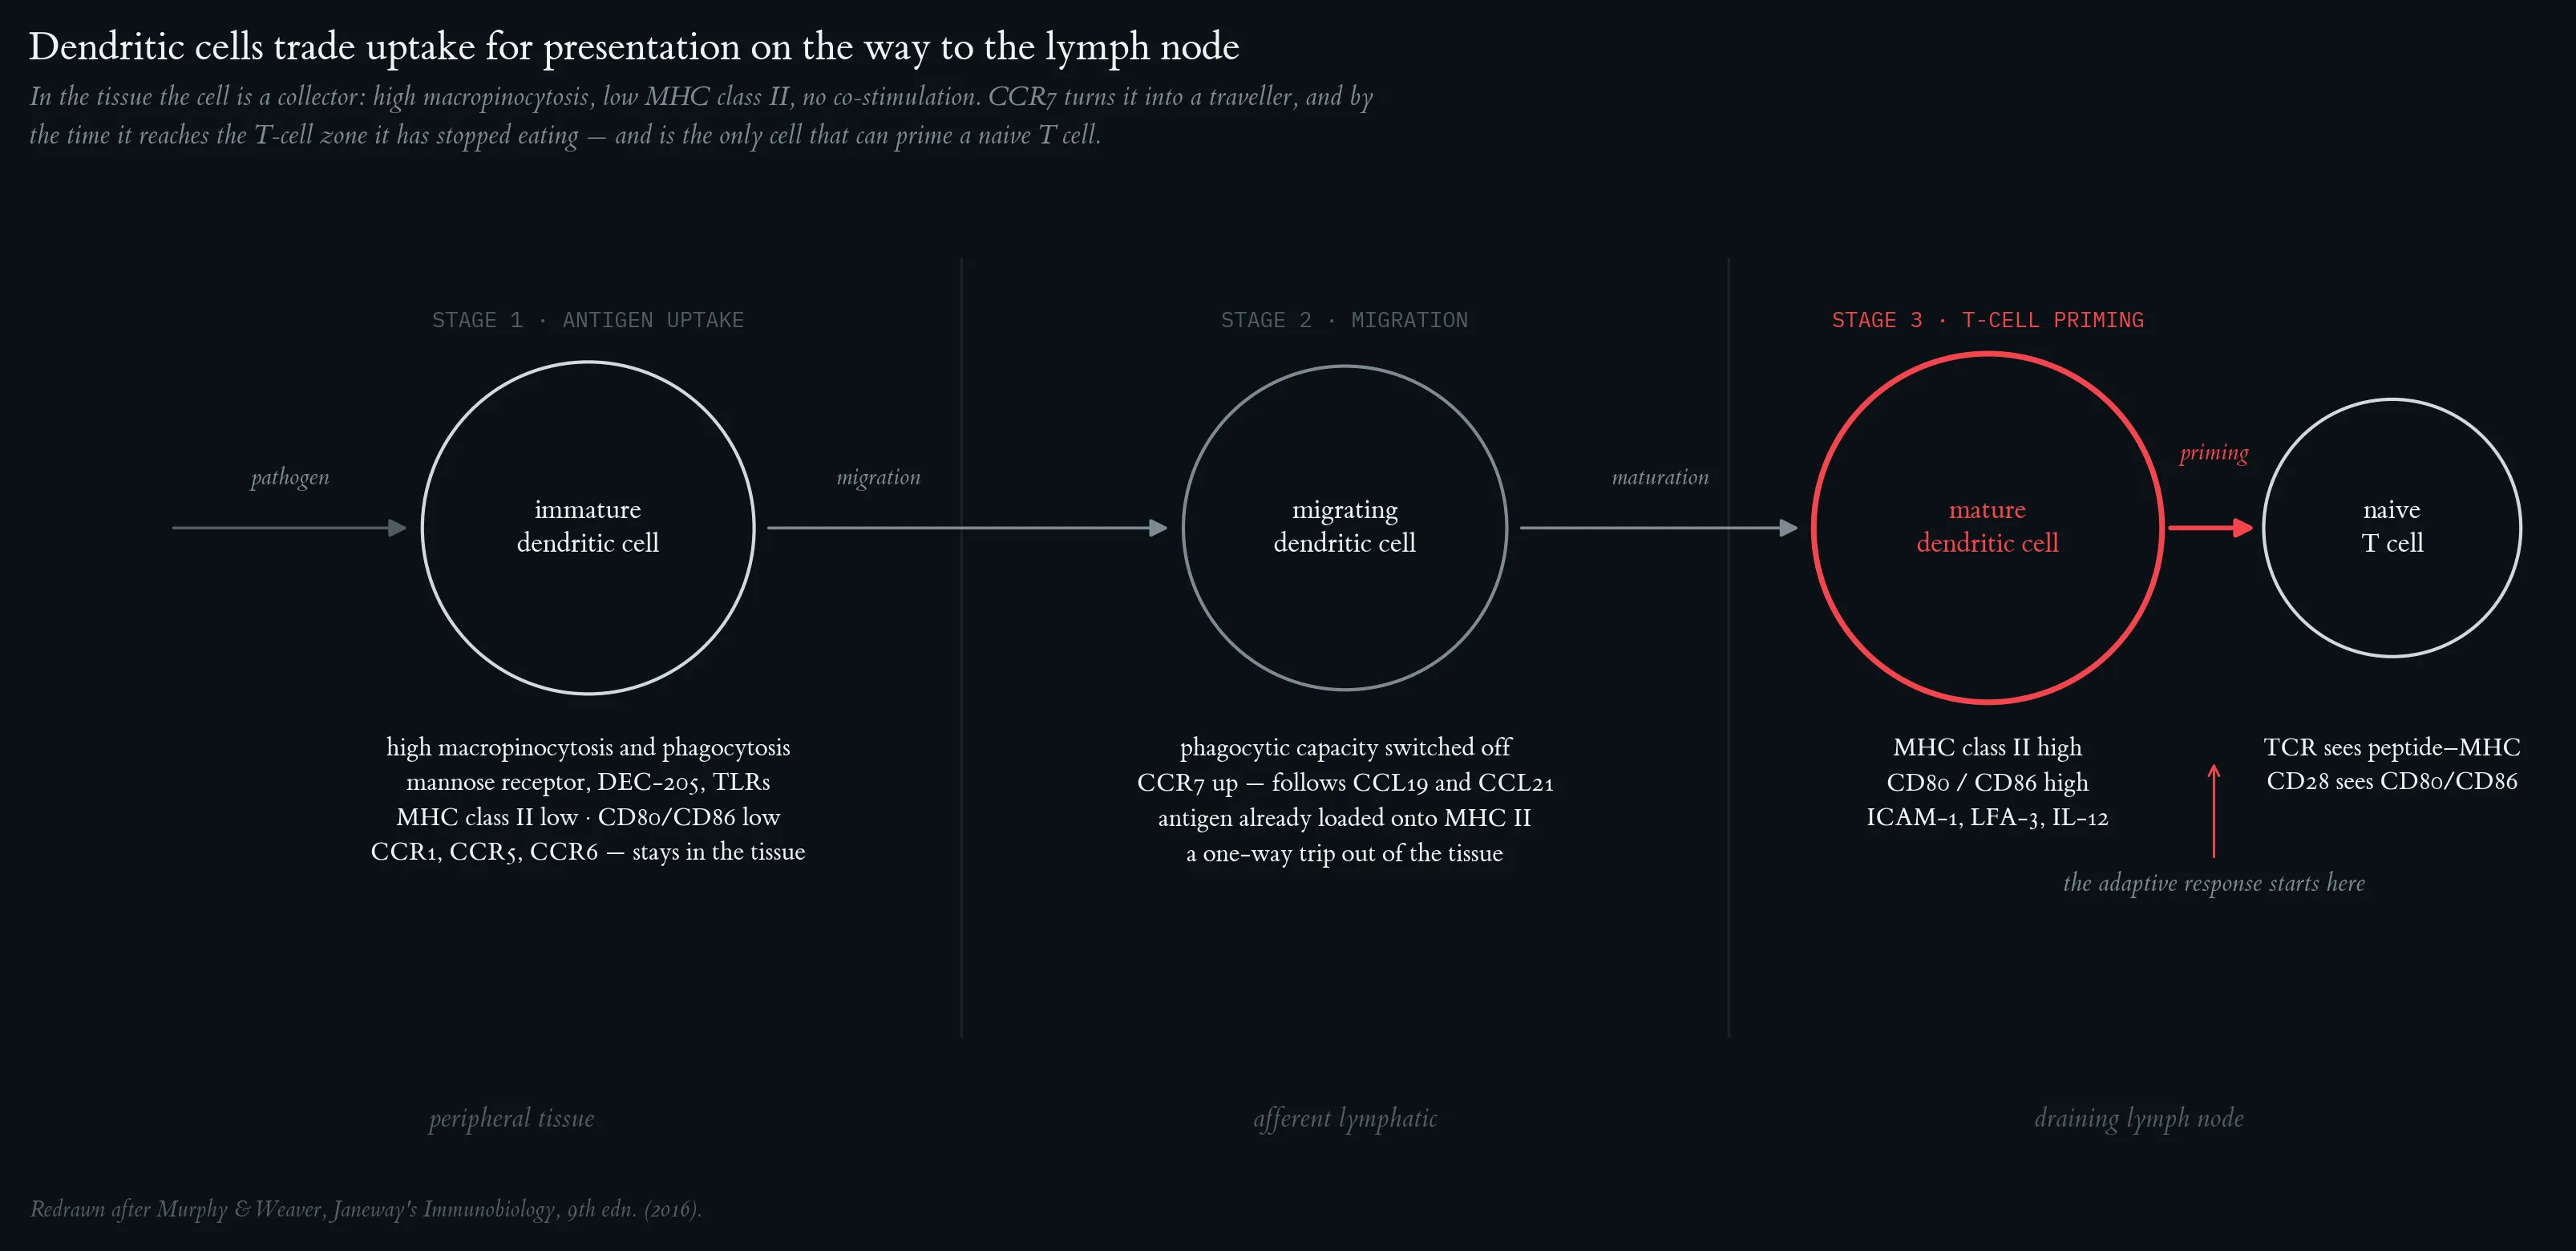
Dendritic cells initiate adaptive immune responses. Immature dendritic cells in peripheral tissue take up pathogens via macropinocytosis and receptor-mediated endocytosis, then migrate to regional lymph nodes where they mature and activate naive T cells via antigen presentation and co-stimulatory molecules. Adapted from Murphy K & Weaver C (2016). Janeway's Immunobiology, 9th edn.
NK cells are an early component of the host response to virus infection. IFN-α/IFN-β and cytokines (black, solid) are produced first, followed by NK-cell killing (dark grey, dashed); T-cell killing (medium grey, dotted) peaks later as the adaptive response matures. Virus titer (light grey, dash-dot) rises then falls once adaptive immunity is established. Adapted from Murphy K & Weaver C (2016). Janeway's Immunobiology, 9th edn.
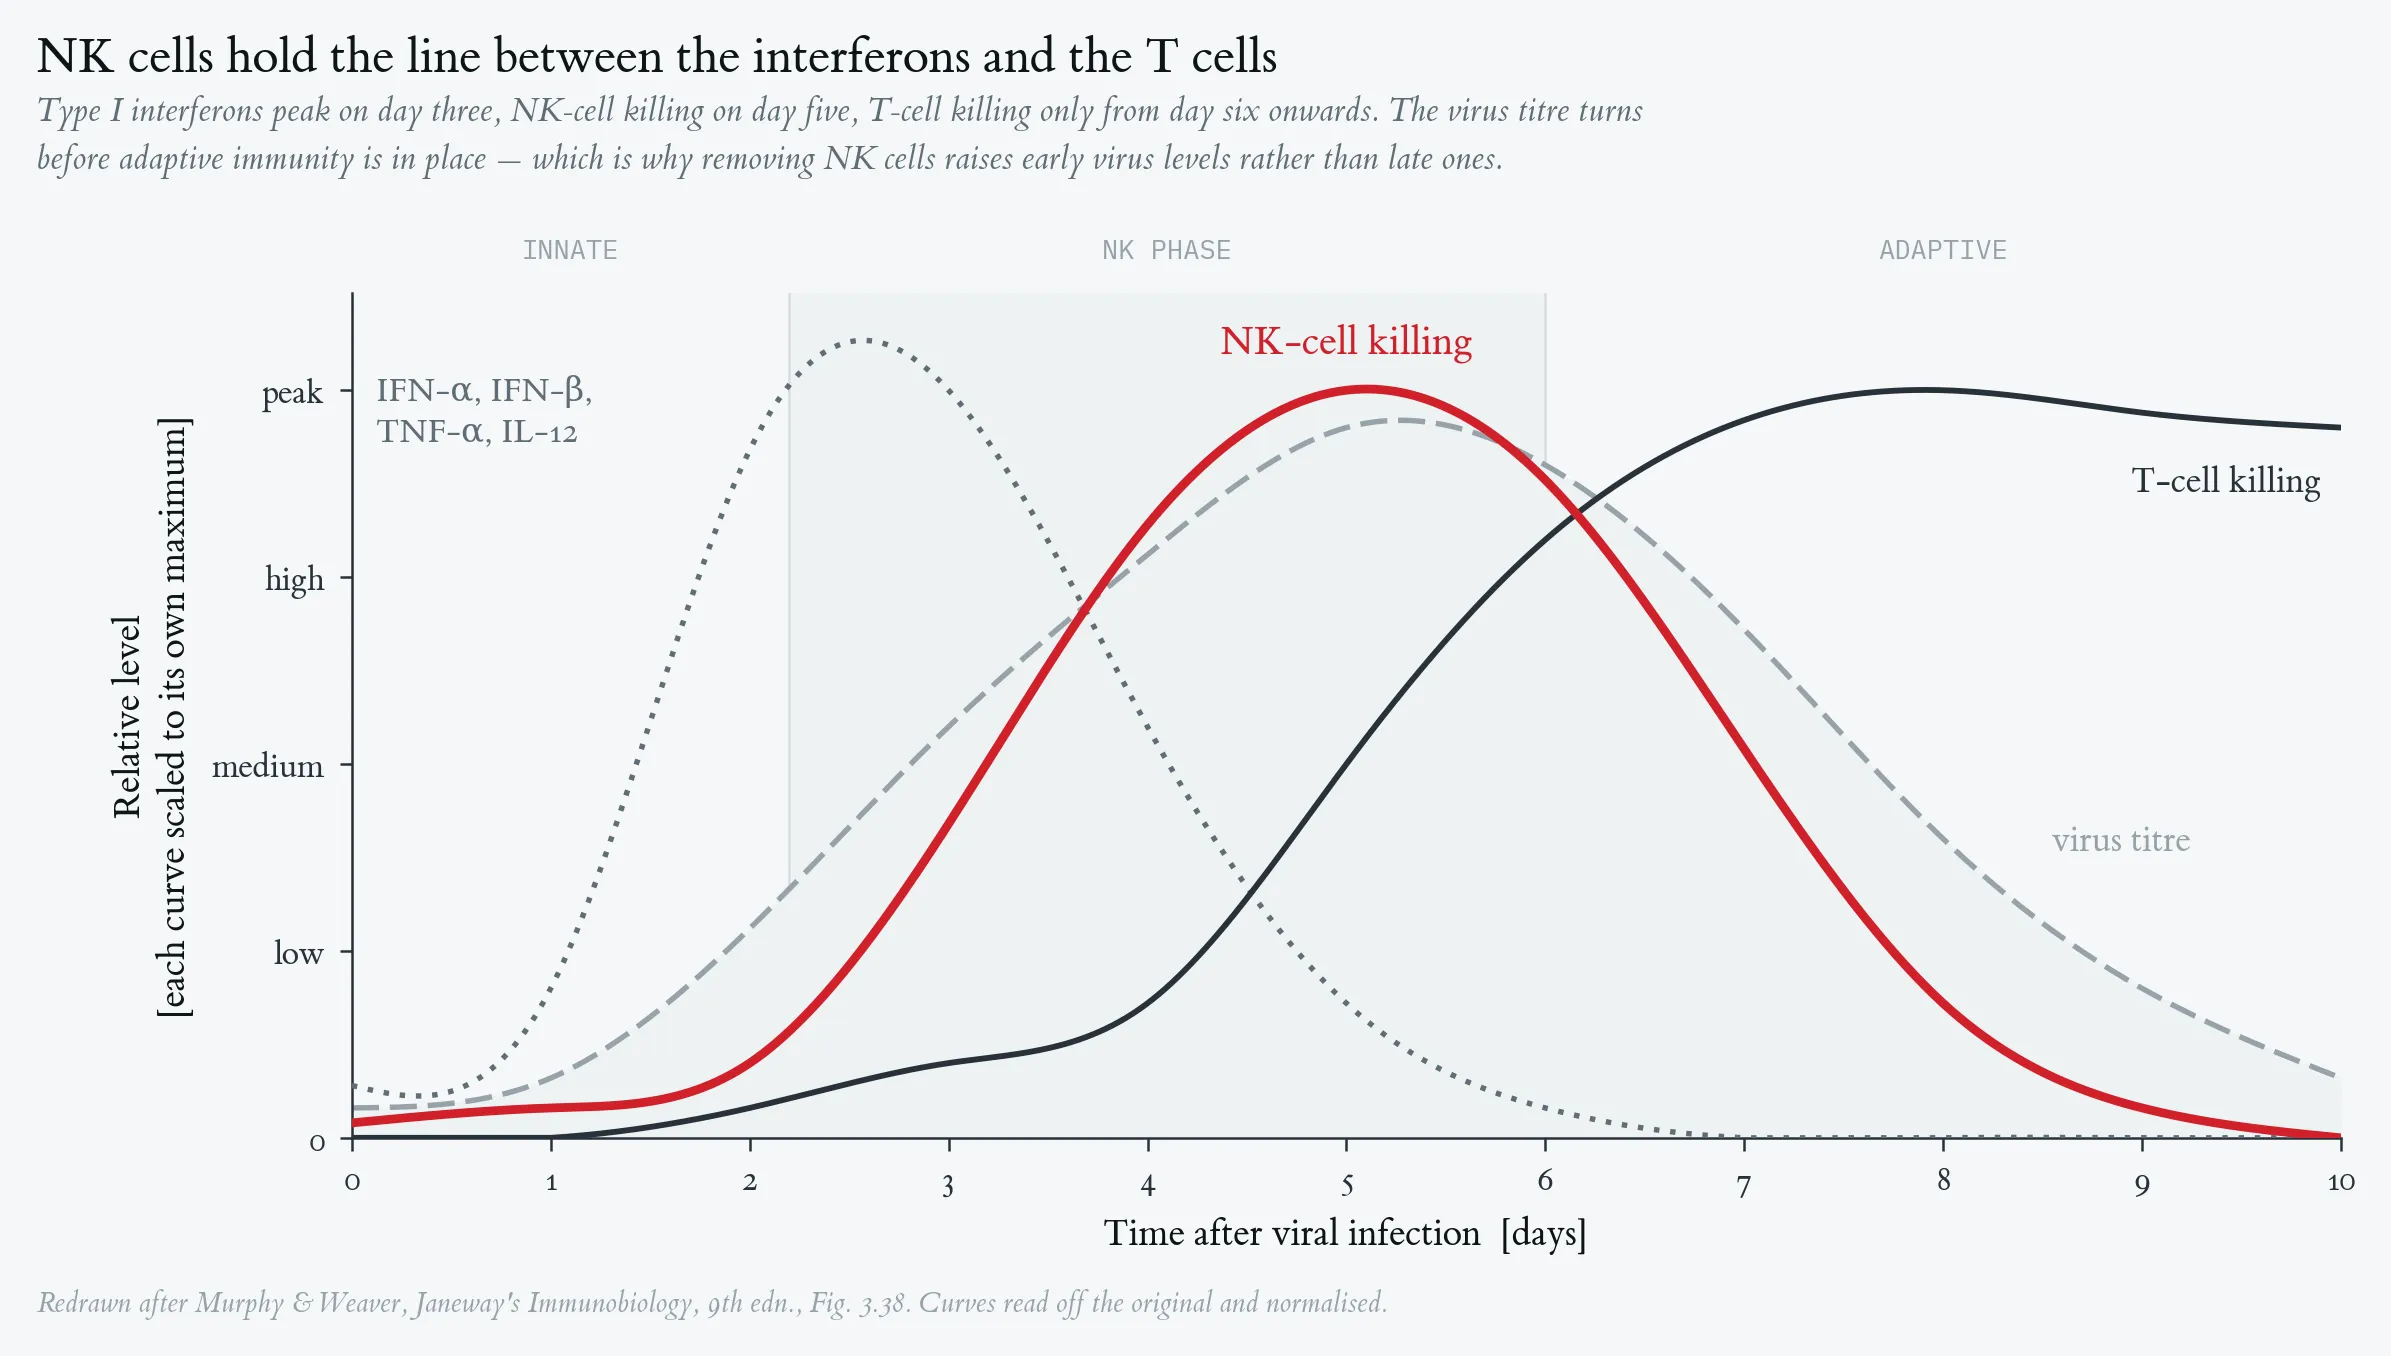
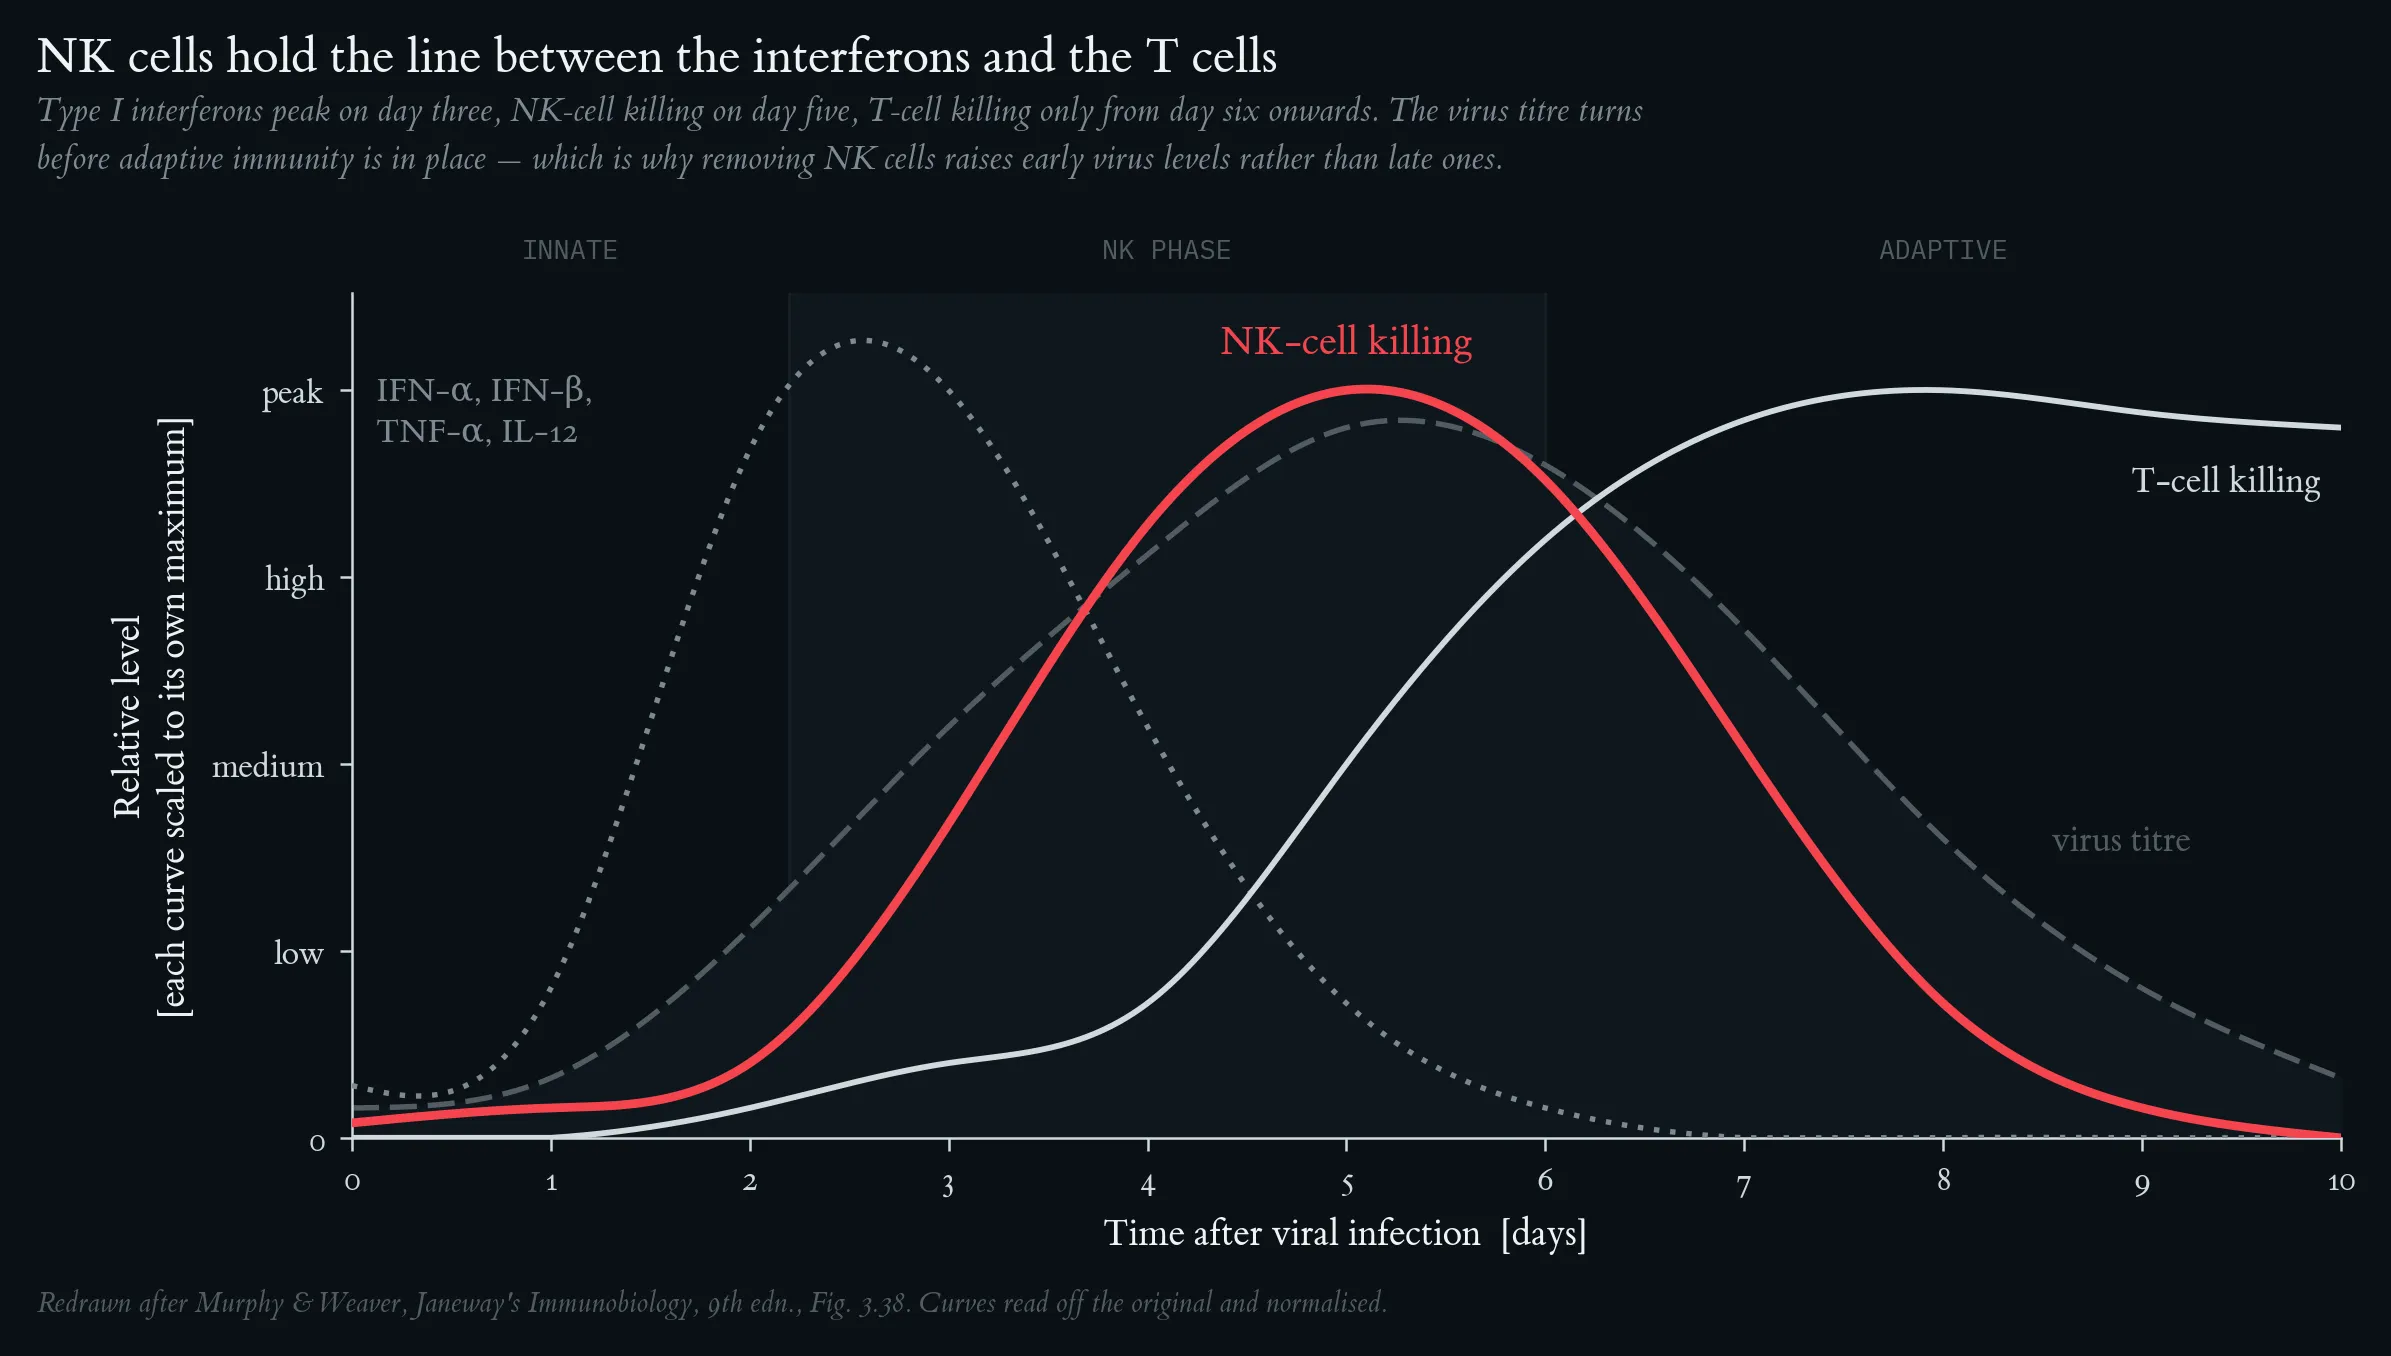
NK cells are an early component of the host response to virus infection. IFN-α/IFN-β and cytokines (black, solid) are produced first, followed by NK-cell killing (dark grey, dashed); T-cell killing (medium grey, dotted) peaks later as the adaptive response matures. Virus titer (light grey, dash-dot) rises then falls once adaptive immunity is established. Adapted from Murphy K & Weaver C (2016). Janeway's Immunobiology, 9th edn.
Backbone 2: Teaching Anaerobic Threshold
Schematic representation of the aerobic–anaerobic transition (grey zone). Top: blood-lactate curve with aerobic threshold (AeS) and individual anaerobic threshold (IAS ≙ MLSS). Bottom: pulmonary ventilation with the two ventilatory thresholds VT1 and VT2 (RCP). Redrawn after Kindermann (2004).
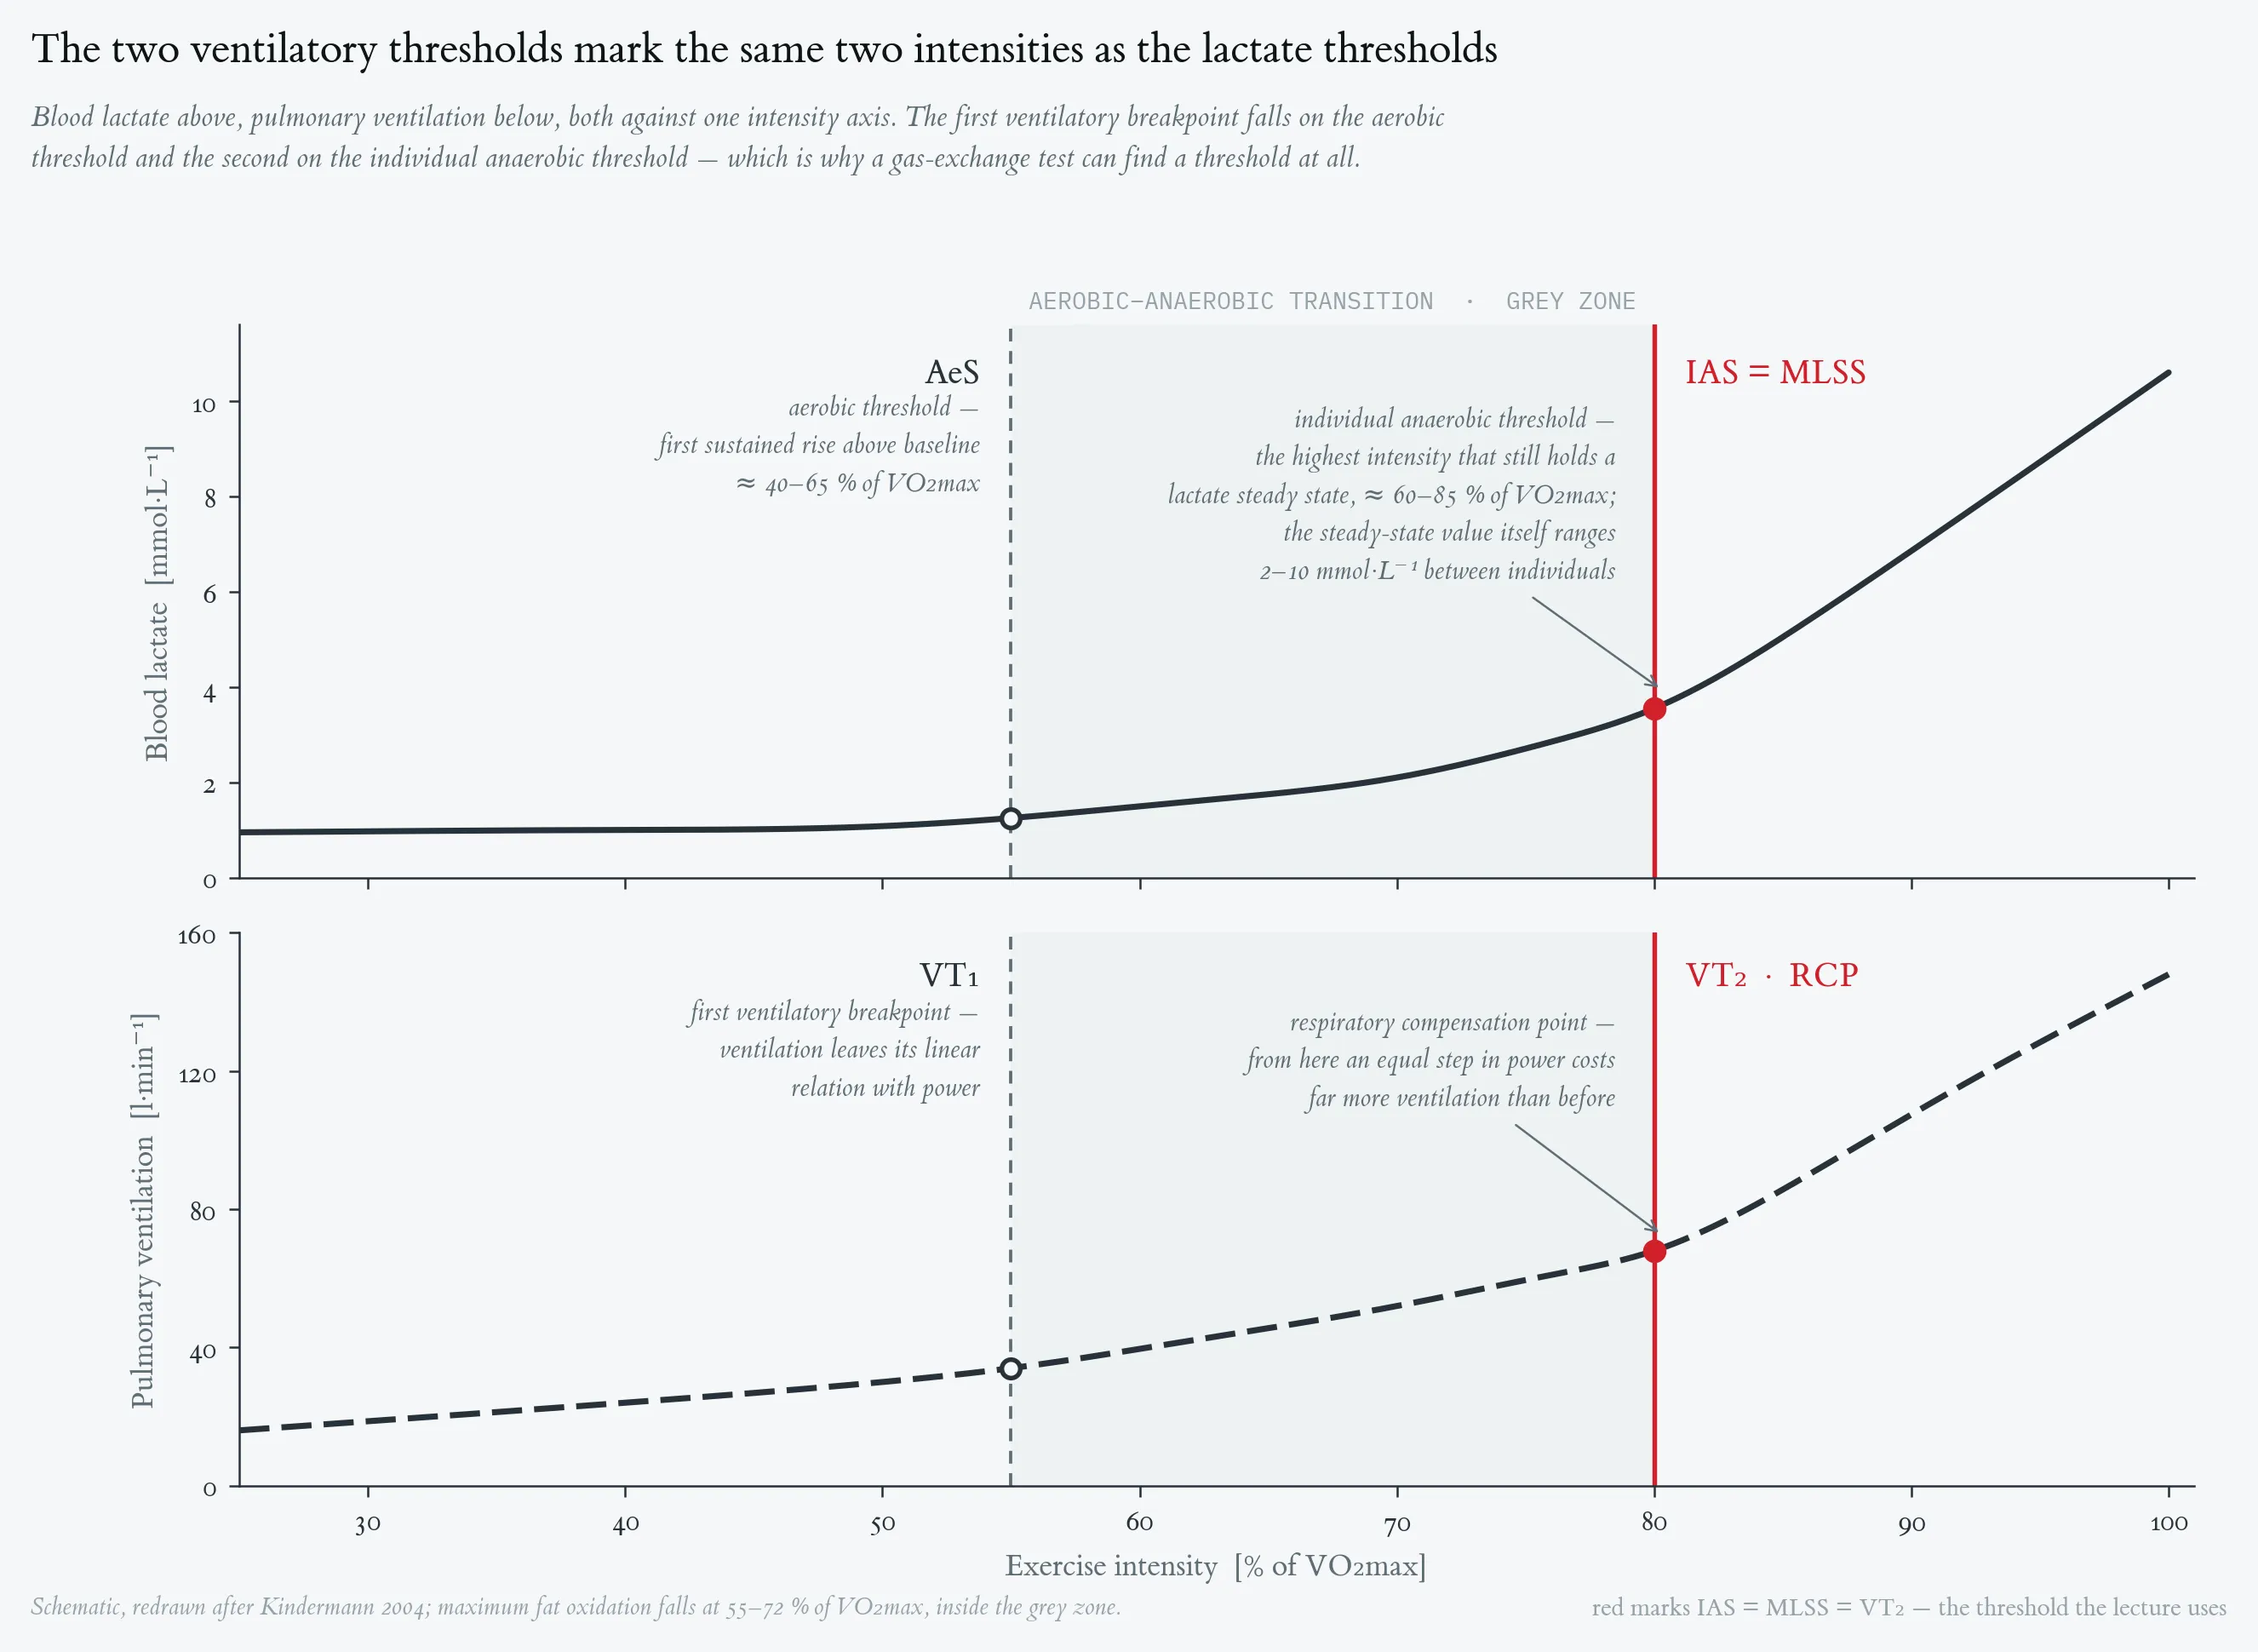
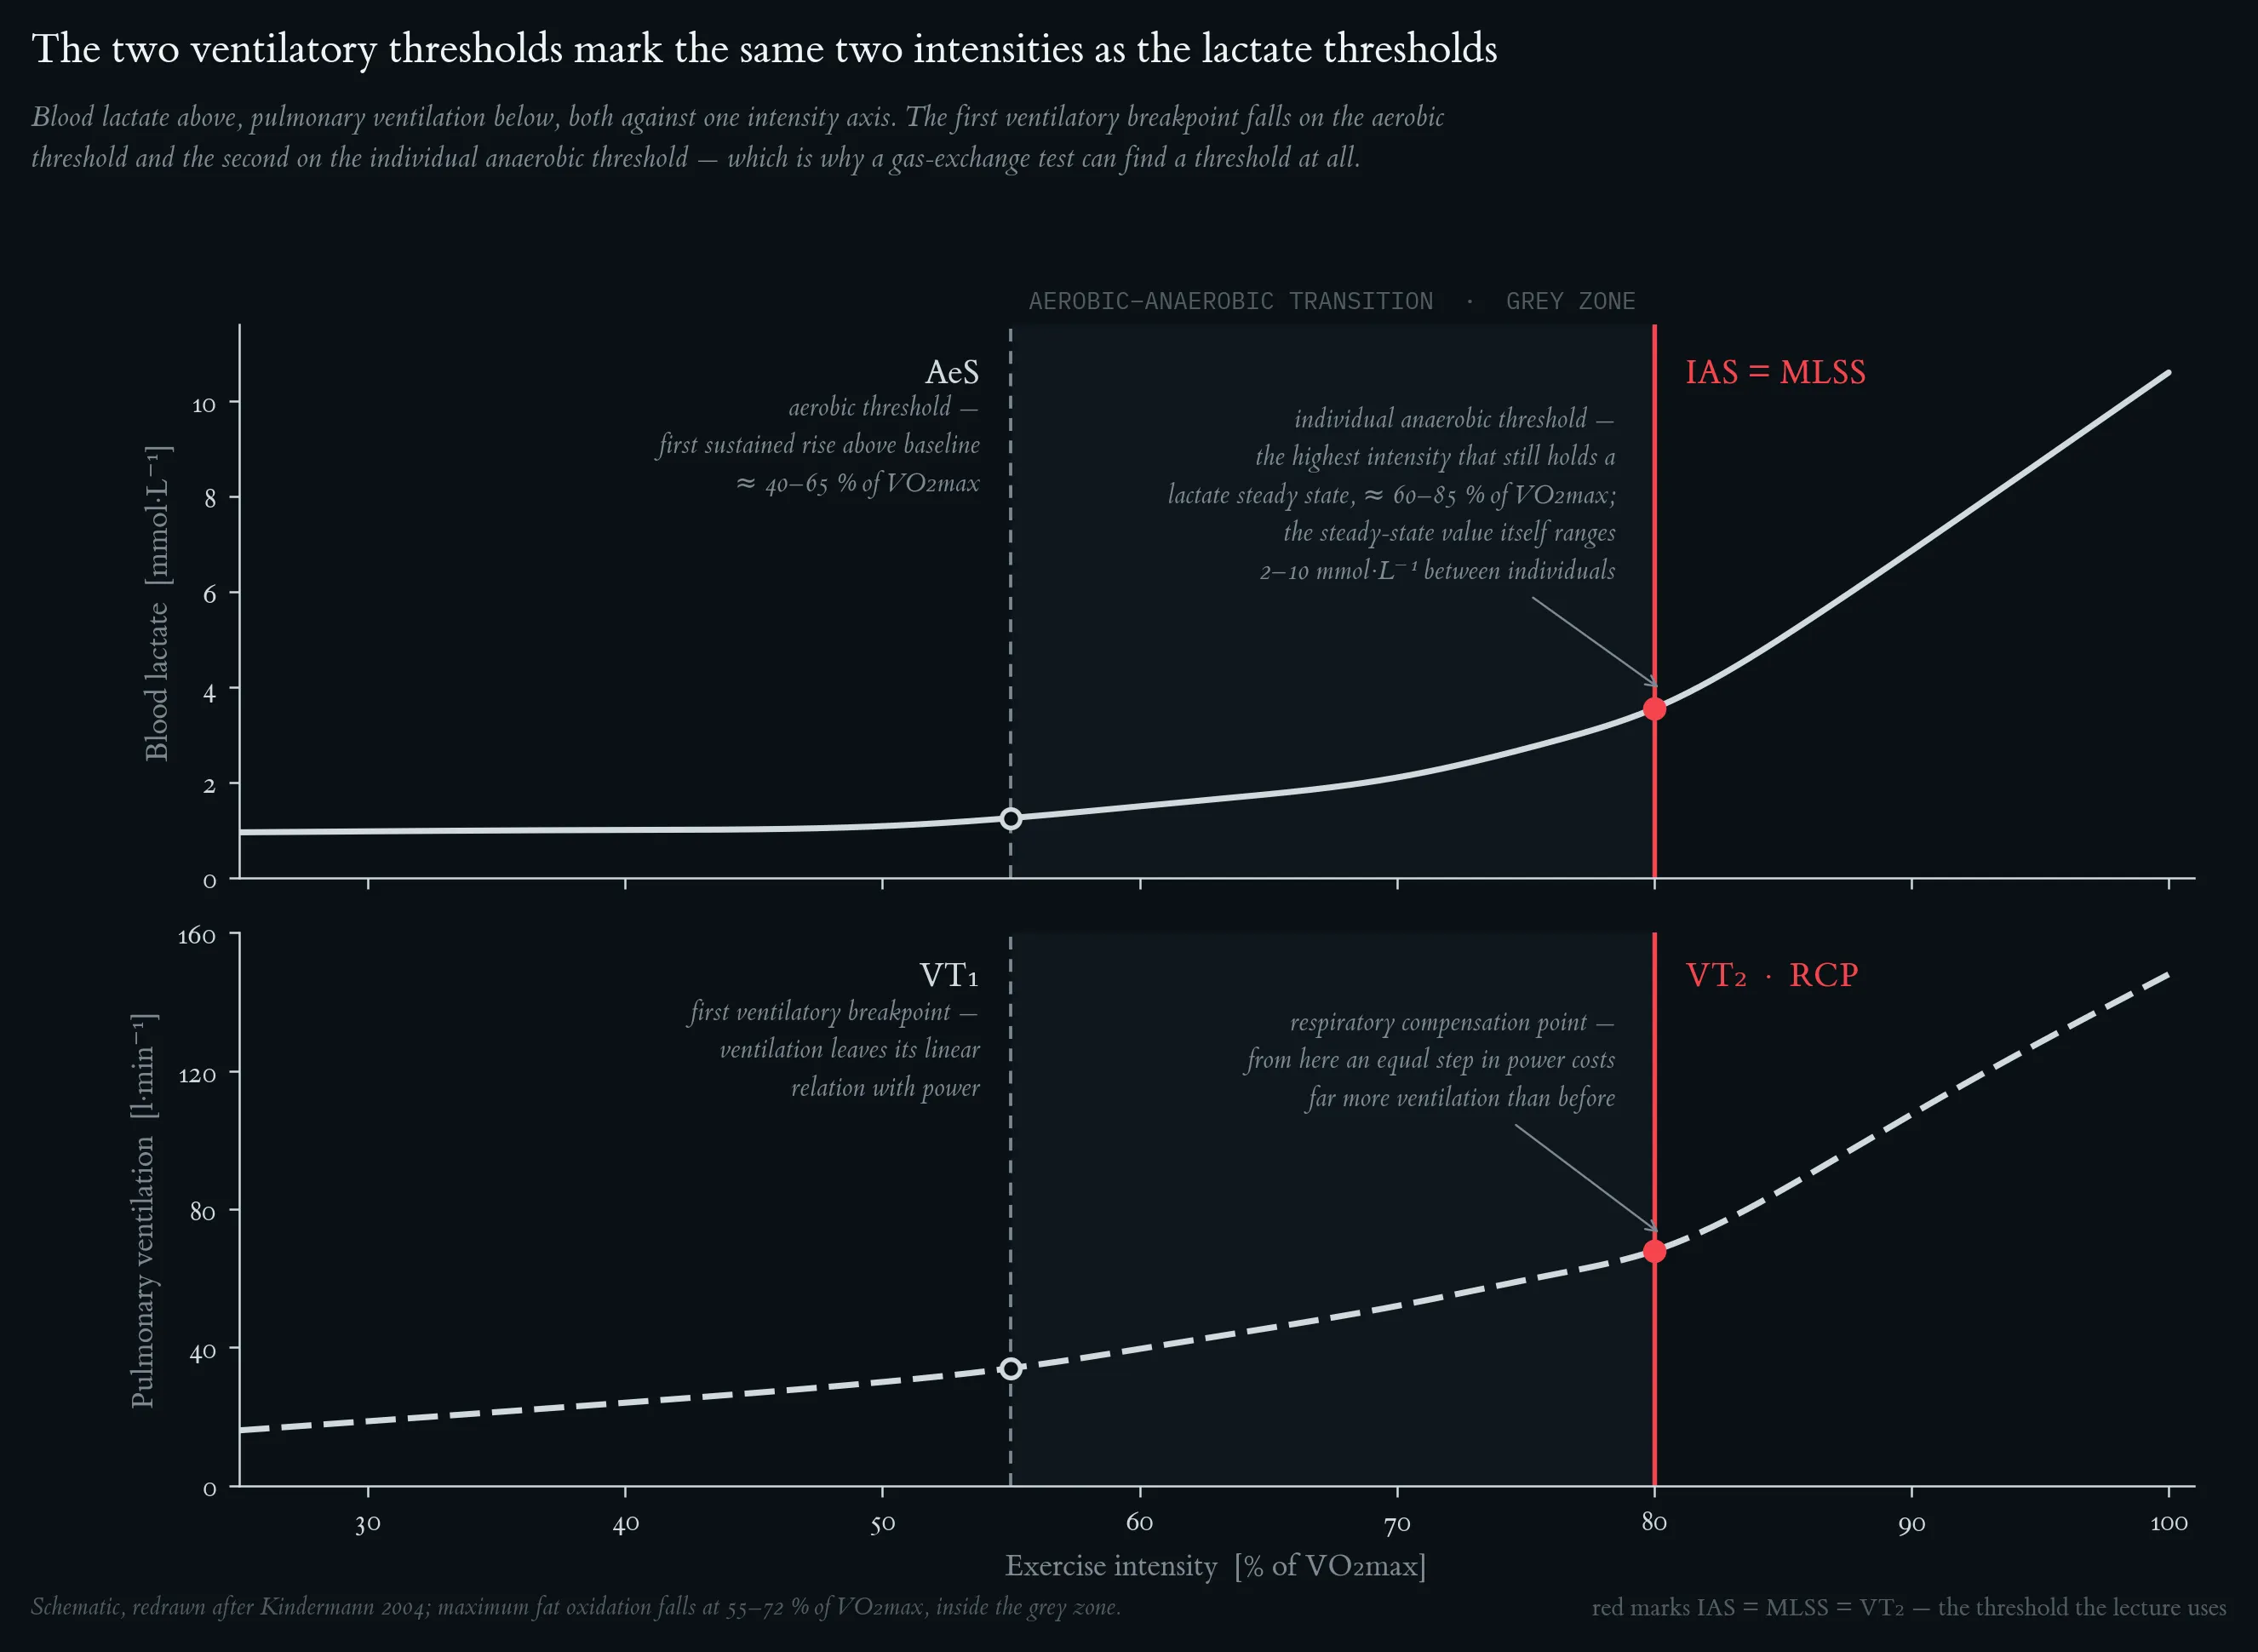
Schematic representation of the aerobic–anaerobic transition (grey zone). Top: blood-lactate curve with aerobic threshold (AeS) and individual anaerobic threshold (IAS ≙ MLSS). Bottom: pulmonary ventilation with the two ventilatory thresholds VT1 and VT2 (RCP). Redrawn after Kindermann (2004).
Lactate–velocity curve during incremental exercise (red) and lactate–time curve during recovery (blue). The dashed grey line marks L_end. The descending recovery curve crosses L_end at ≈ 2.7 min post-exercise (linear interpolation between R1 = 10.0 mmol/L at 1 min and R2 = 8.8 mmol/L at 3 min → L = 9.0 at t ≈ 2.7 min): this is the anchor. The dashed green line is the tangent from the anchor to the ascending exercise curve; the tangent contact on the exercise curve is the IAT. Vertical and horizontal projections give v_IAT and L_IAT respectively.
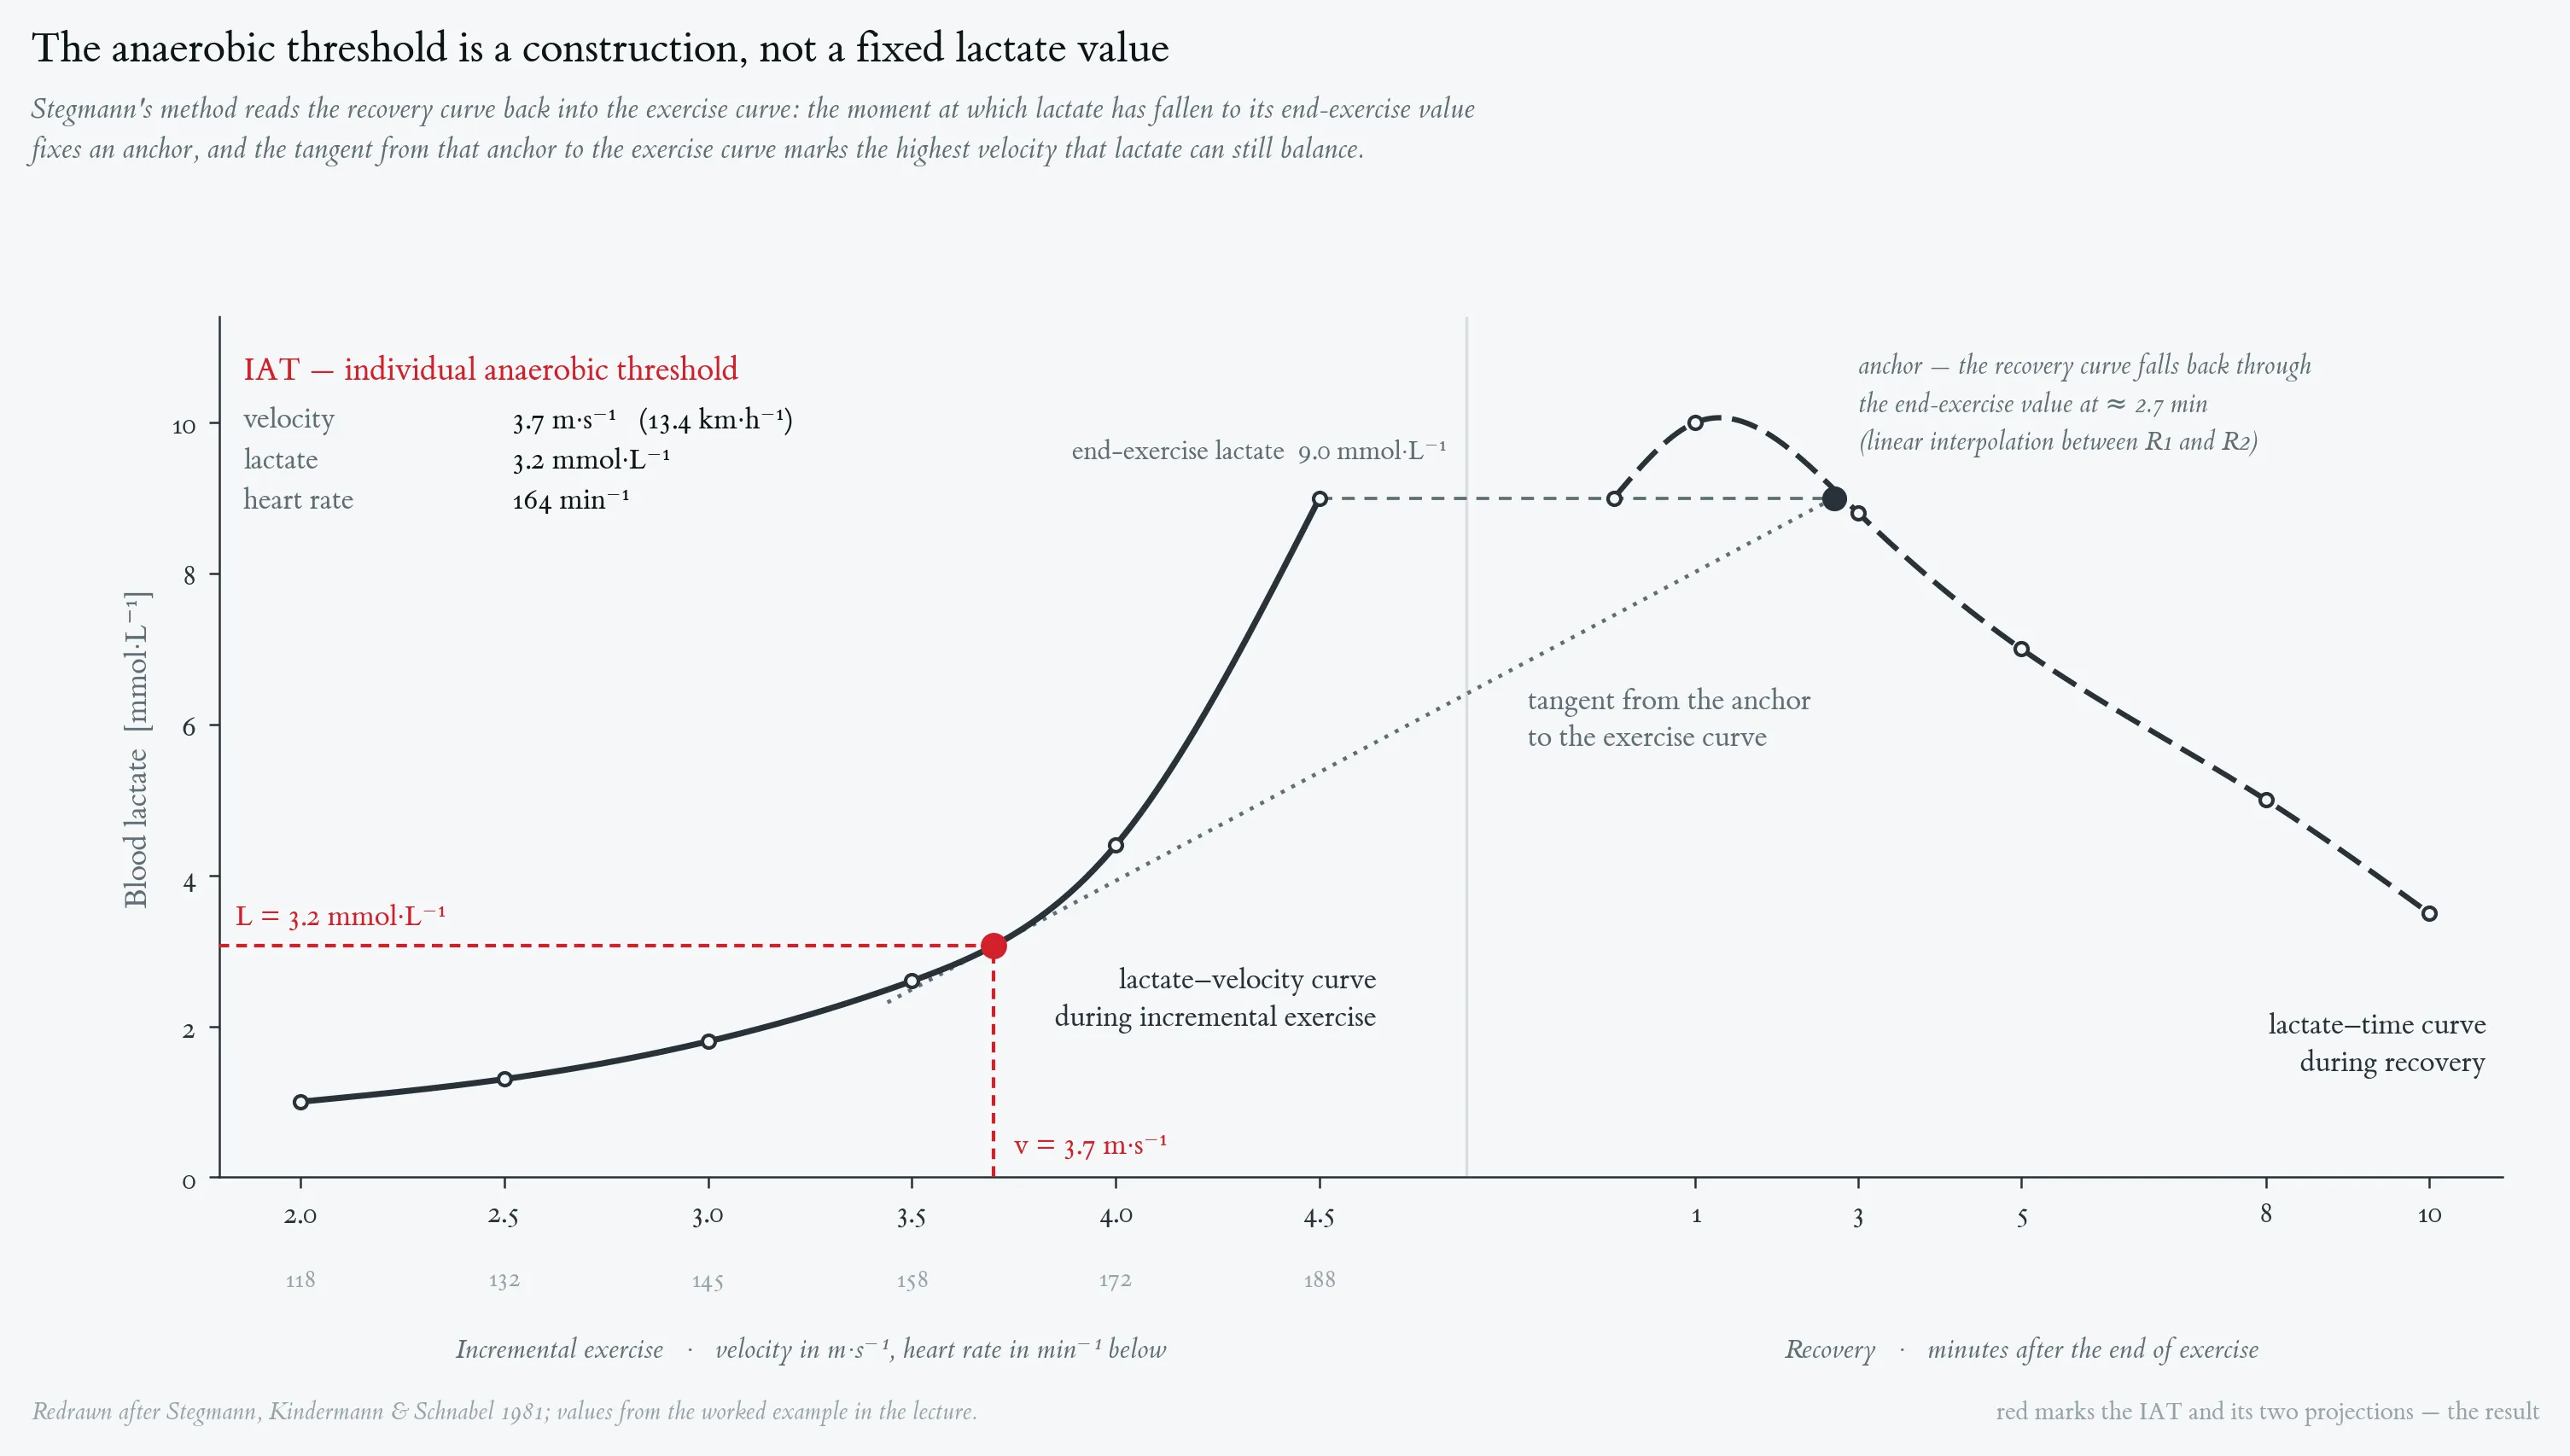
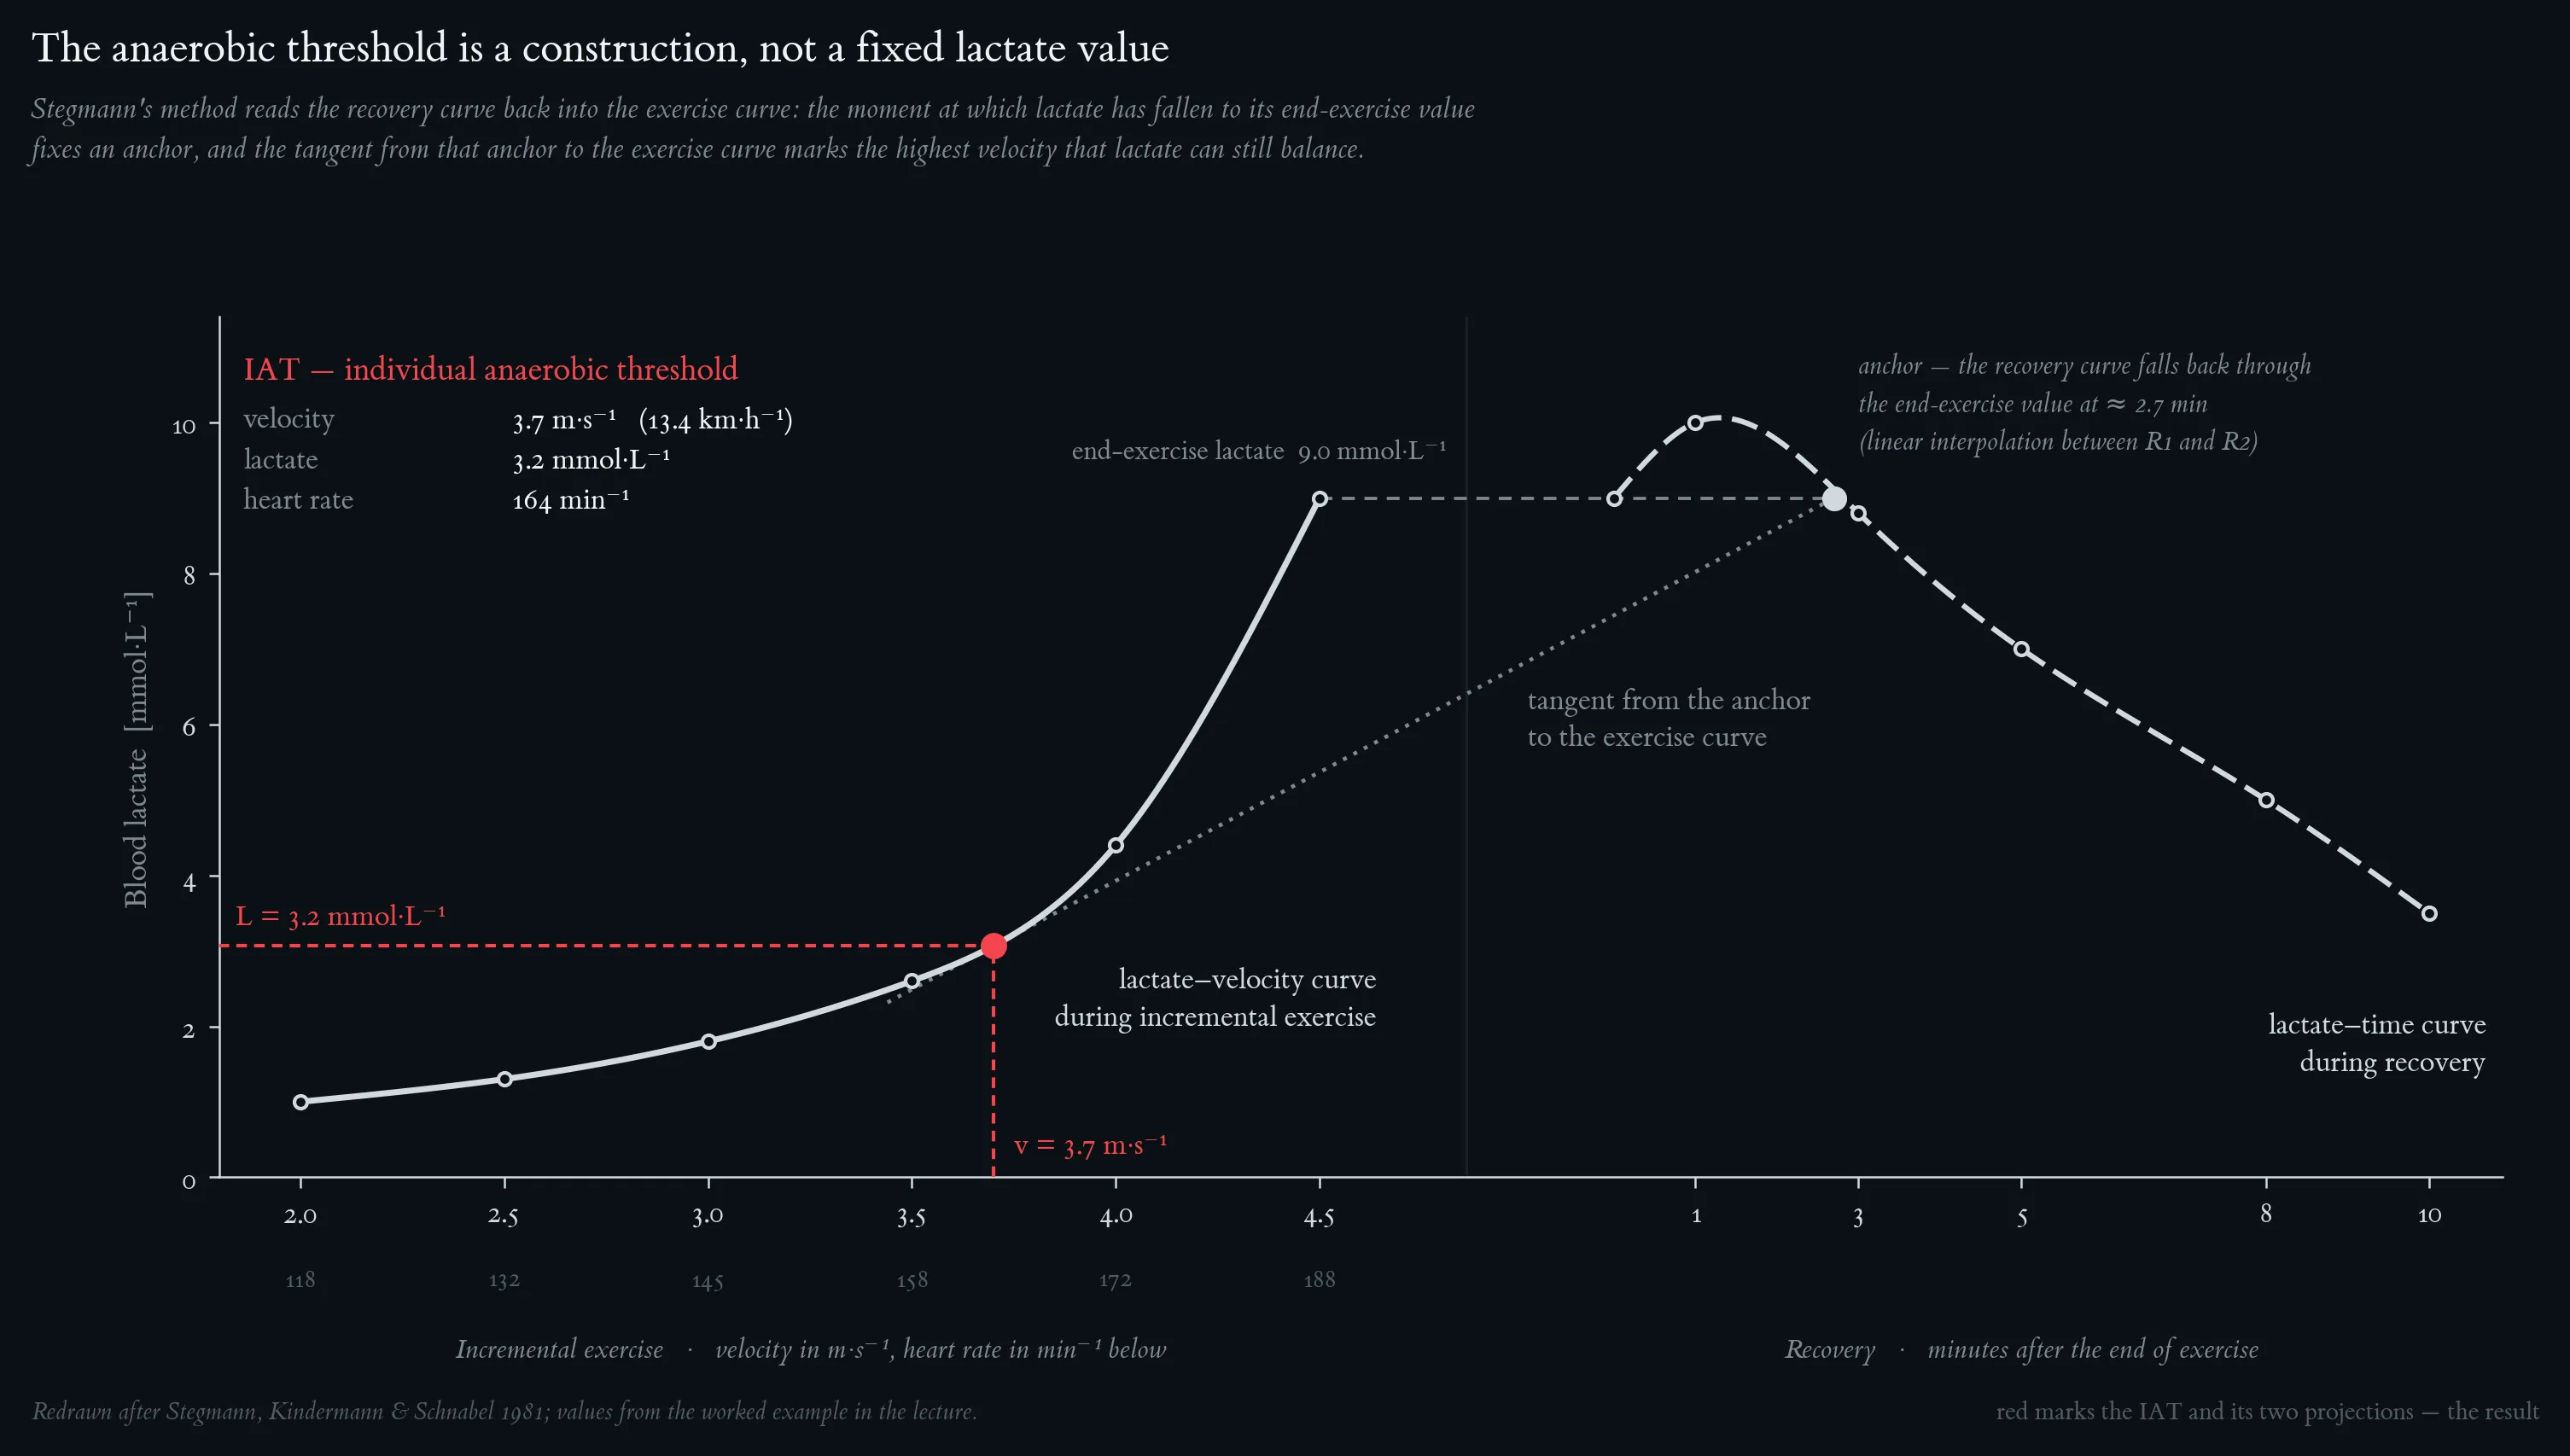
Lactate–velocity curve during incremental exercise (red) and lactate–time curve during recovery (blue). The dashed grey line marks L_end. The descending recovery curve crosses L_end at ≈ 2.7 min post-exercise (linear interpolation between R1 = 10.0 mmol/L at 1 min and R2 = 8.8 mmol/L at 3 min → L = 9.0 at t ≈ 2.7 min): this is the anchor. The dashed green line is the tangent from the anchor to the ascending exercise curve; the tangent contact on the exercise curve is the IAT. Vertical and horizontal projections give v_IAT and L_IAT respectively.
Typical blood-lactate ranges encountered during the four endurance-training zones, expressed as a percentage of the individual anaerobic threshold (IAS). Redrawn after Kindermann (2004).
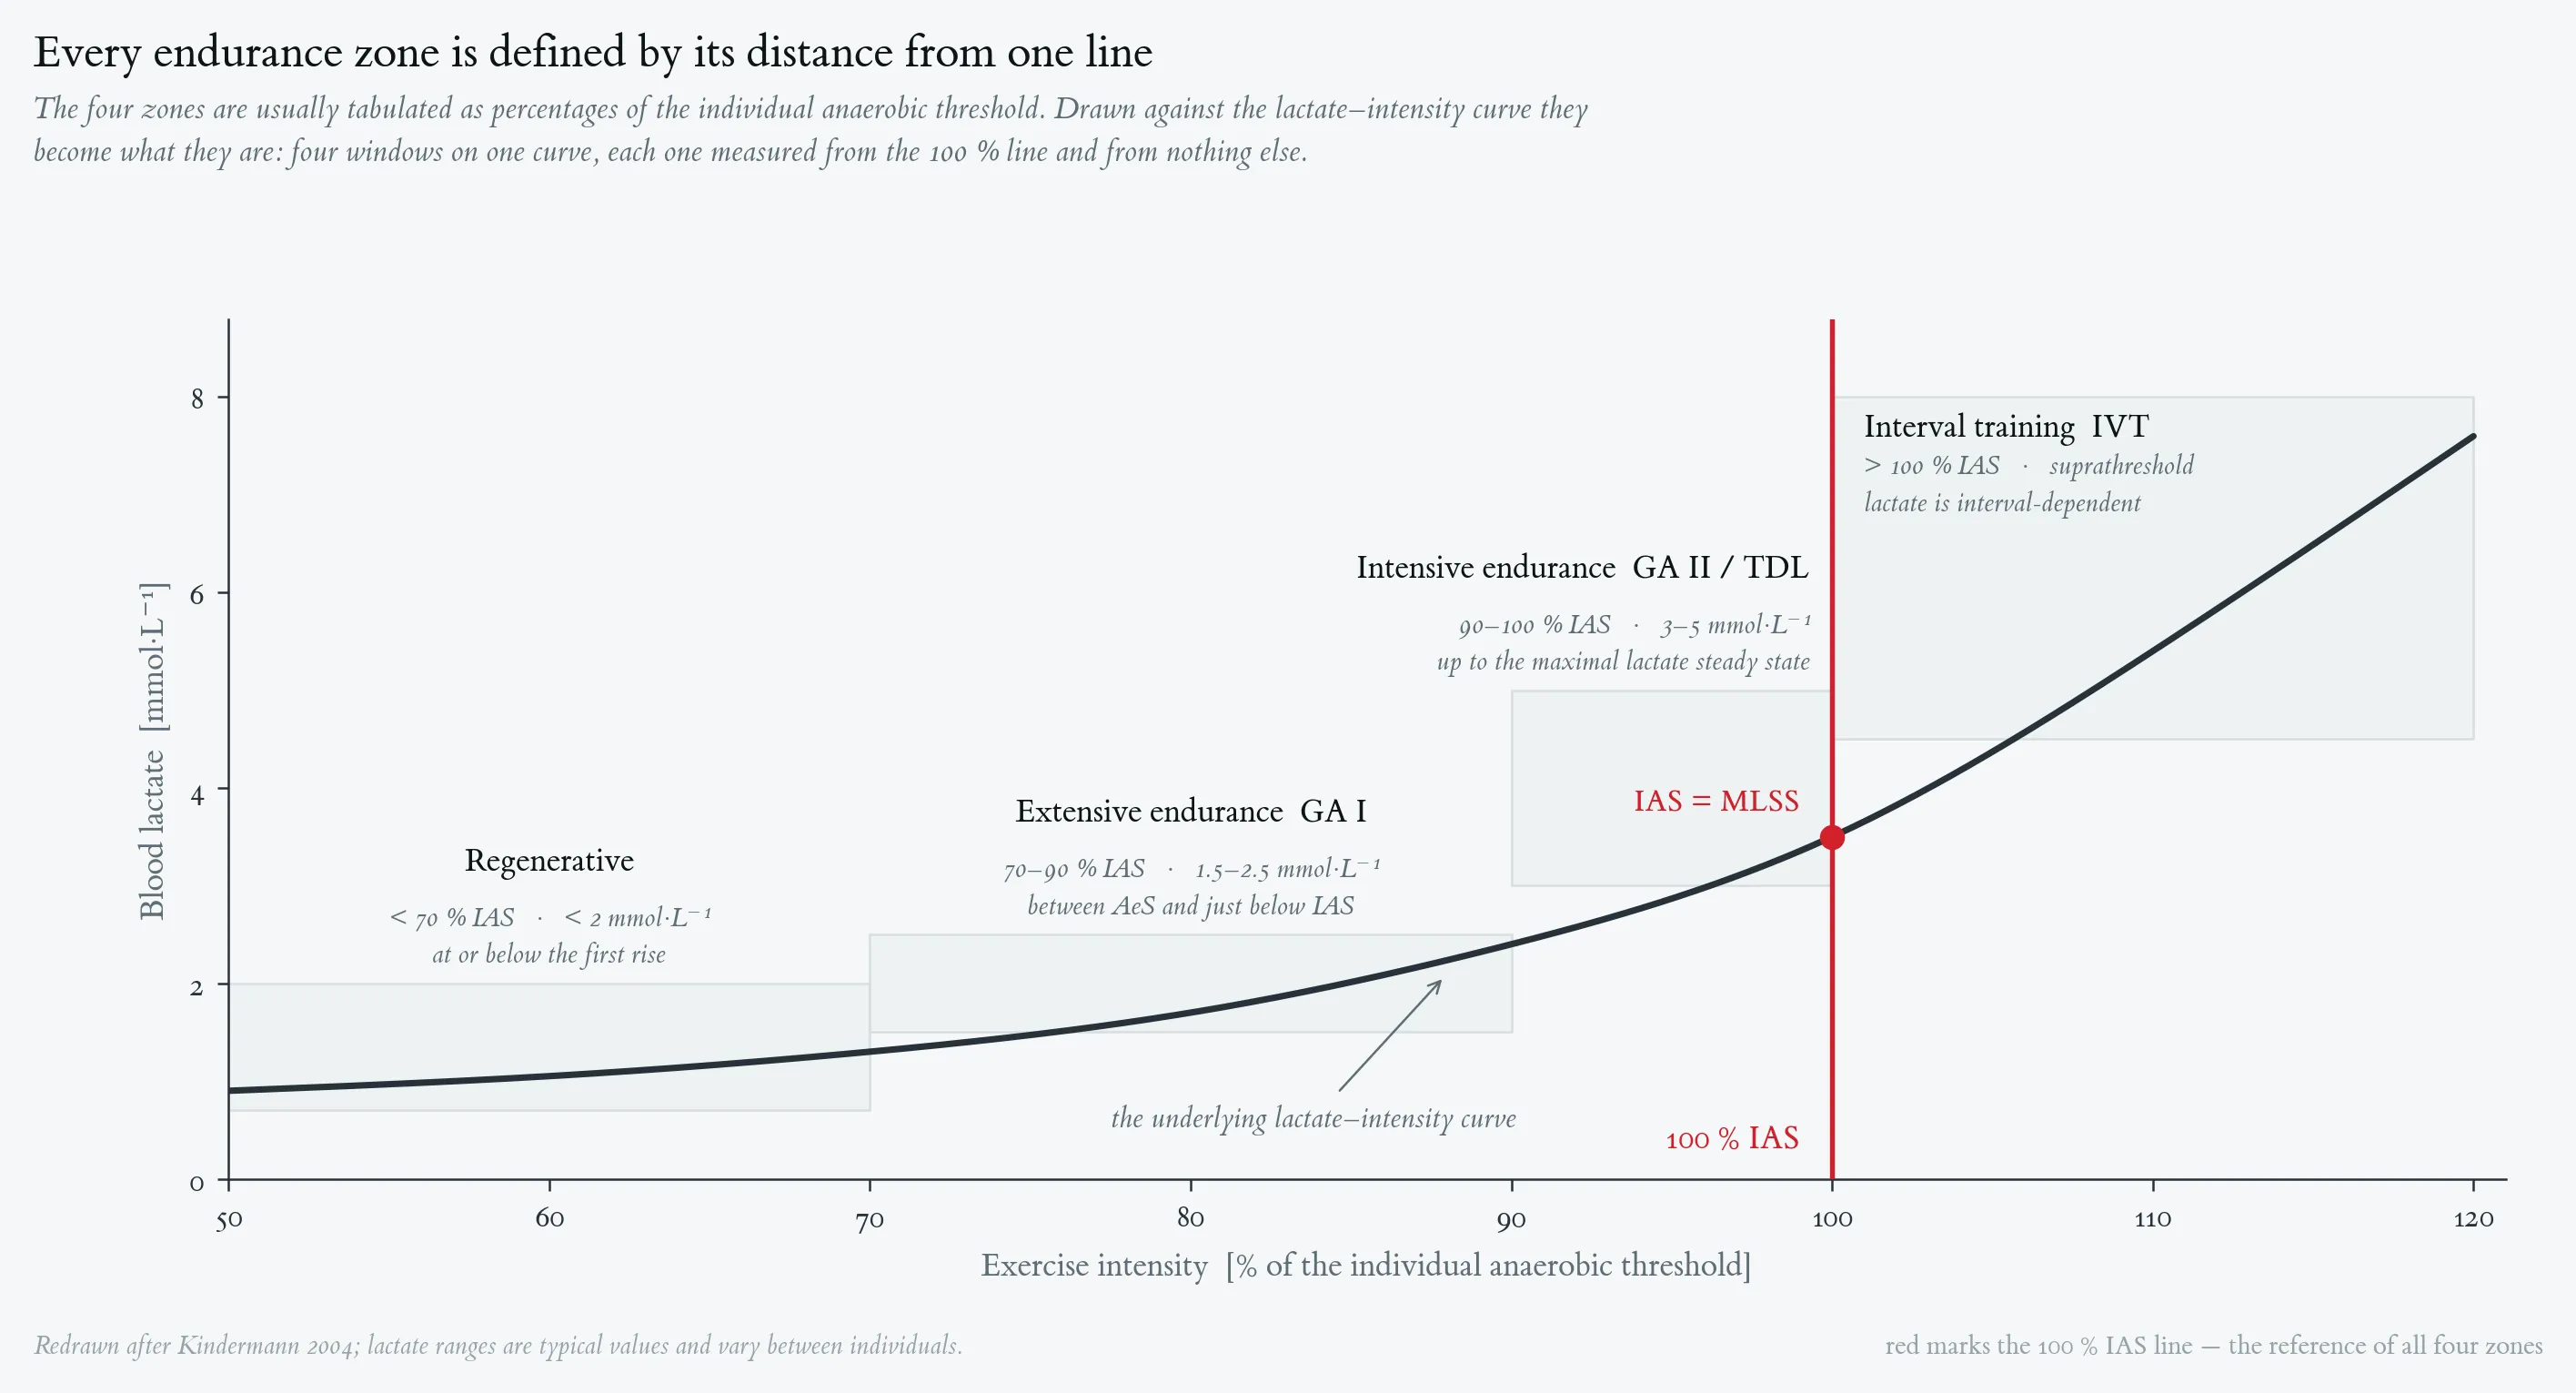
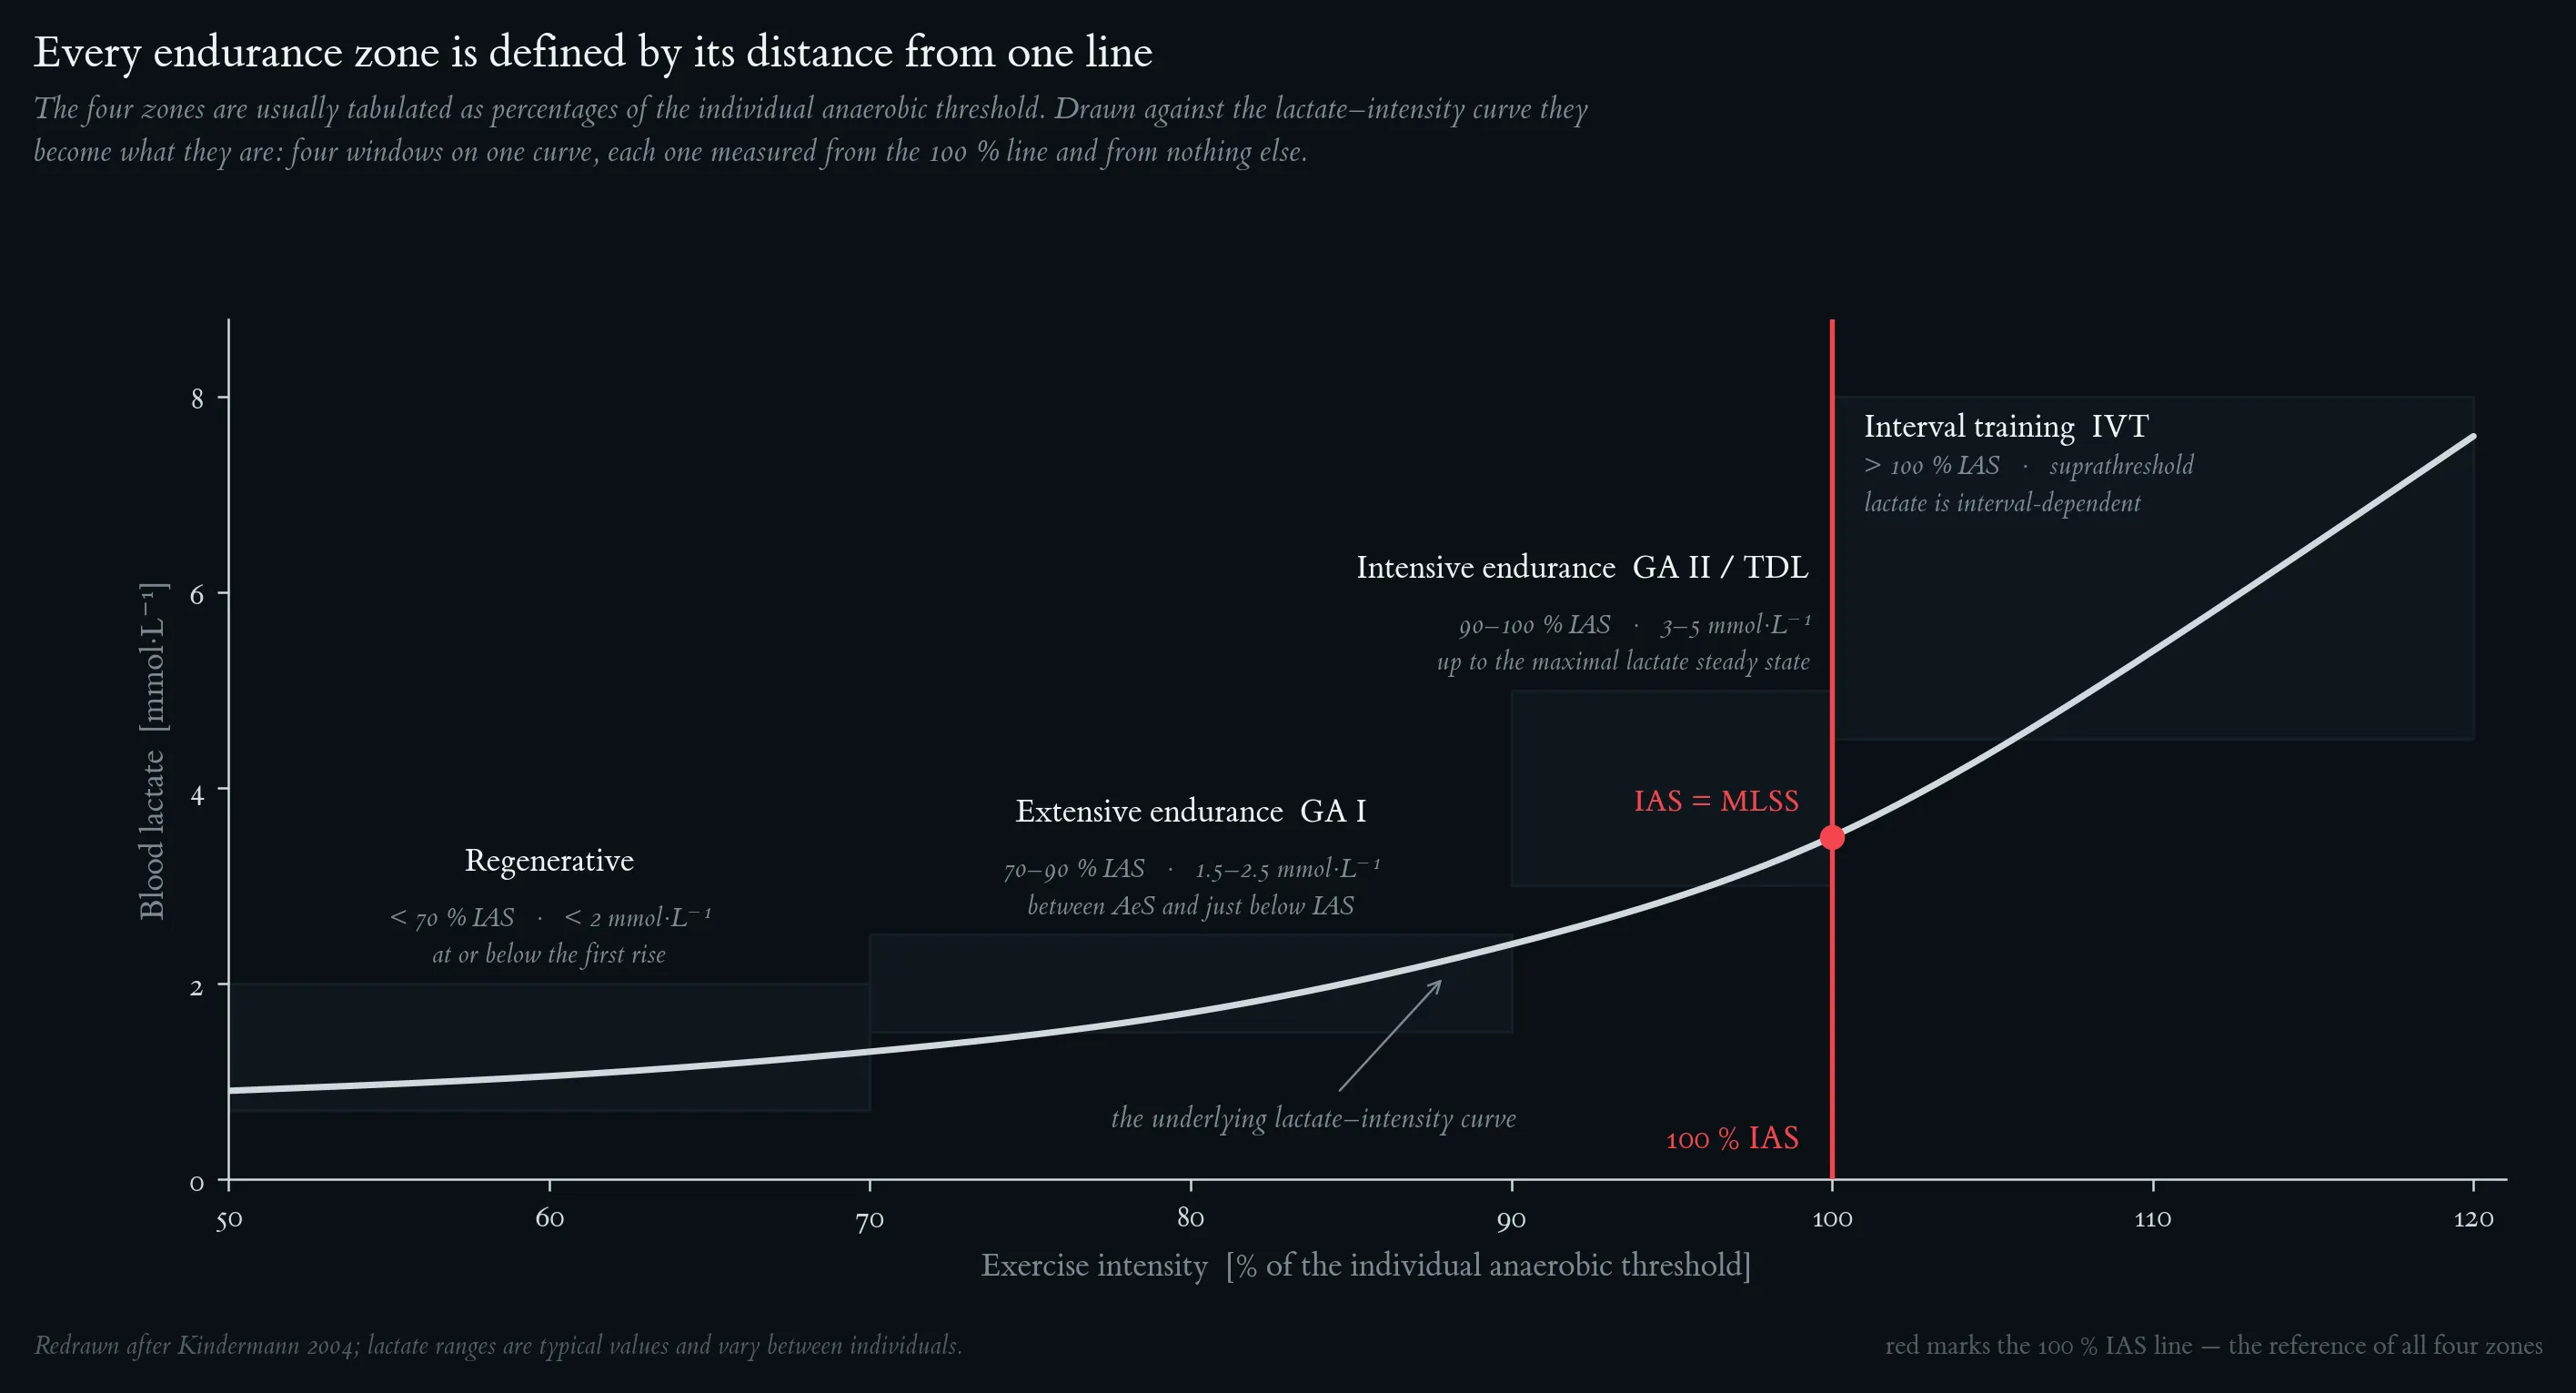
Typical blood-lactate ranges encountered during the four endurance-training zones, expressed as a percentage of the individual anaerobic threshold (IAS). Redrawn after Kindermann (2004).
Backbone 3: Basics of Biochemistry Principles of Exercise
The three energy systems compared by the two properties that matter in practice: how fast they resynthesise ATP, and how long they can keep it up. ATP–PCr delivers the highest rate but is spent within 5–10 s, glycolysis peaks over 30–90 s, and oxidative phosphorylation sustains a moderate rate for effectively unlimited duration. Note the logarithmic time axis.
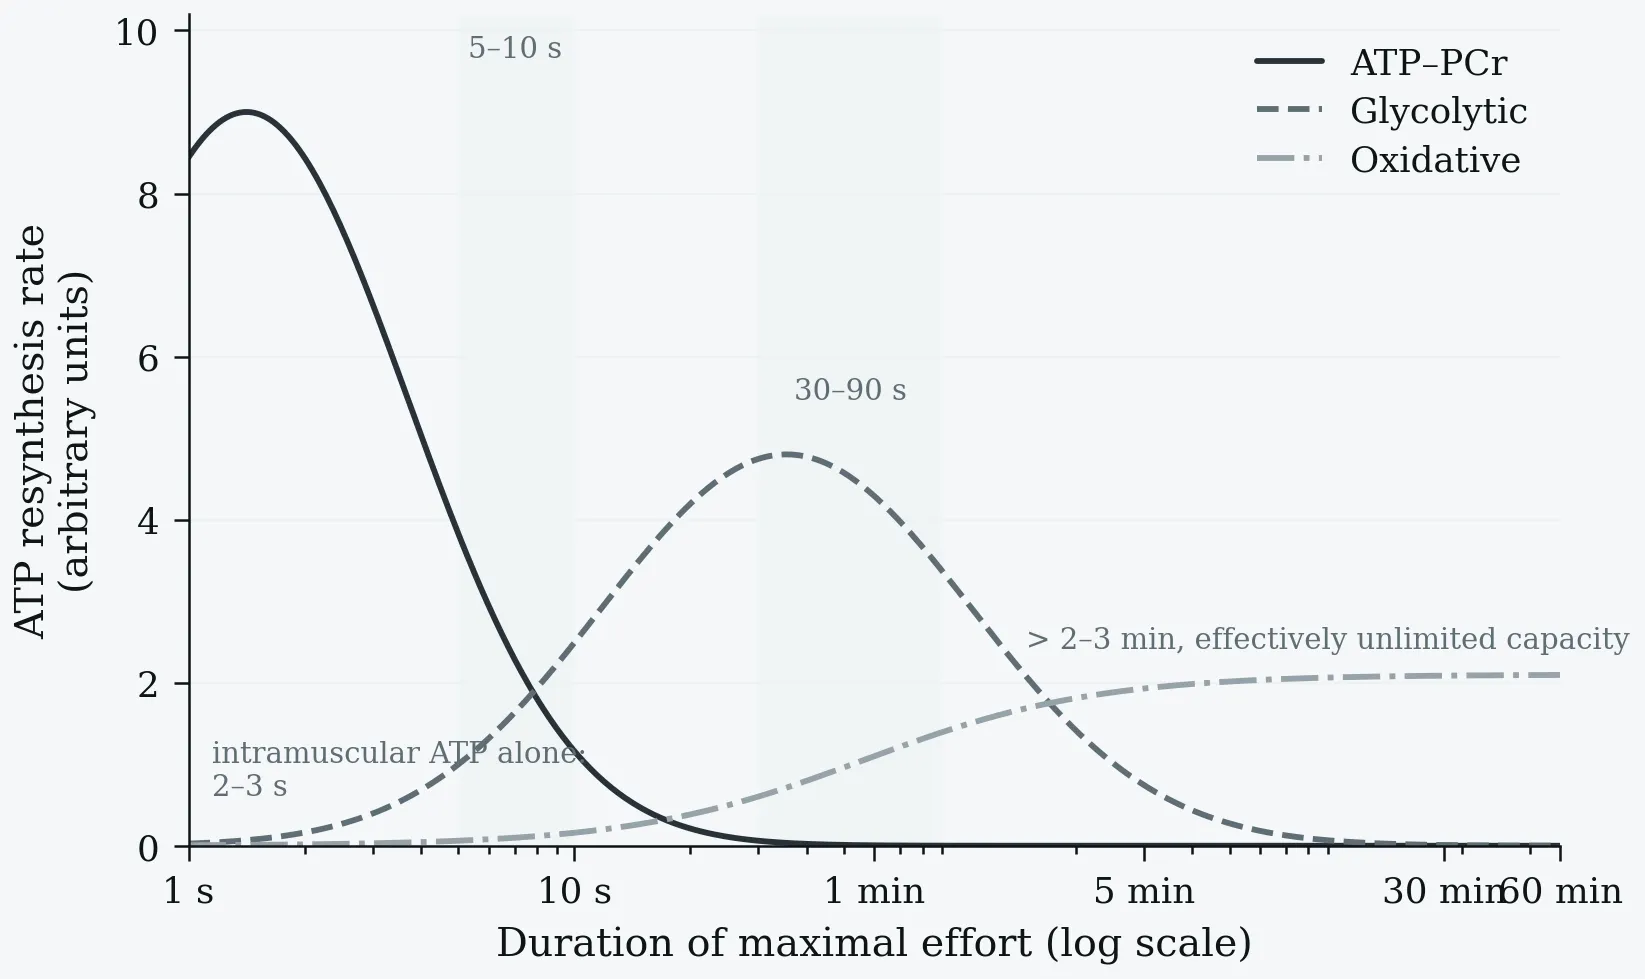
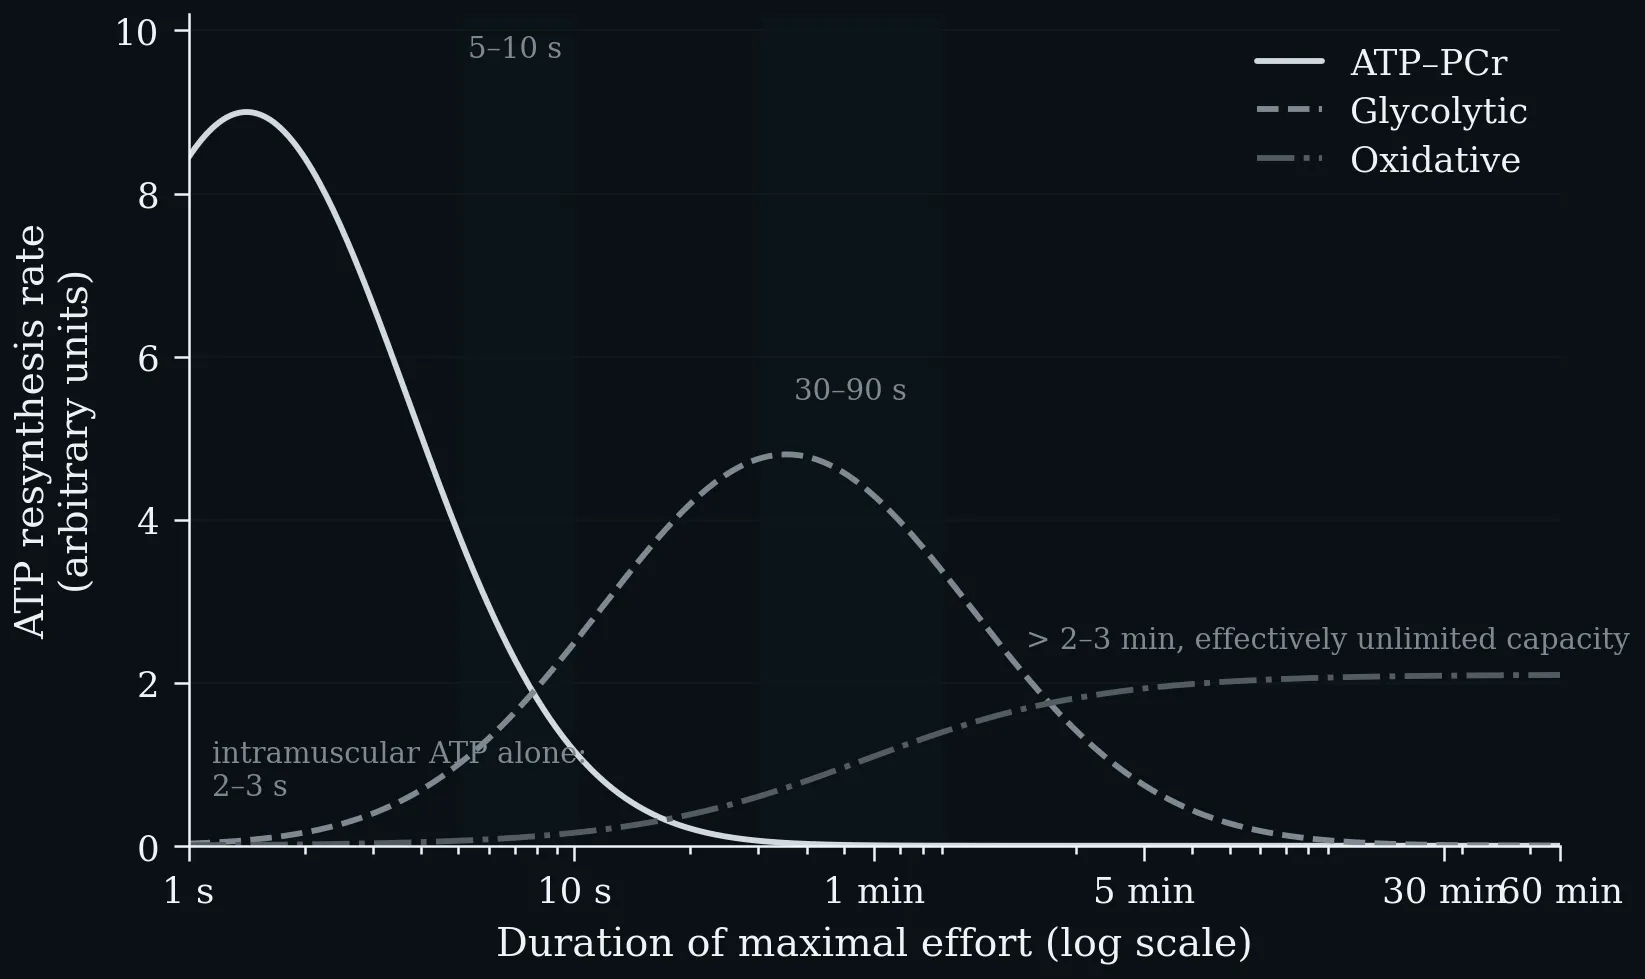
The three energy systems compared by the two properties that matter in practice: how fast they resynthesise ATP, and how long they can keep it up. ATP–PCr delivers the highest rate but is spent within 5–10 s, glycolysis peaks over 30–90 s, and oxidative phosphorylation sustains a moderate rate for effectively unlimited duration. Note the logarithmic time axis.
After uptake into the cell, glucose is phosphorylated and passes through glycolysis down to pyruvate. Under anaerobic conditions, pyruvate is converted to lactate to regenerate the NAD⁺ required for glycolysis, and lactate is typically released by the cells (2 mol ATP per mol glucose). Under aerobic conditions, pyruvate enters the mitochondria and is converted to acetyl-CoA by oxidative decarboxylation, feeding the citrate cycle; it is broken down to CO₂ and the reduction equivalents NADH/H⁺ and FADH₂, whose oxygen-dependent reoxidation yields water and is coupled to ATP synthesis from ADP and Pᵢ, giving ≈ 30 mol ATP per mol glucose.


After uptake into the cell, glucose is phosphorylated and passes through glycolysis down to pyruvate. Under anaerobic conditions, pyruvate is converted to lactate to regenerate the NAD⁺ required for glycolysis, and lactate is typically released by the cells (2 mol ATP per mol glucose). Under aerobic conditions, pyruvate enters the mitochondria and is converted to acetyl-CoA by oxidative decarboxylation, feeding the citrate cycle; it is broken down to CO₂ and the reduction equivalents NADH/H⁺ and FADH₂, whose oxygen-dependent reoxidation yields water and is coupled to ATP synthesis from ADP and Pᵢ, giving ≈ 30 mol ATP per mol glucose.
Left: ATP yield per mole of substrate on a logarithmic scale — 2 for anaerobic glycolysis, ~31 for the complete aerobic oxidation of glucose, and 106 for palmitate. Right: the direct consequence, the Pasteur effect. Because the anaerobic yield is roughly 15-fold lower, about 15× as much glucose must be consumed anaerobically to liberate the same amount of ATP (Nelson & Cox 2013).
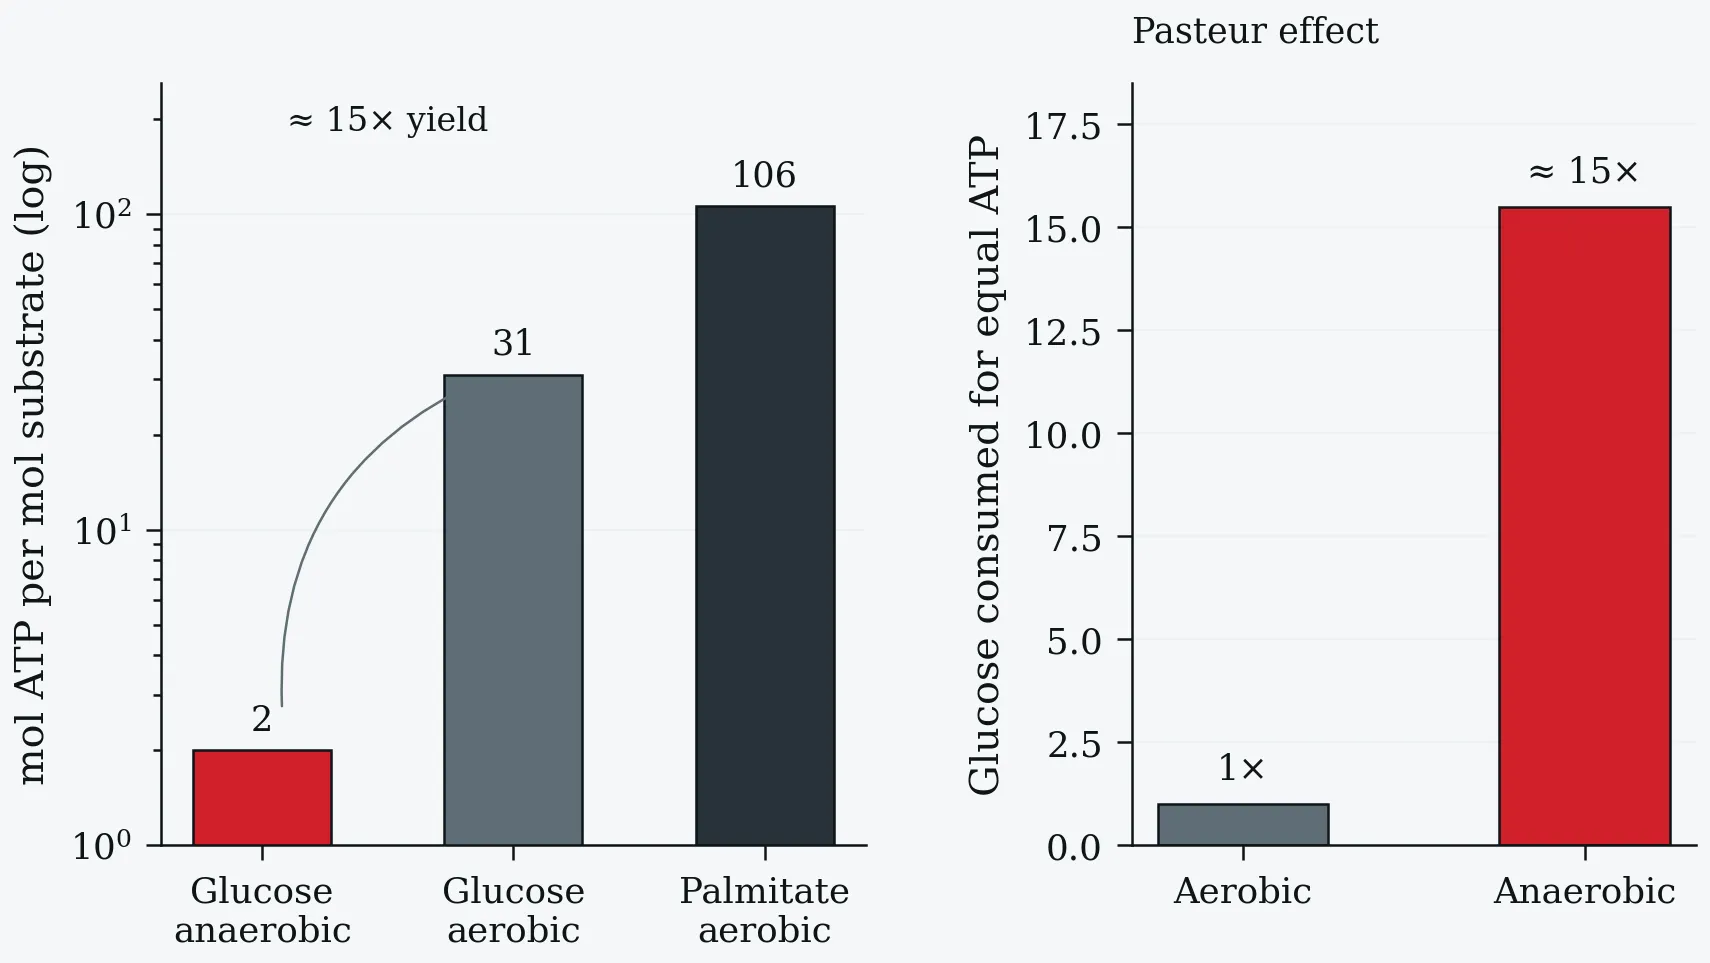
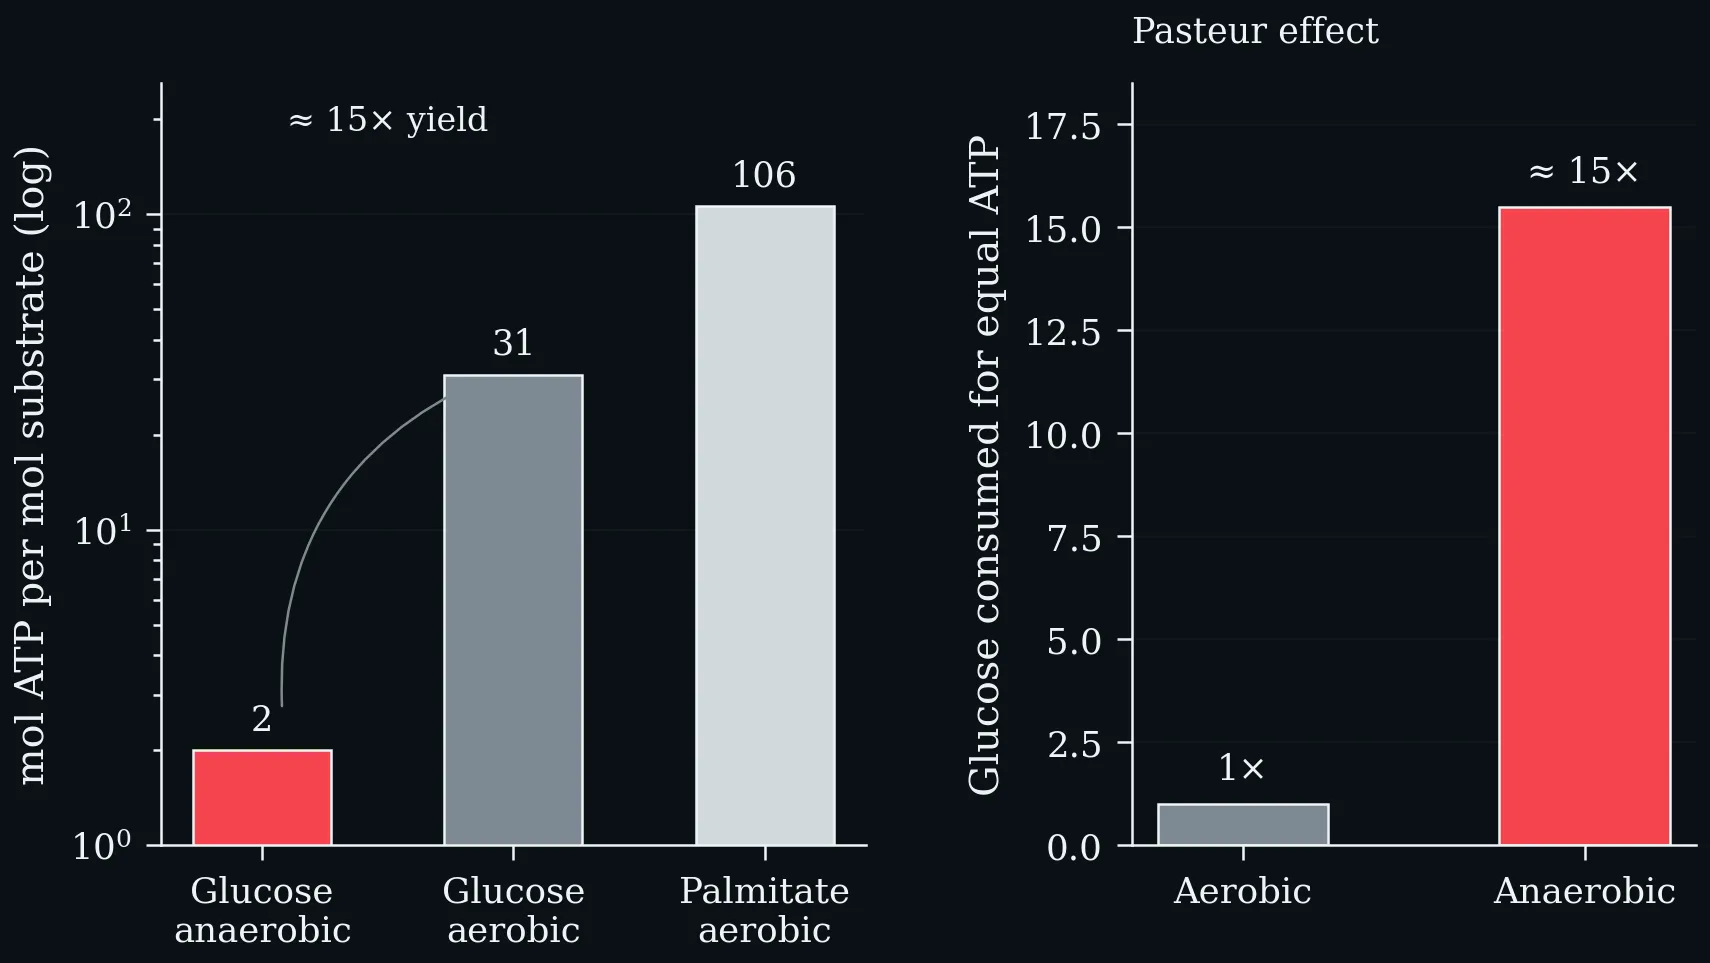
Left: ATP yield per mole of substrate on a logarithmic scale — 2 for anaerobic glycolysis, ~31 for the complete aerobic oxidation of glucose, and 106 for palmitate. Right: the direct consequence, the Pasteur effect. Because the anaerobic yield is roughly 15-fold lower, about 15× as much glucose must be consumed anaerobically to liberate the same amount of ATP (Nelson & Cox 2013).
The crossover from fat to carbohydrate as exercise intensity rises. At low intensity the CHO:fat ratio is about 30:70, near 50:50 at moderate intensity, and 85:15 at high intensity. FAT_max — the intensity at which absolute fat oxidation peaks — lies at roughly 45–65 % V̇O₂max, well below the intensity at which carbohydrate begins to dominate the mixture.
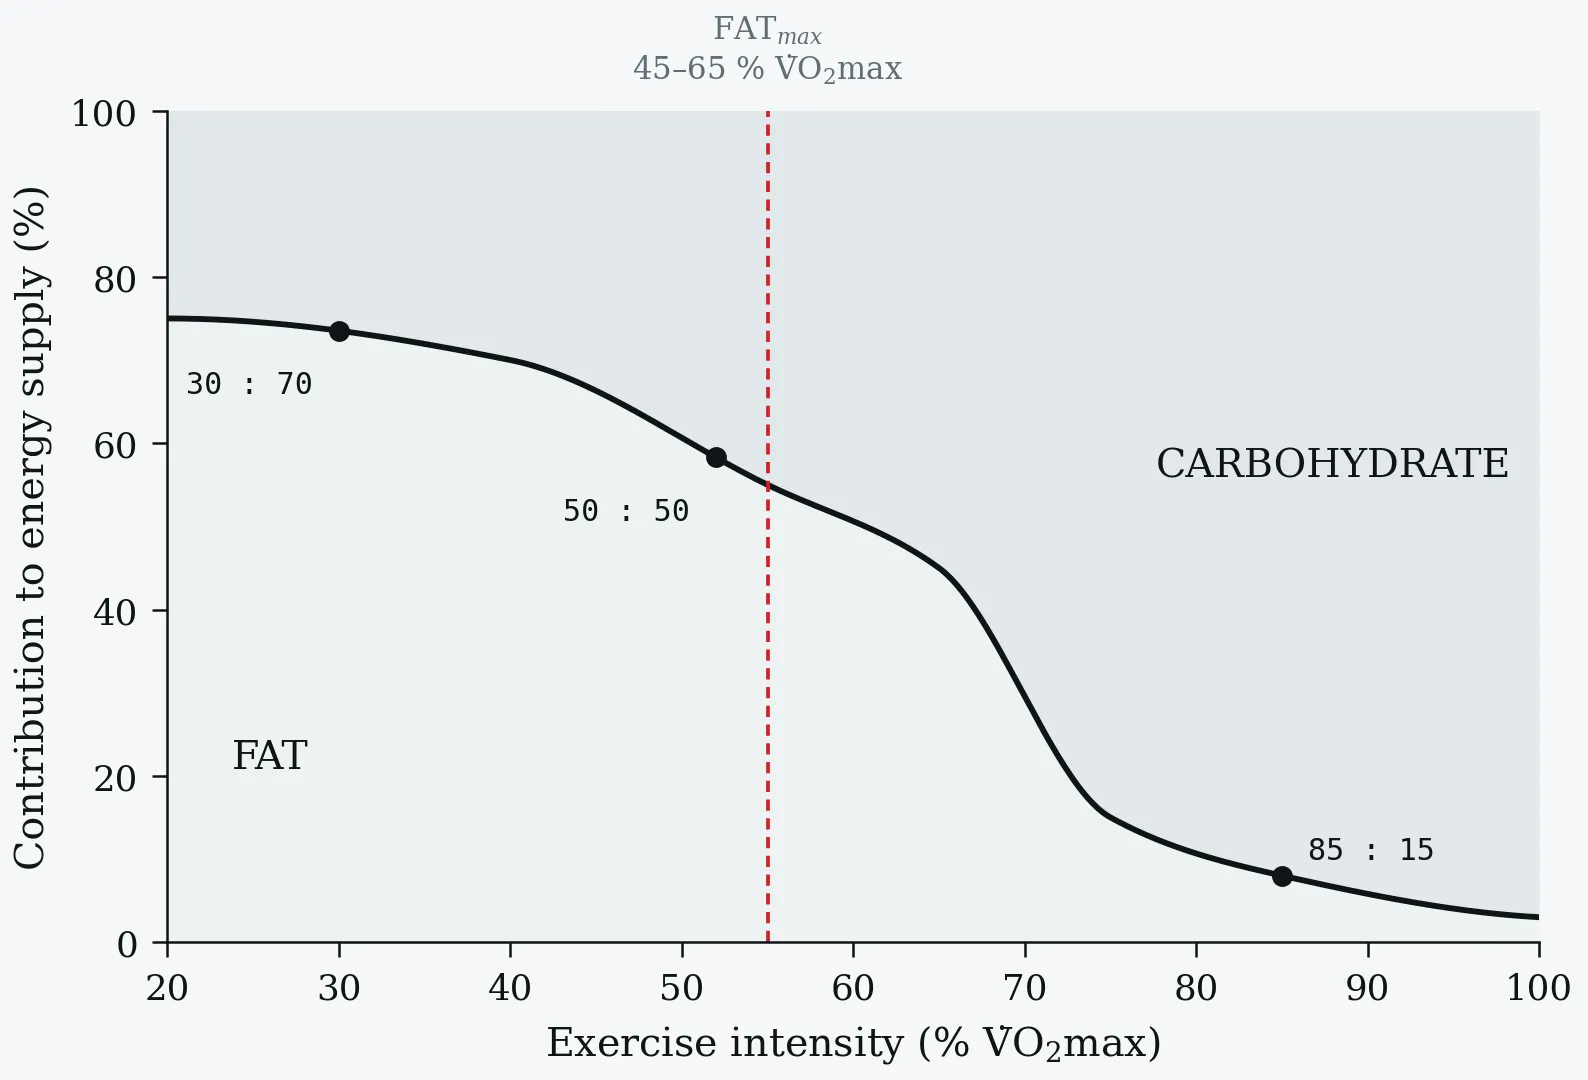
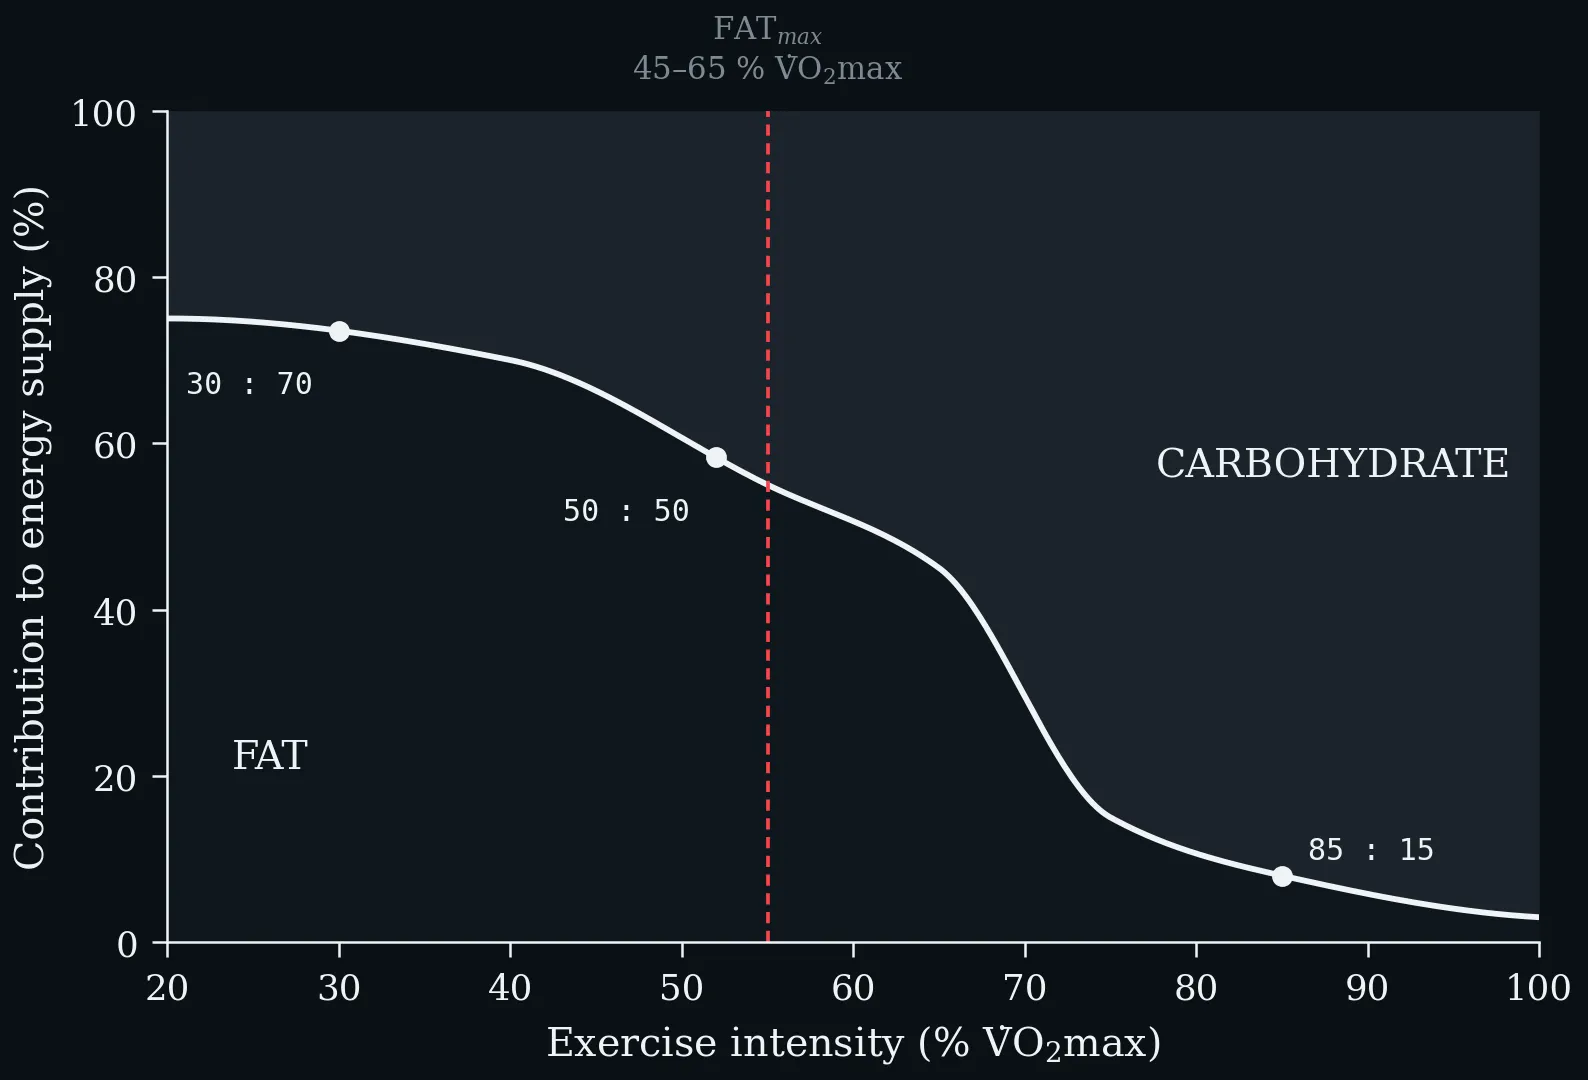
The crossover from fat to carbohydrate as exercise intensity rises. At low intensity the CHO:fat ratio is about 30:70, near 50:50 at moderate intensity, and 85:15 at high intensity. FAT_max — the intensity at which absolute fat oxidation peaks — lies at roughly 45–65 % V̇O₂max, well below the intensity at which carbohydrate begins to dominate the mixture.