Figure Index
Every figure from every lecture, with its caption, in lecture order.
33 figures from 10 lectures.
Lecture 1: Basics in Exercise Physiology and Immunology - Key Concepts, Homeostasis and Hormesis
Homeostasis refers to the dynamic equilibrium of the internal environment, maintained through regulatory mechanisms that counteract disturbances. Physical activity is a significant disturbance to homeostasis, triggering rapid regulatory responses.
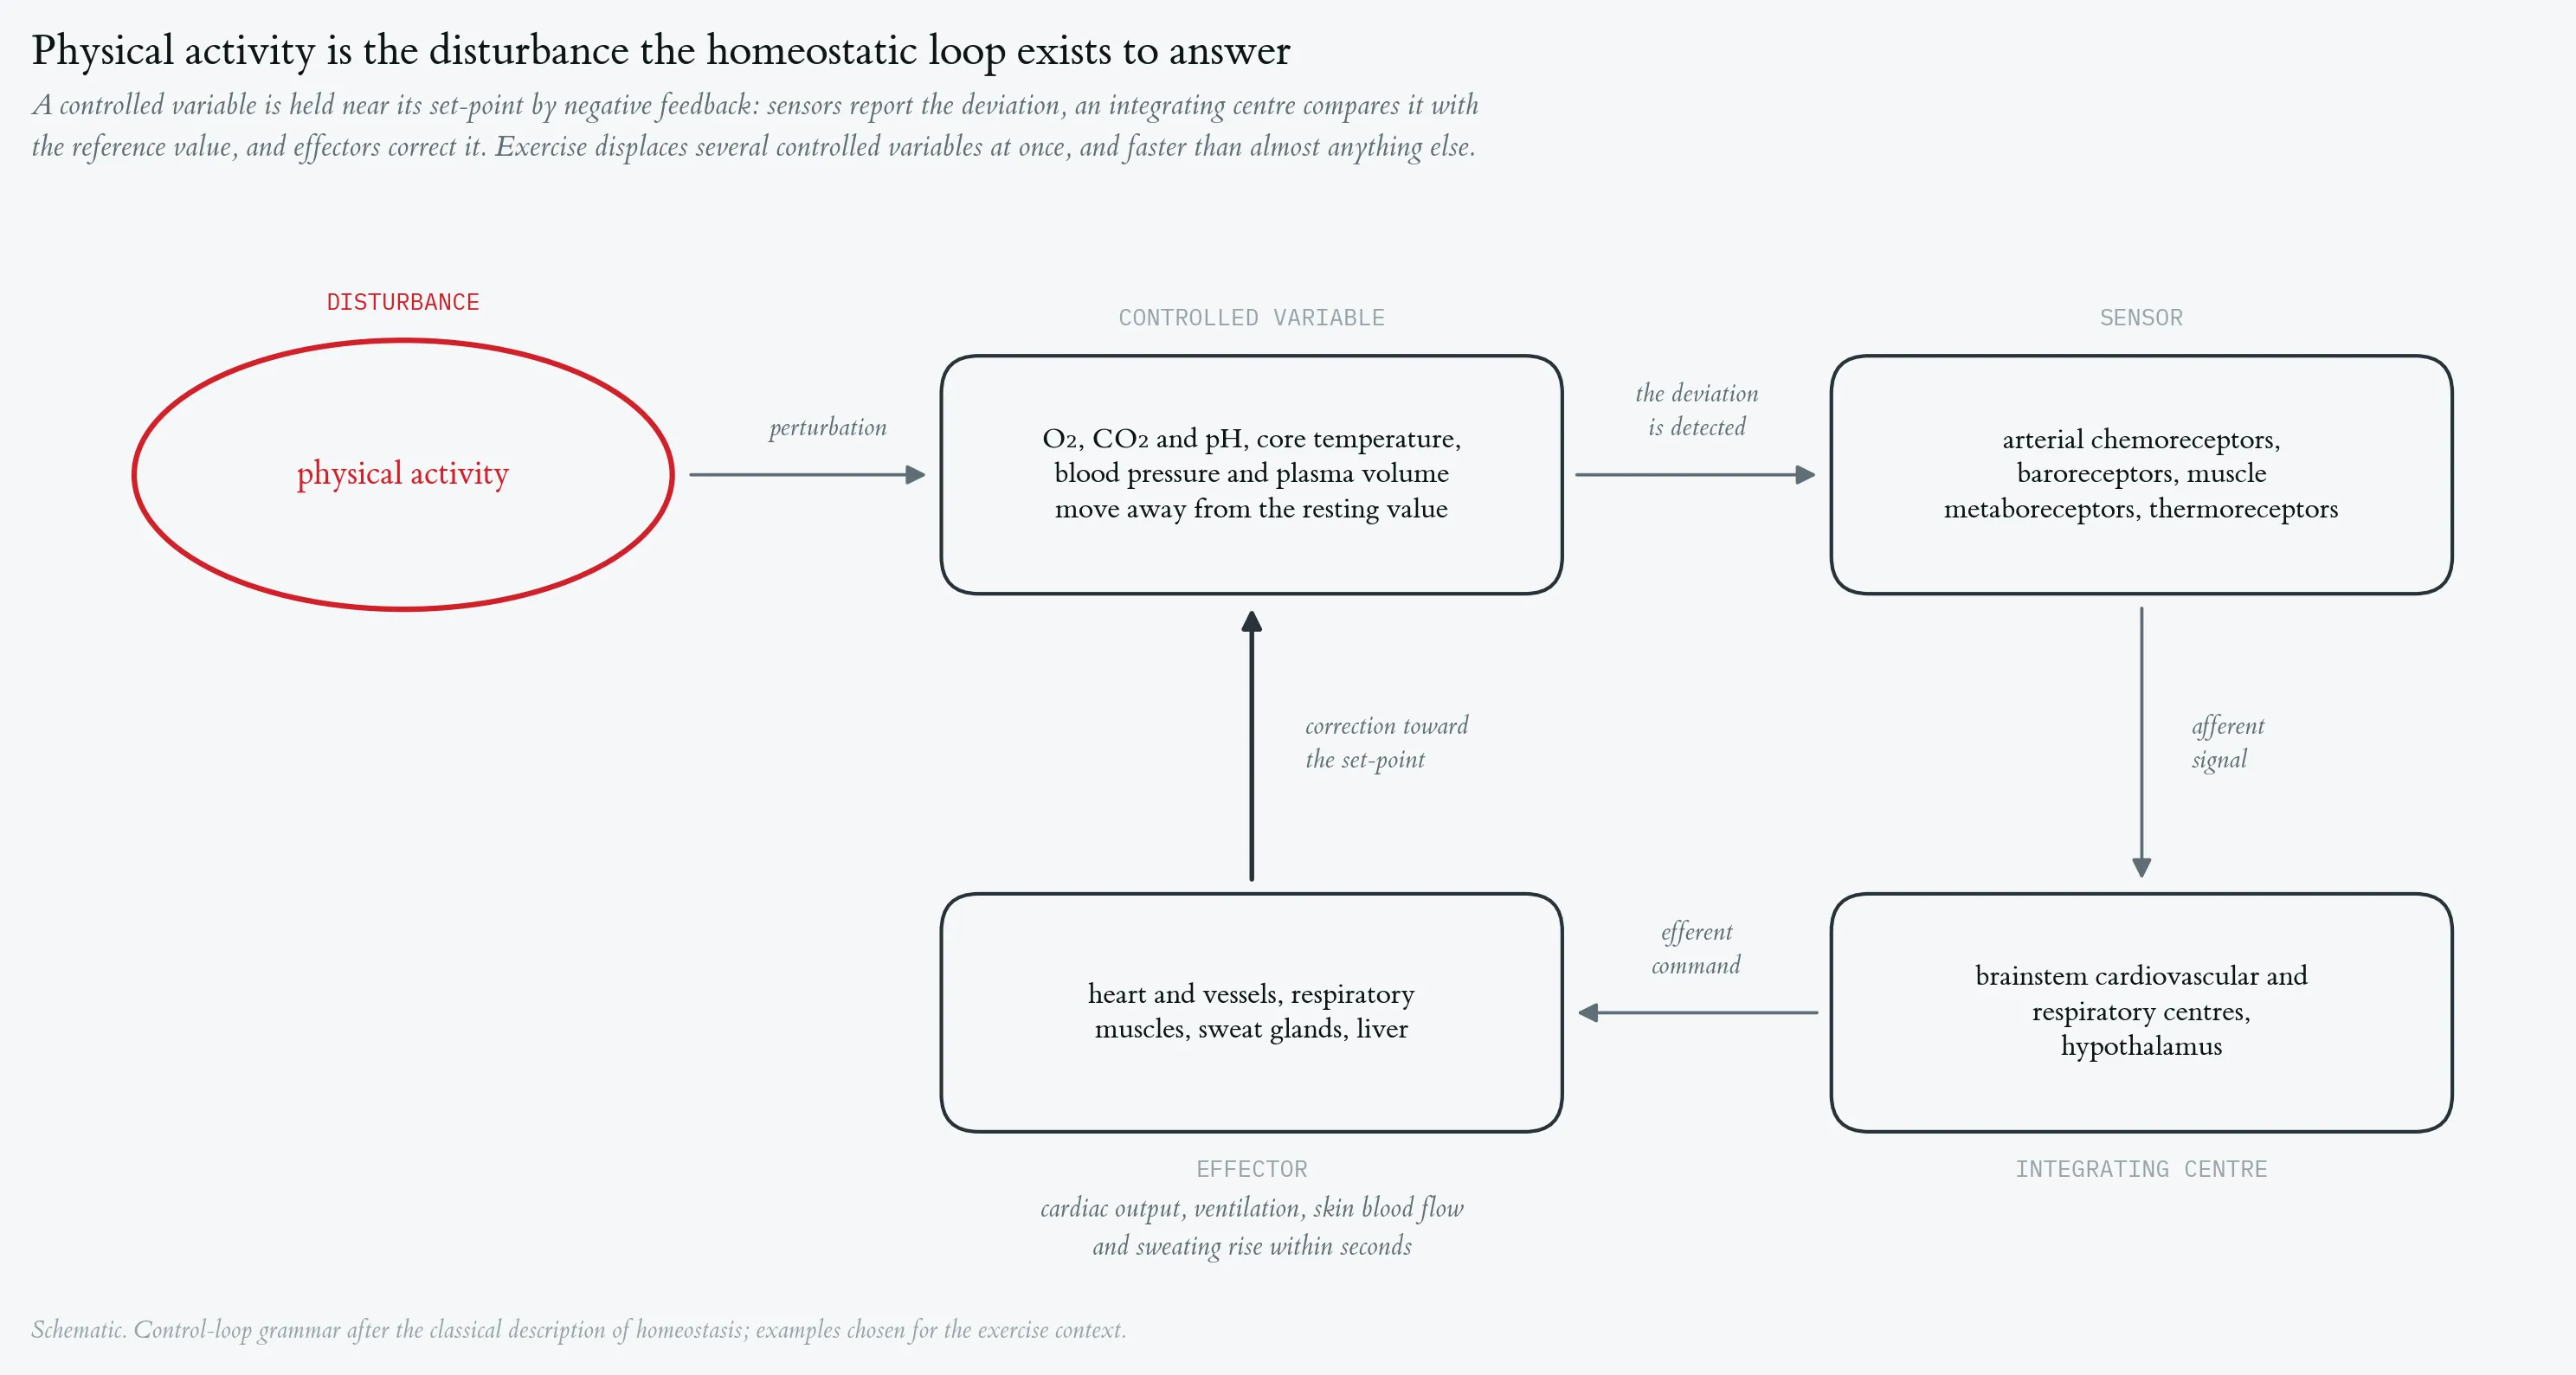
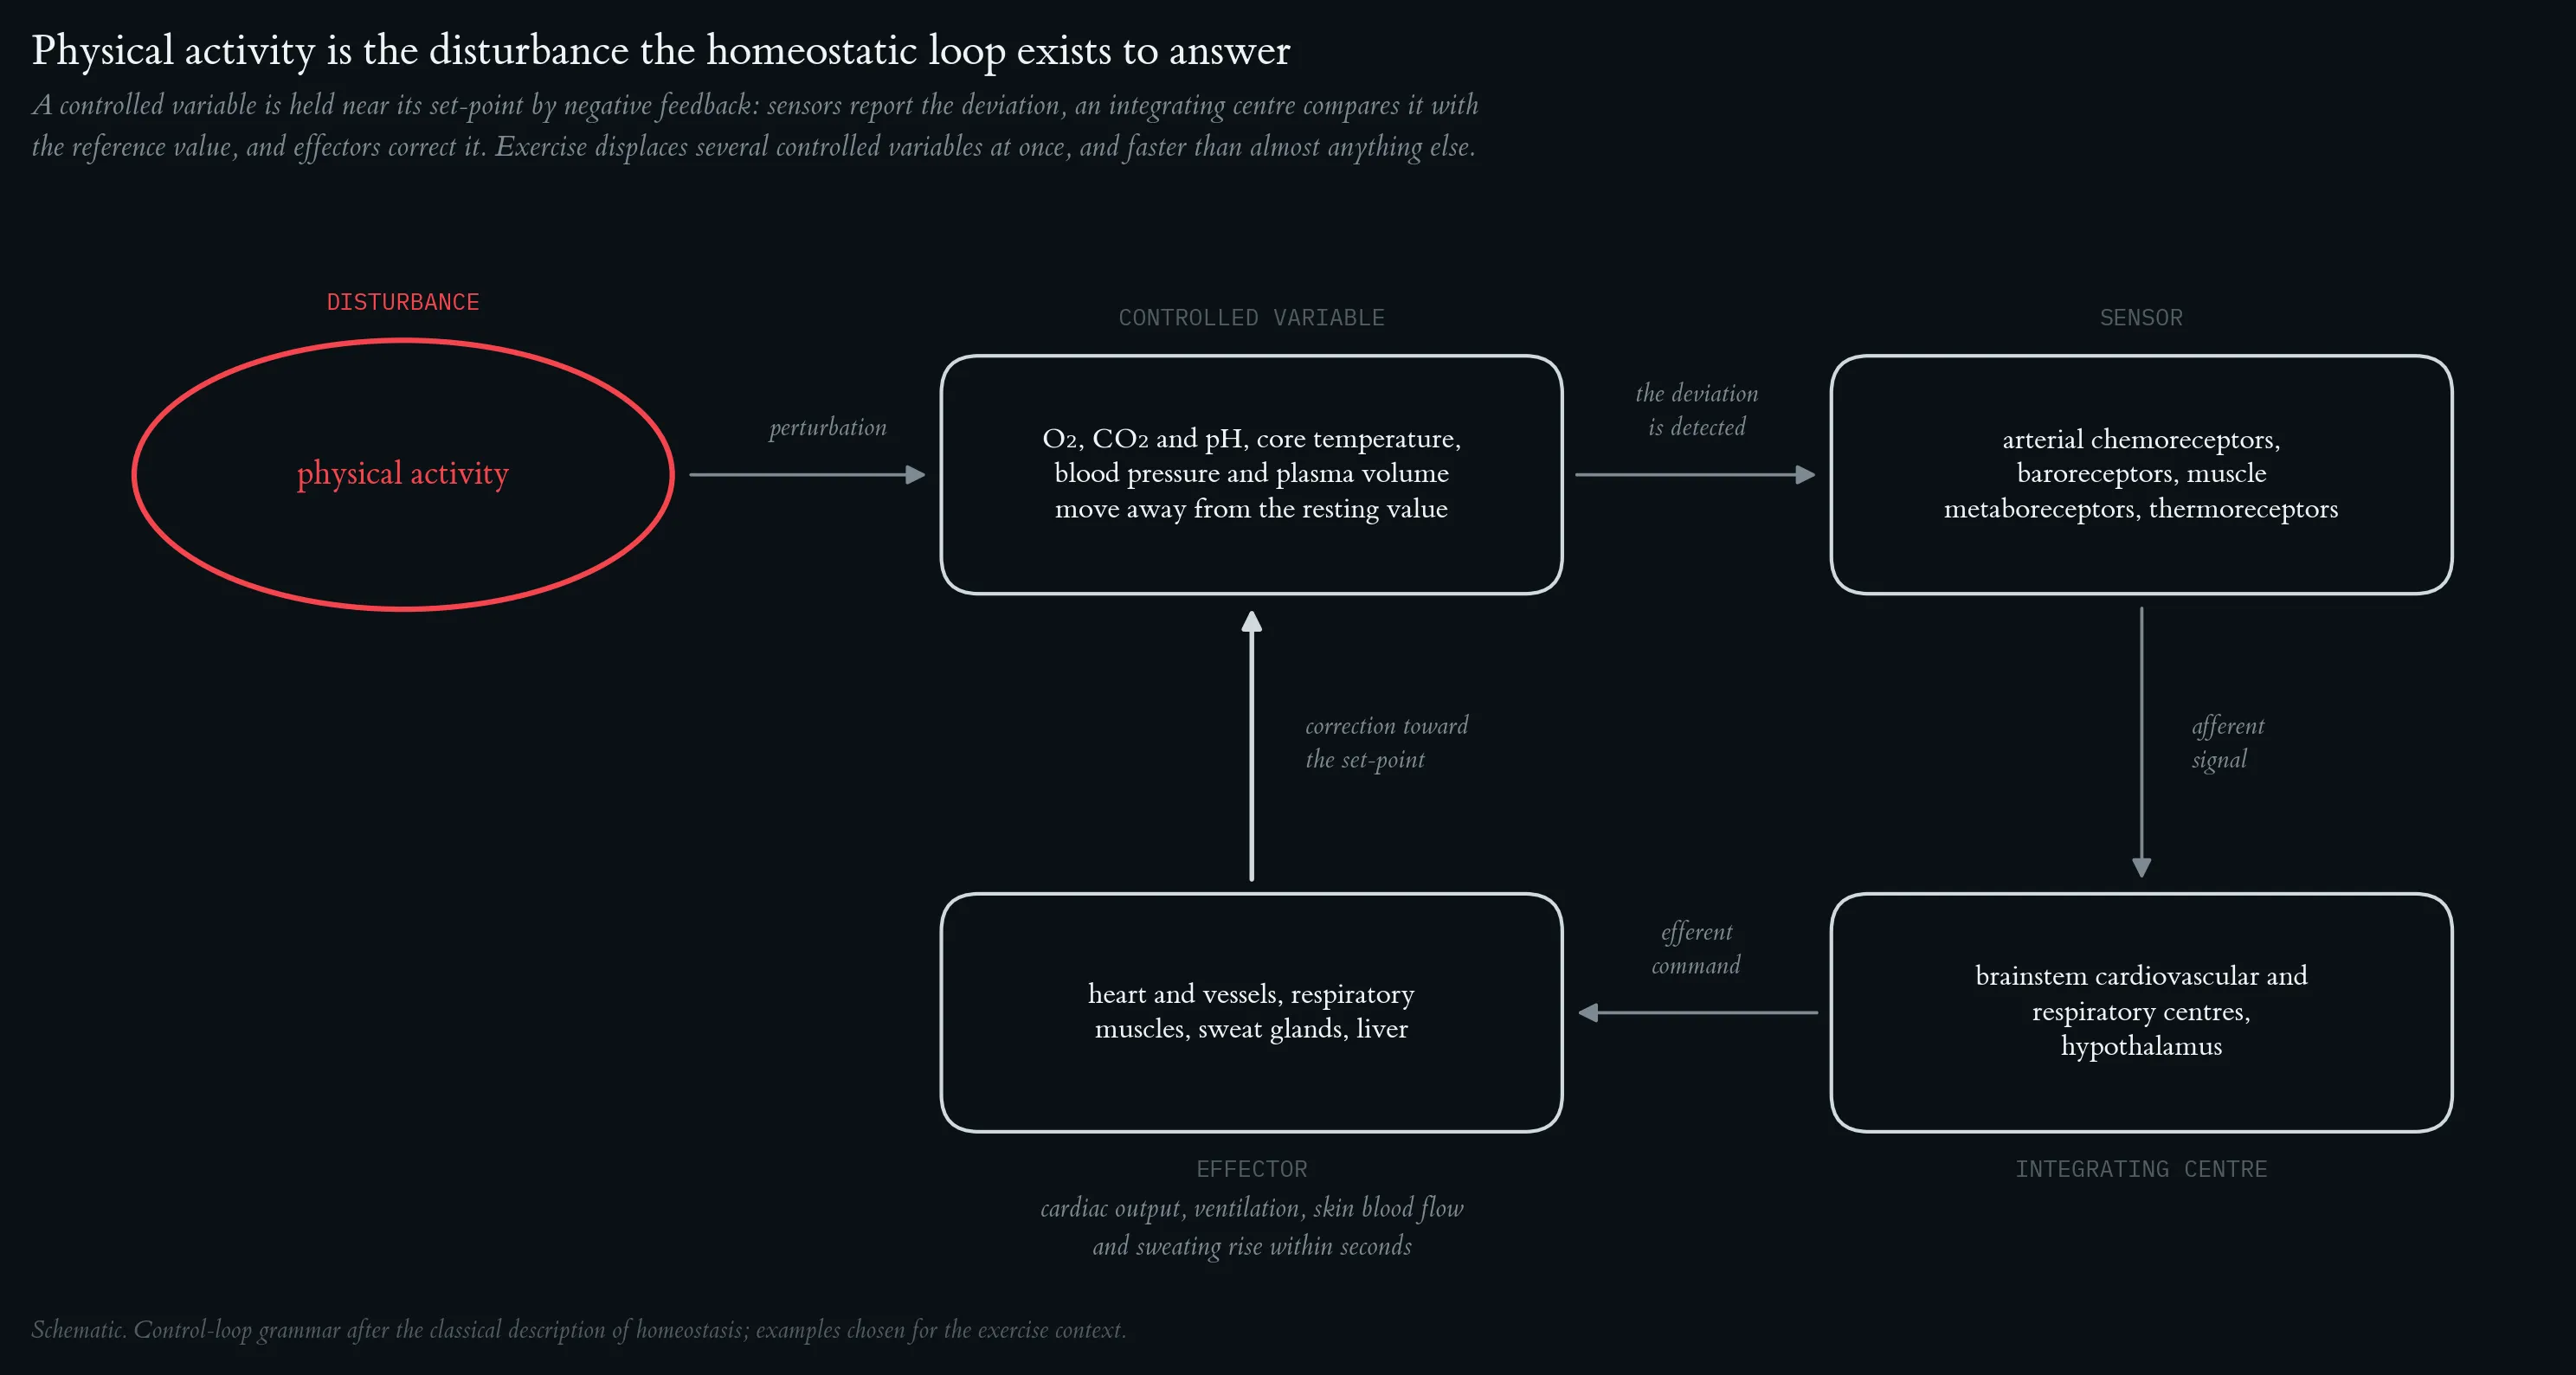
Homeostasis refers to the dynamic equilibrium of the internal environment, maintained through regulatory mechanisms that counteract disturbances. Physical activity is a significant disturbance to homeostasis, triggering rapid regulatory responses.
Cardiorespiratory response to a maximal incremental step test, with mass-related oxygen uptake. Top strip: external work rate, incremented by 50 W every three minutes from 50 W to a final 300 W stage terminated after 30 s at volitional exhaustion. Phases are A1 baseline rest, B step test (red) and A2 passive recovery; vertical hairlines mark the two transitions. (A) Heart rate, beat-to-beat recording averaged in 10-s bins, rising from 51 to 187 bpm. (B) Ventilation (V̇E), rising from about 6 l · min⁻¹ at rest to 122.8 l · min⁻¹ at the end of the final stage, with a peak of 127.8 l · min⁻¹ ten seconds after load offset. (C) Mass-related oxygen uptake, V̇O₂ per body mass (69 kg), in ml · min⁻¹ · kg⁻¹. All three series are 10-s averages (197 samples, recording started 6.8 min before load onset).
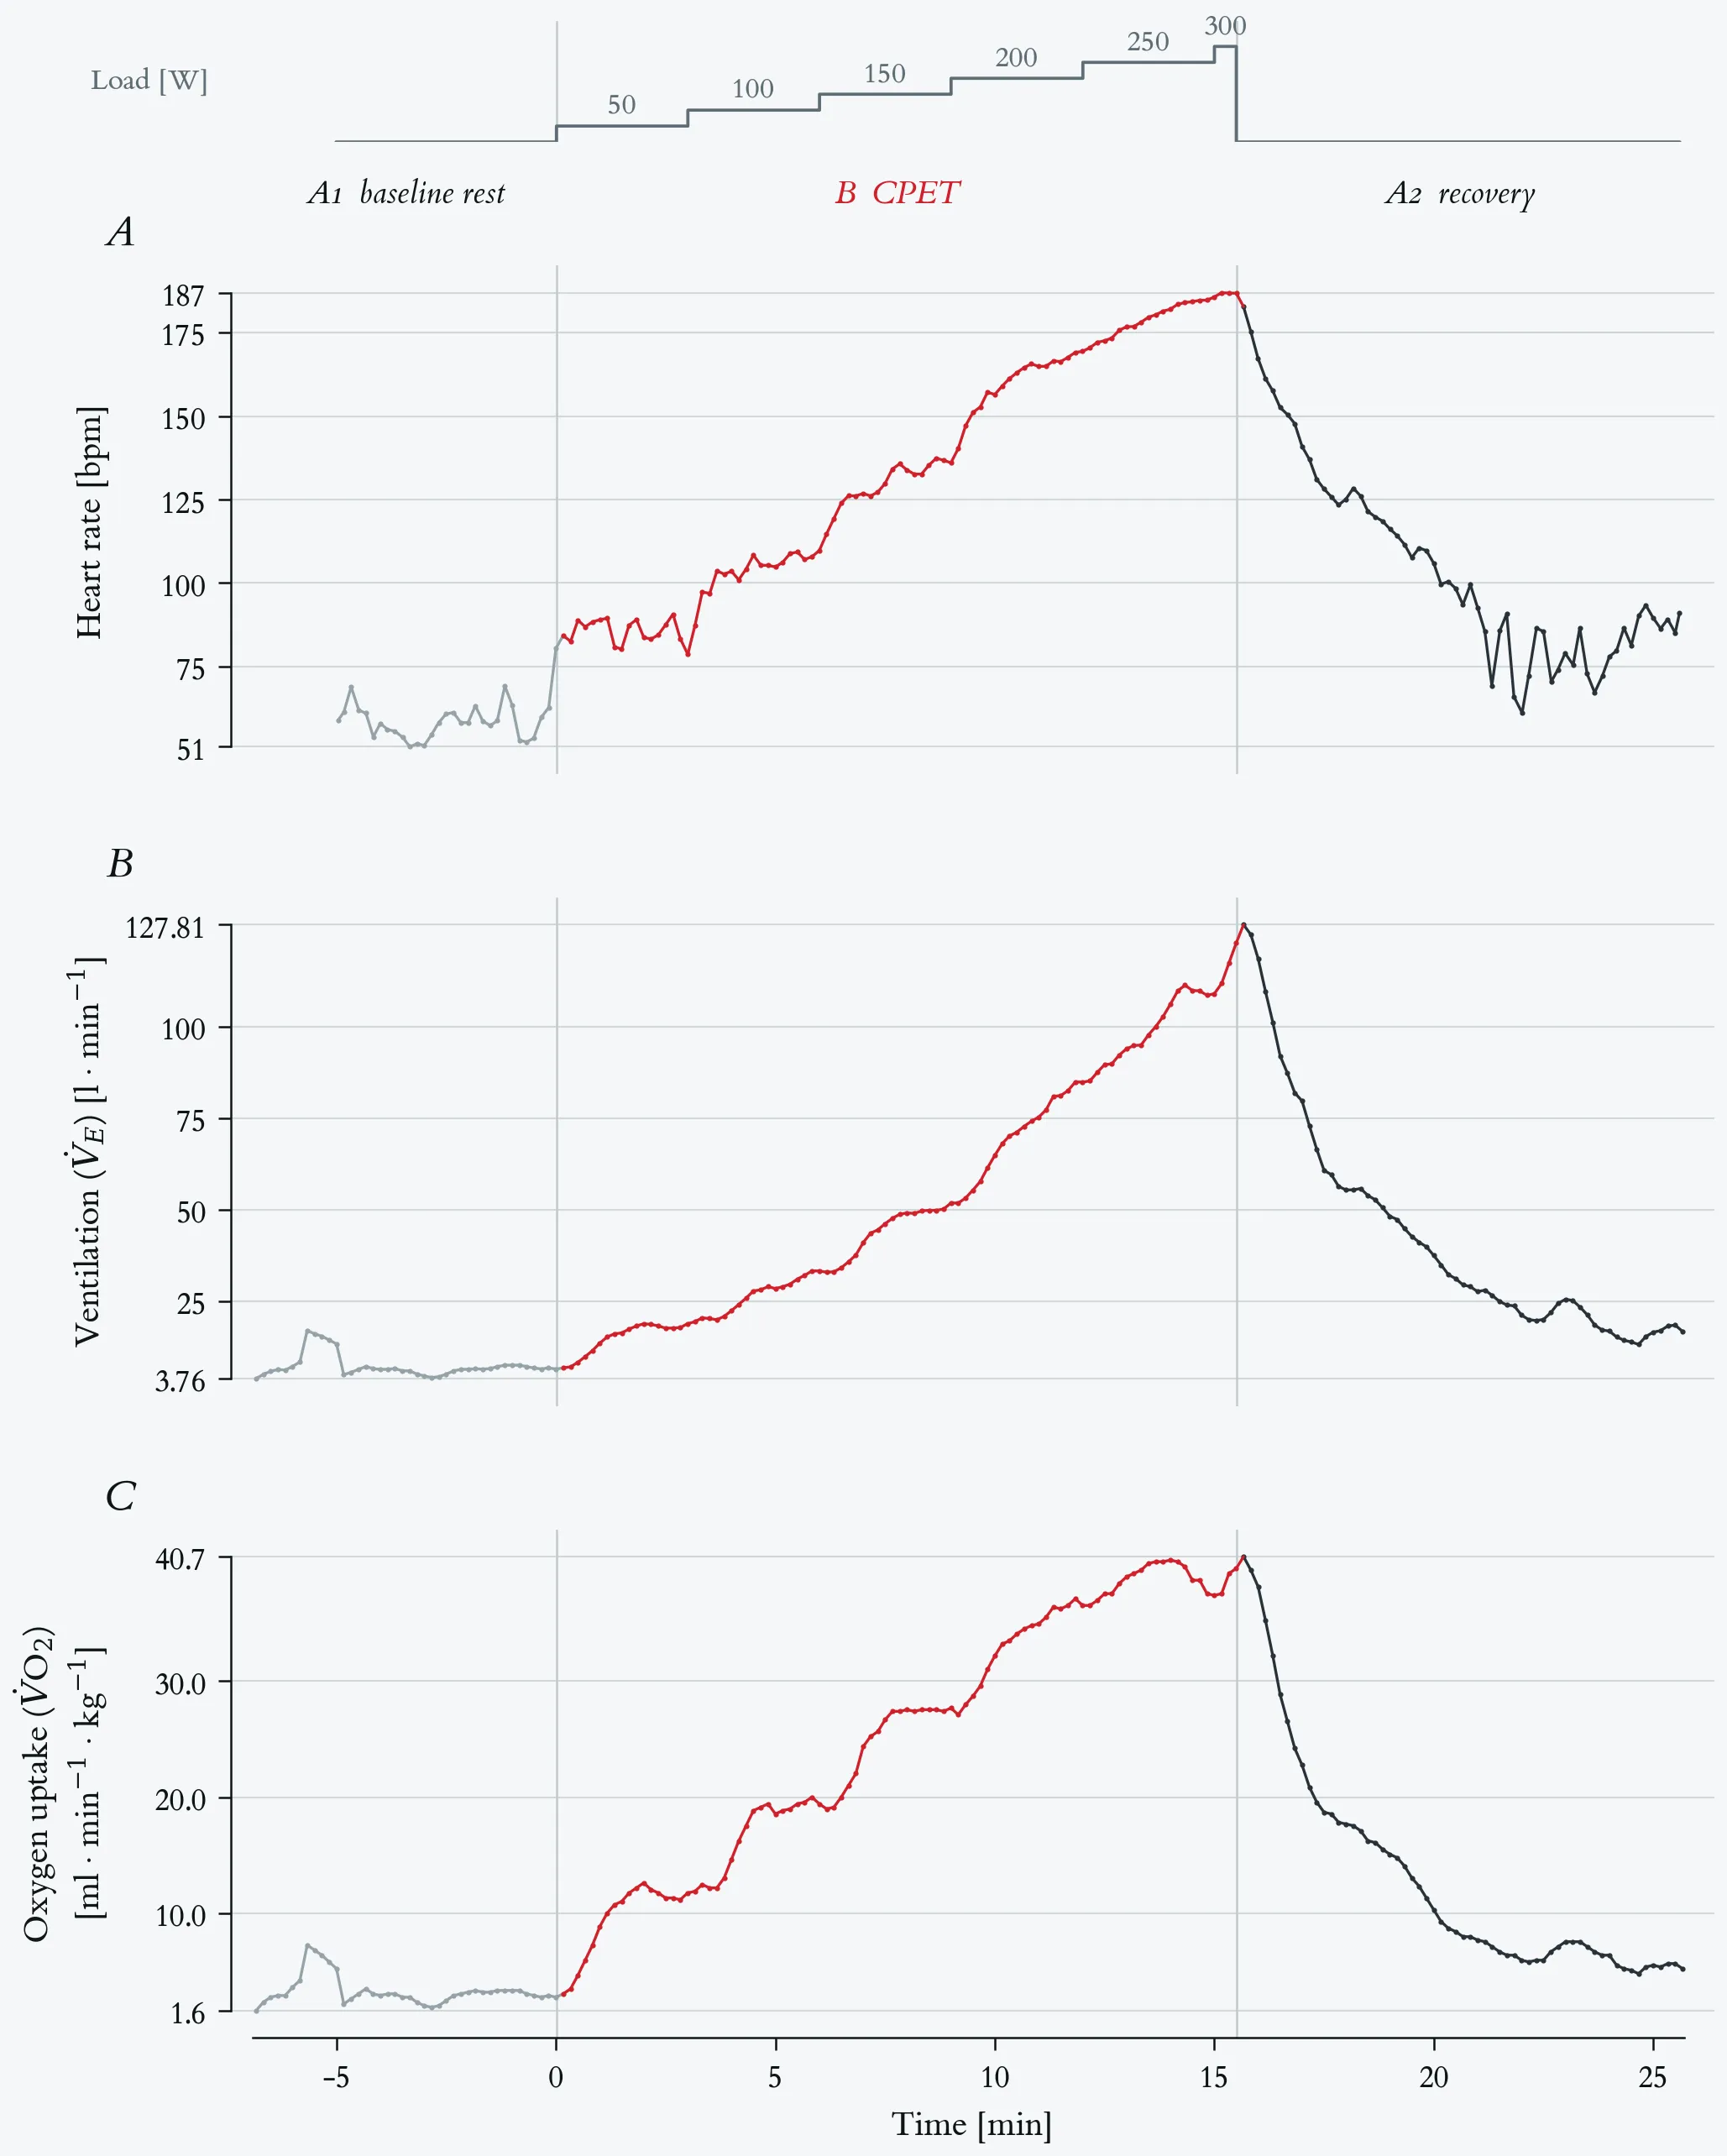
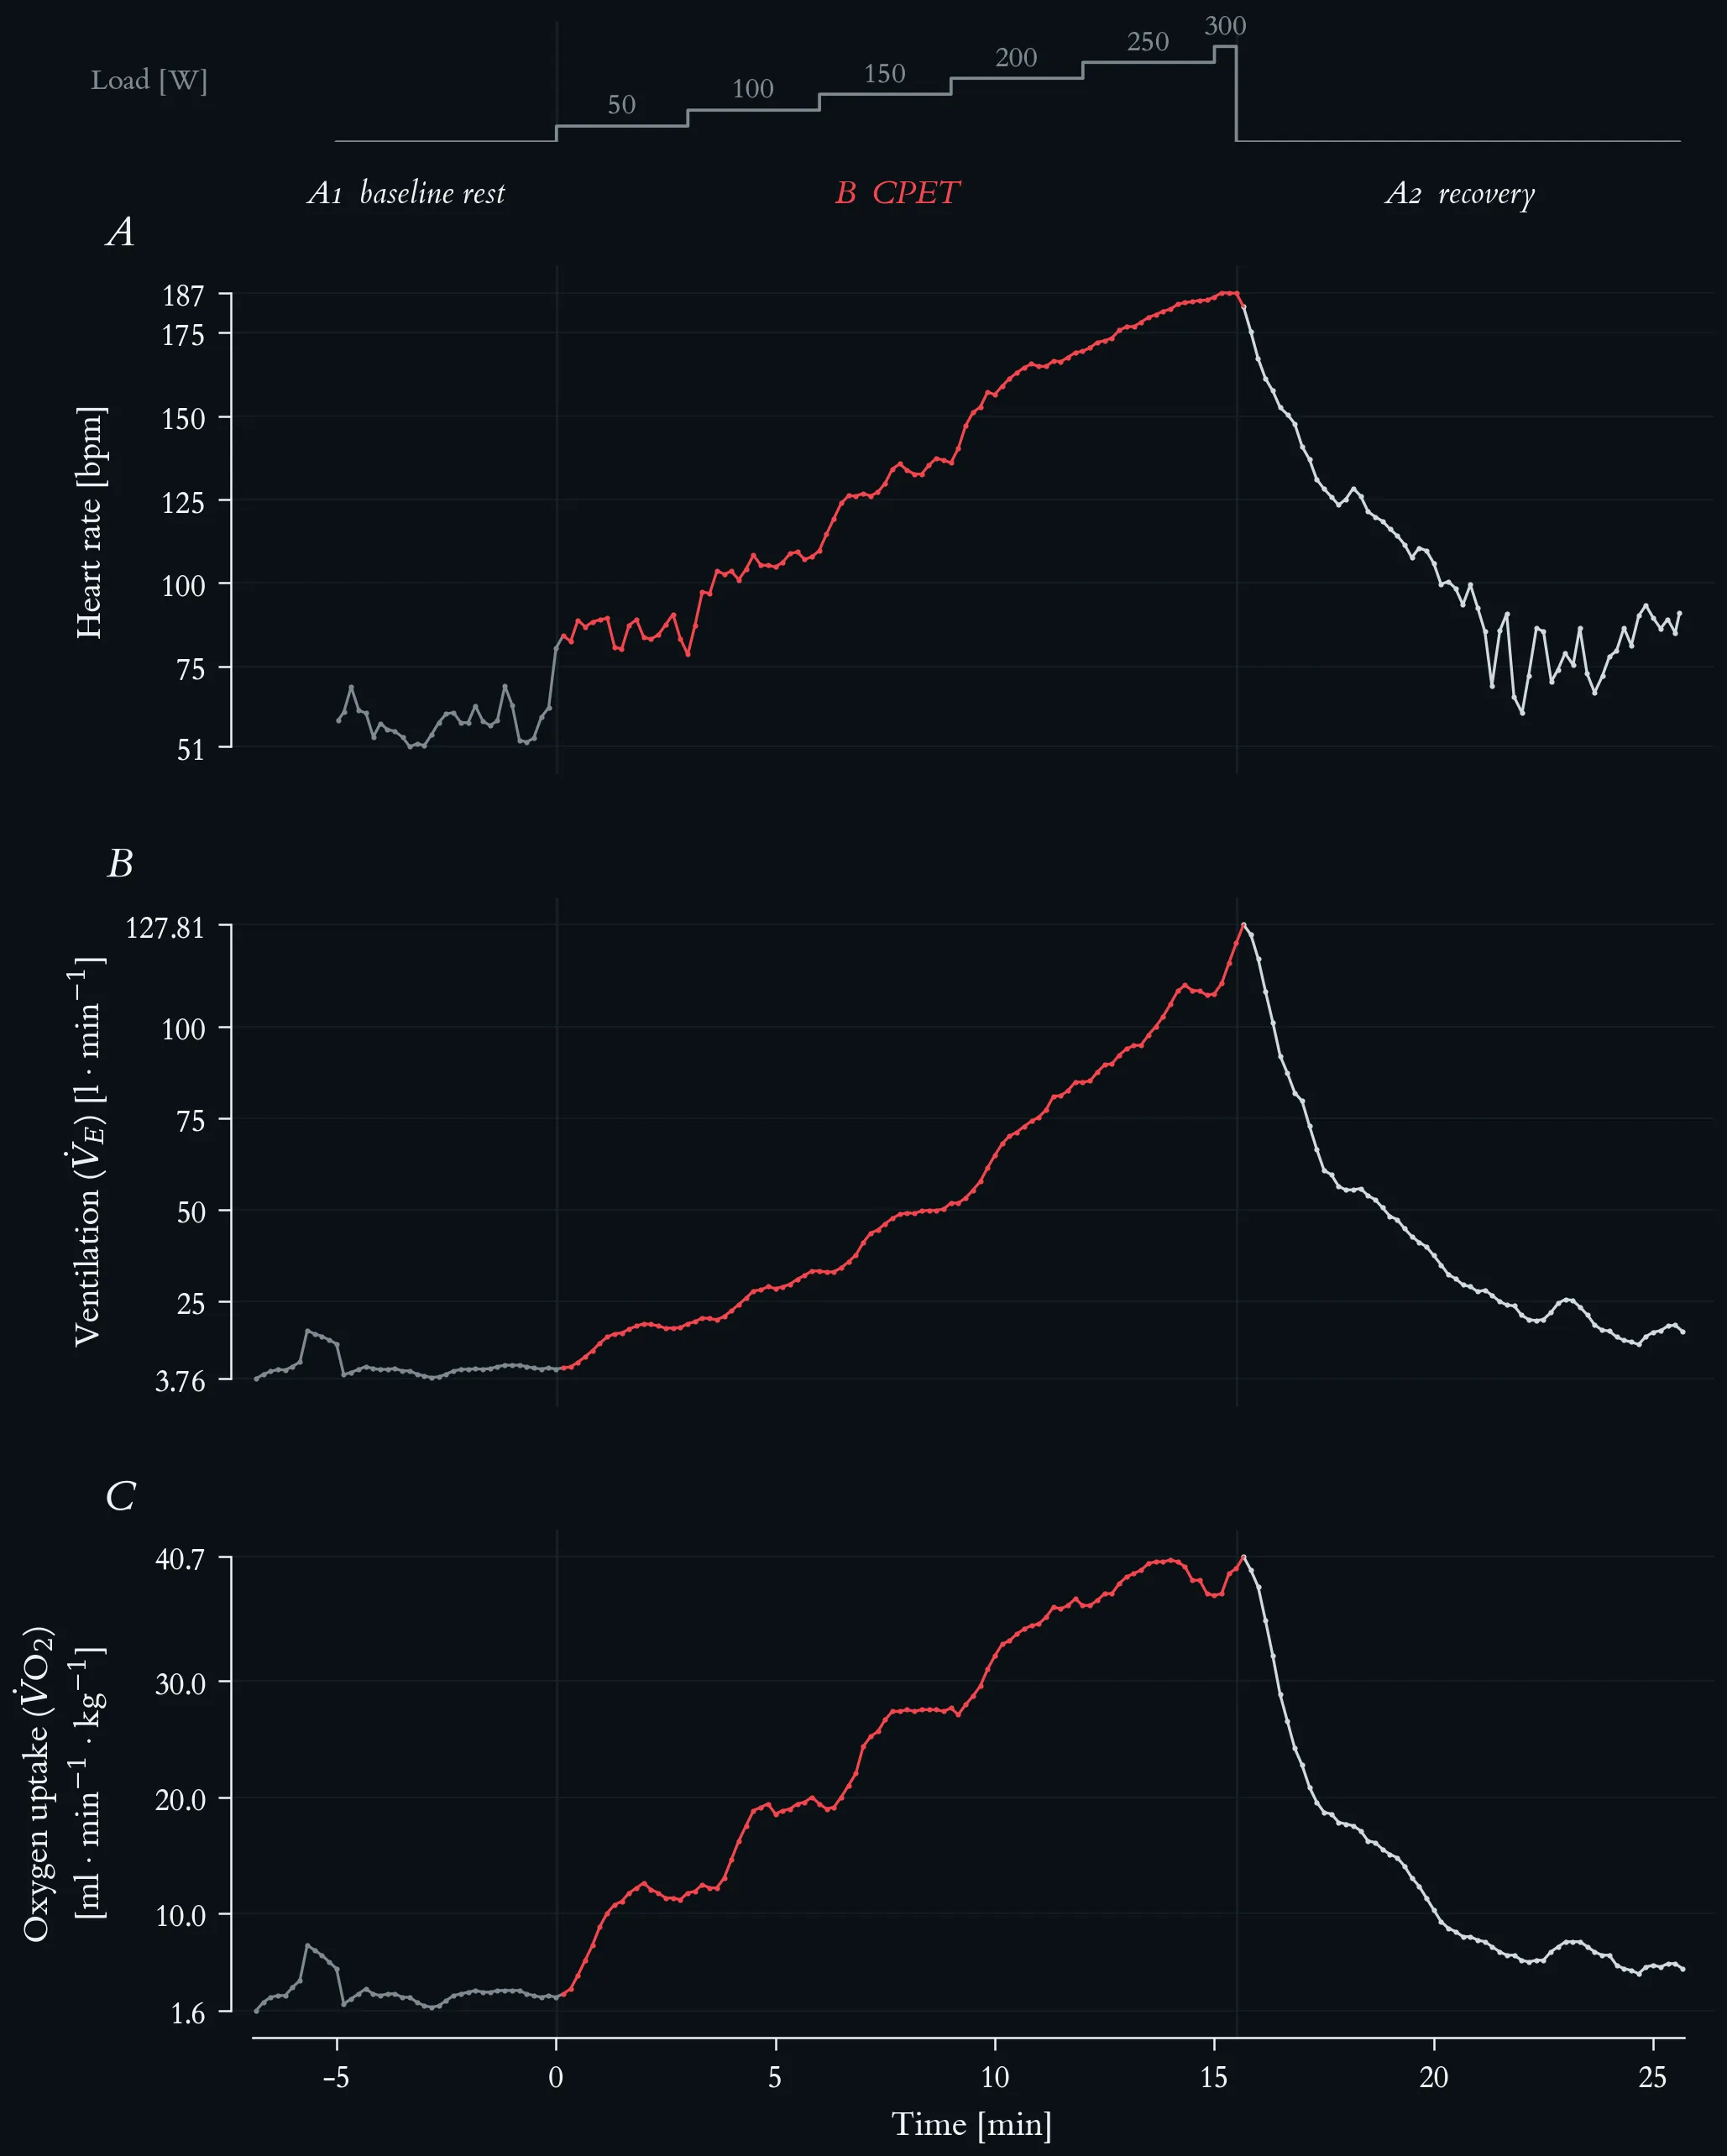
Cardiorespiratory response to a maximal incremental step test, with mass-related oxygen uptake. Top strip: external work rate, incremented by 50 W every three minutes from 50 W to a final 300 W stage terminated after 30 s at volitional exhaustion. Phases are A1 baseline rest, B step test (red) and A2 passive recovery; vertical hairlines mark the two transitions. (A) Heart rate, beat-to-beat recording averaged in 10-s bins, rising from 51 to 187 bpm. (B) Ventilation (V̇E), rising from about 6 l · min⁻¹ at rest to 122.8 l · min⁻¹ at the end of the final stage, with a peak of 127.8 l · min⁻¹ ten seconds after load offset. (C) Mass-related oxygen uptake, V̇O₂ per body mass (69 kg), in ml · min⁻¹ · kg⁻¹. All three series are 10-s averages (197 samples, recording started 6.8 min before load onset).
Beat-to-beat cardiac autonomic response across the ABA exercise protocol. Top strip: external work rate, stepped by 50 W every three minutes from 50 to 300 W. Phases are A1 baseline rest (5.0 min, 293 beats), B CPET (15.5 min, 2059 beats, red), and A2 recovery (10.1 min, 1070 beats); vertical hairlines mark the two transitions. (A) Beat-to-beat RR interval (n = 3422 beats). Mean RR falls from 1029 ms at rest to 452 ms under load and reaches its minimum of 316 ms at exhaustion. (B) Heart rate, the same recording averaged in 10-s bins, rising from 51 to 187 bpm. (C) Successive RR differences (ΔRR), the beat-to-beat change that panel A carries only implicitly. The scatter collapses from ±330 ms at rest to a near-flat band during the ramp — root mean square of successive differences 102 ms in A1, 16.9 ms across B, and 2.6 ms over the final five minutes of loading — and the large excursions return within the first minutes of A2, where isolated beats again differ by more than 300 ms. (D) RSA amplitude: the RMS of the RR oscillation inside a respiration-guided band, f_R ± 0.125 Hz, with f_R taken from the concurrent measured breathing frequency; 60-s windows stepped by 5 s, logarithmic axis. Because breathing frequency rises from 0.22 to 0.98 Hz over this test, the classic high-frequency band (0.15–0.40 Hz) would miss the respiratory peak from the 150 W stage onward and underestimate it by a factor of five at 250 W.
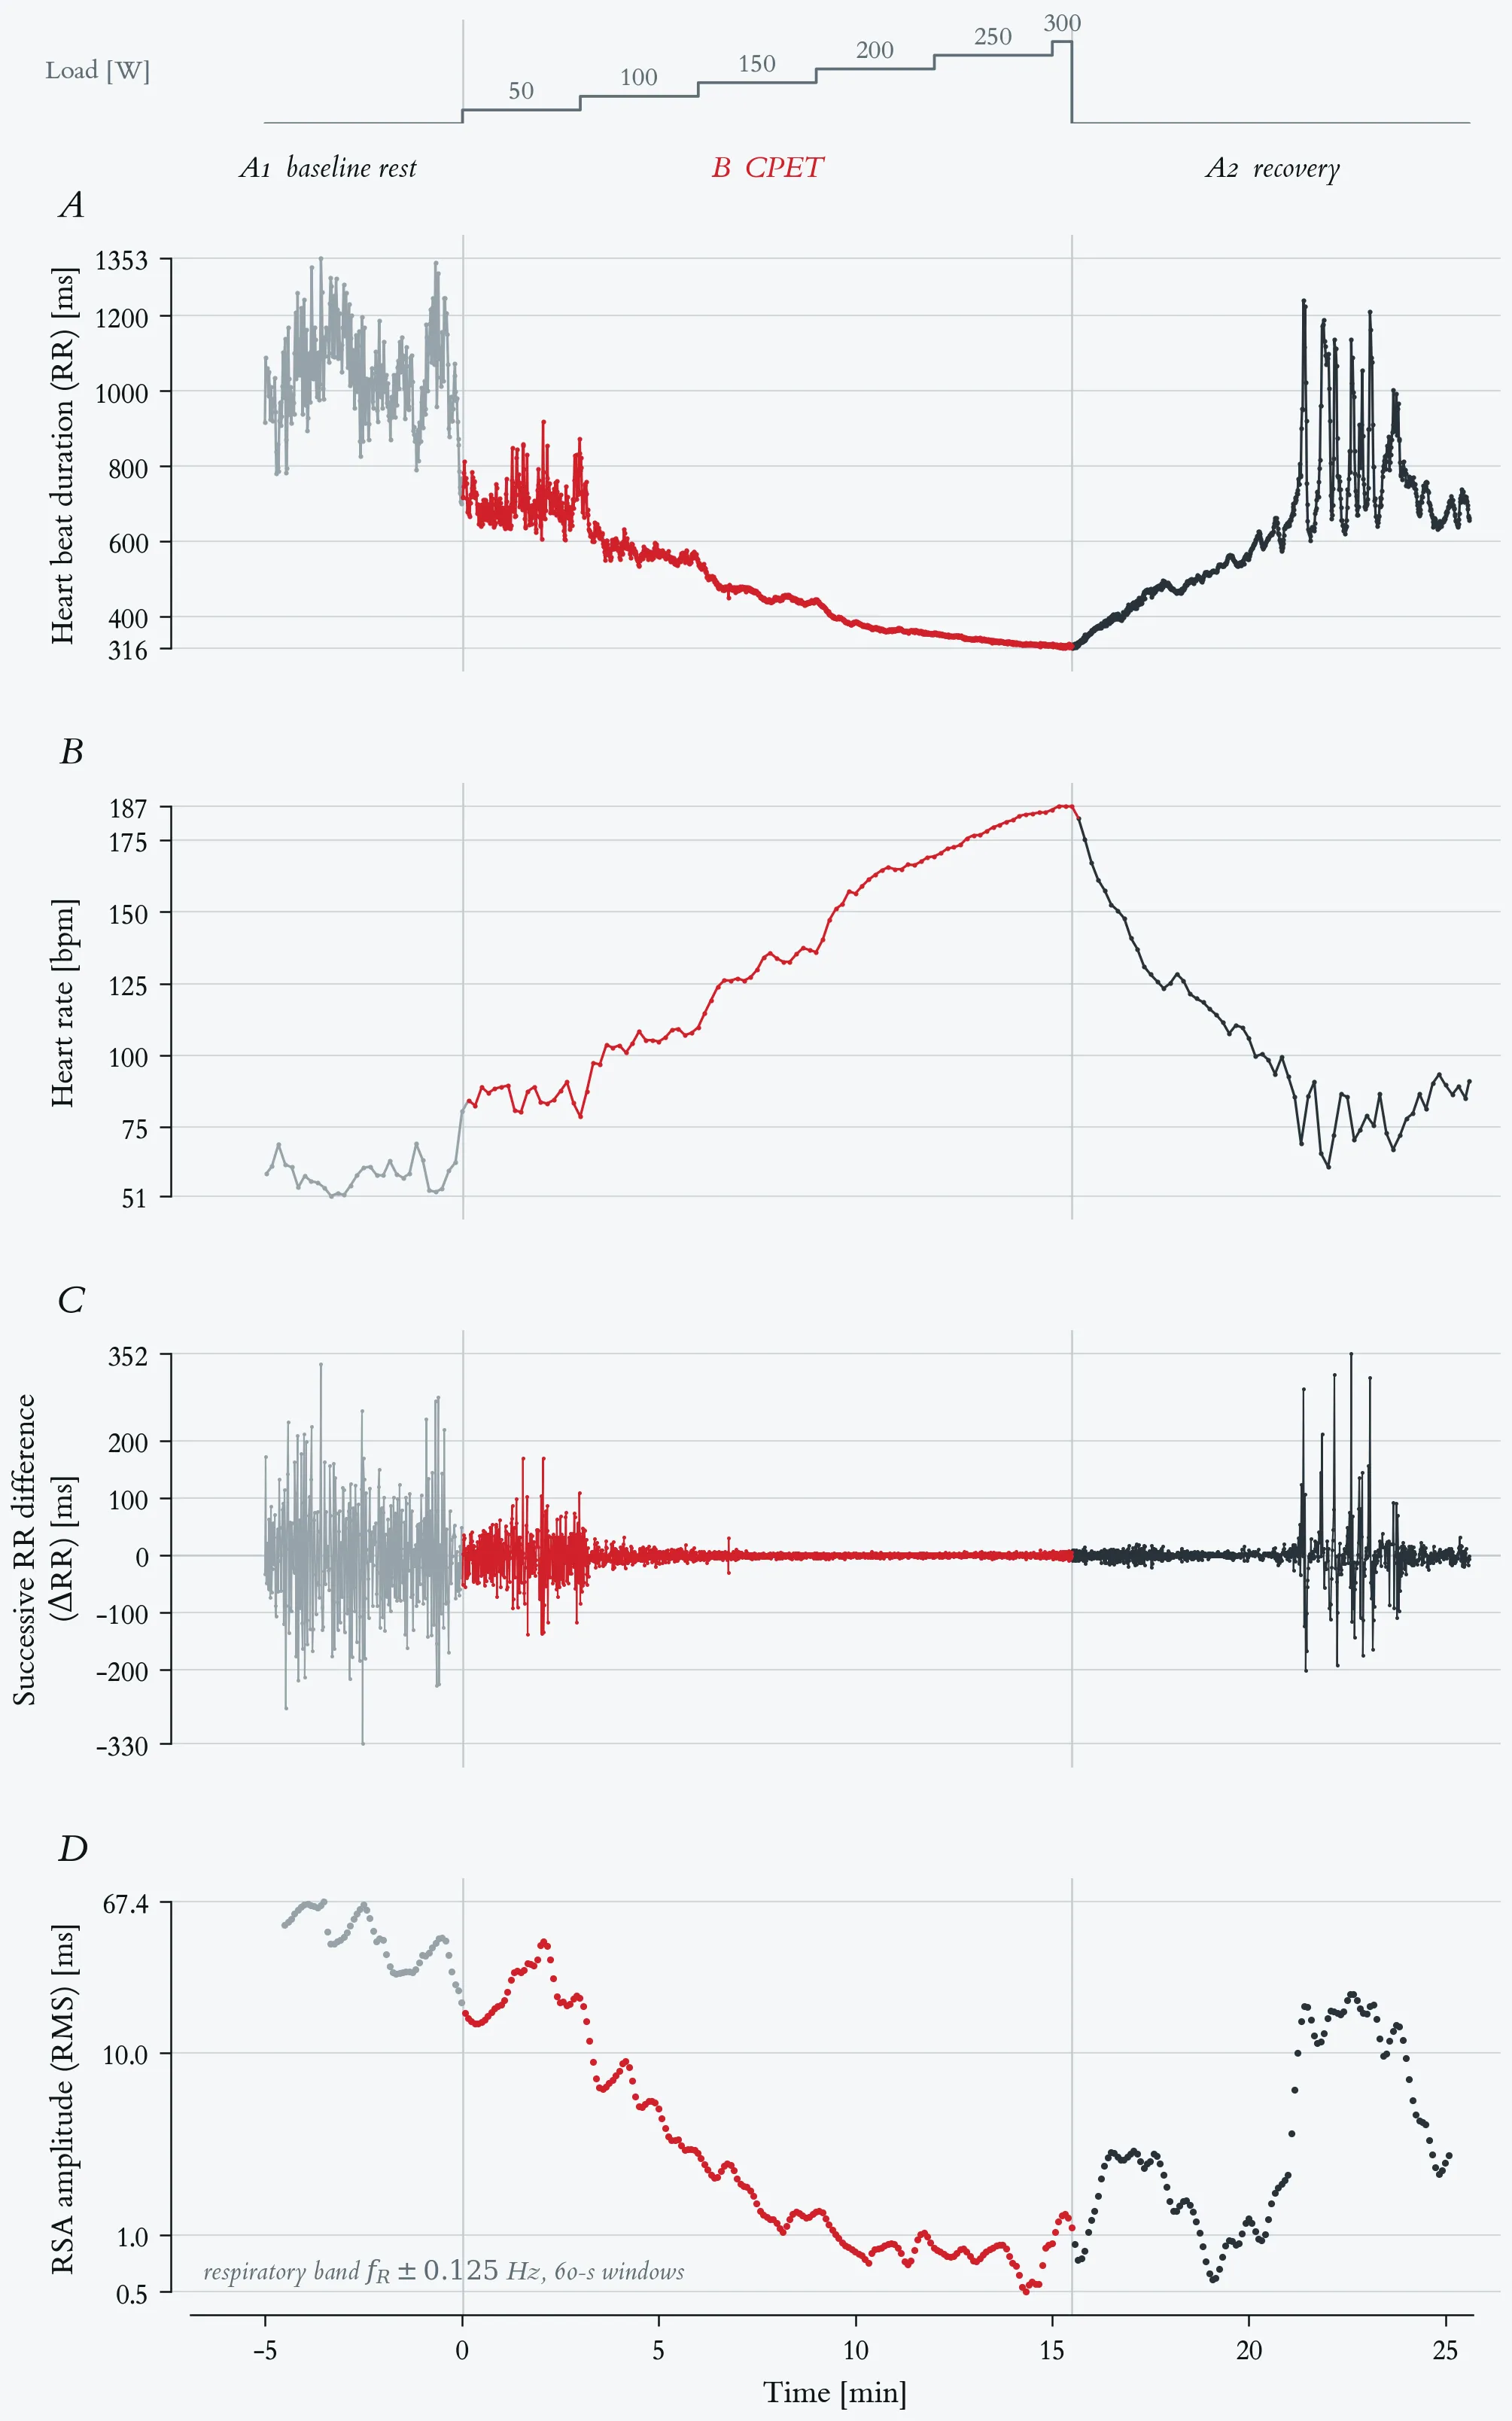
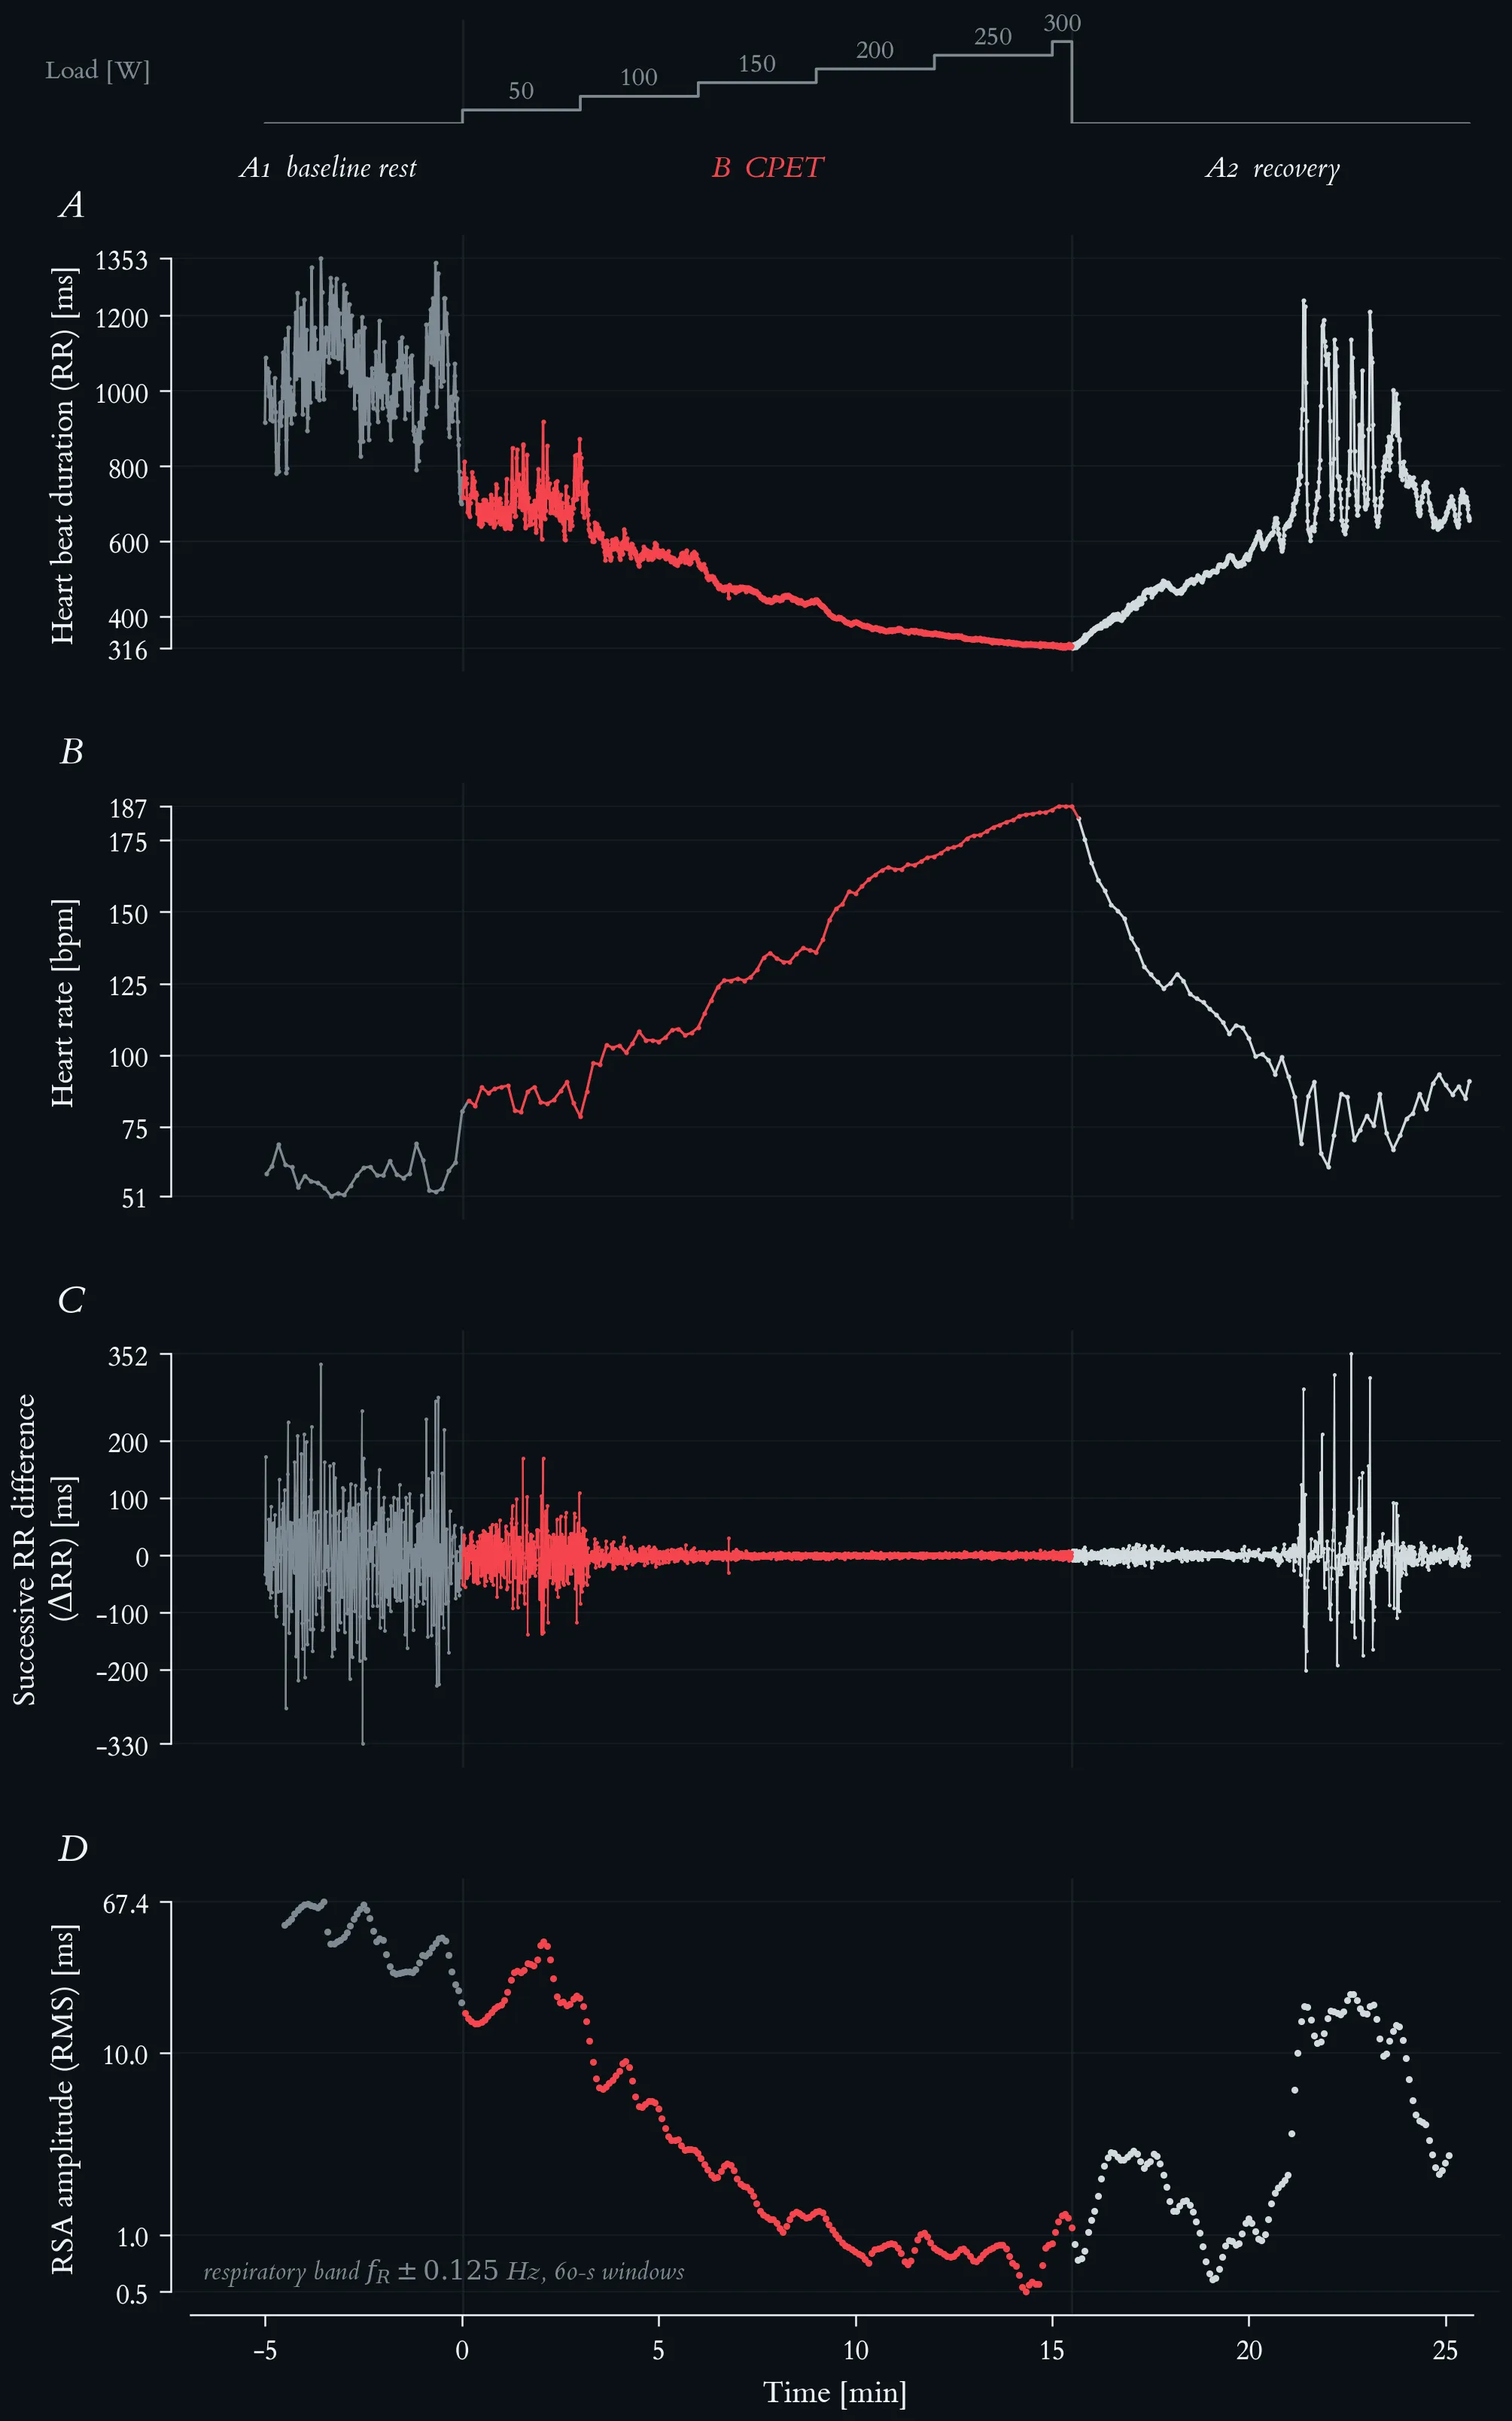
Beat-to-beat cardiac autonomic response across the ABA exercise protocol. Top strip: external work rate, stepped by 50 W every three minutes from 50 to 300 W. Phases are A1 baseline rest (5.0 min, 293 beats), B CPET (15.5 min, 2059 beats, red), and A2 recovery (10.1 min, 1070 beats); vertical hairlines mark the two transitions. (A) Beat-to-beat RR interval (n = 3422 beats). Mean RR falls from 1029 ms at rest to 452 ms under load and reaches its minimum of 316 ms at exhaustion. (B) Heart rate, the same recording averaged in 10-s bins, rising from 51 to 187 bpm. (C) Successive RR differences (ΔRR), the beat-to-beat change that panel A carries only implicitly. The scatter collapses from ±330 ms at rest to a near-flat band during the ramp — root mean square of successive differences 102 ms in A1, 16.9 ms across B, and 2.6 ms over the final five minutes of loading — and the large excursions return within the first minutes of A2, where isolated beats again differ by more than 300 ms. (D) RSA amplitude: the RMS of the RR oscillation inside a respiration-guided band, f_R ± 0.125 Hz, with f_R taken from the concurrent measured breathing frequency; 60-s windows stepped by 5 s, logarithmic axis. Because breathing frequency rises from 0.22 to 0.98 Hz over this test, the classic high-frequency band (0.15–0.40 Hz) would miss the respiratory peak from the 150 W stage onward and underestimate it by a factor of five at 250 W.
Breathing frequency across the maximal incremental step test. Top strip: external work rate, incremented by 50 W every three minutes from 50 W to a final 300 W stage terminated after 30 s at volitional exhaustion. Lactate-based reference loads: aerobic threshold 117 W, individual anaerobic threshold 145 W. Phases are A1 baseline rest, B step test (red) and A2 passive recovery; vertical hairlines mark the two transitions. Breathing frequency (fb) as 10-s averages from the metabolic cart, 196 samples.
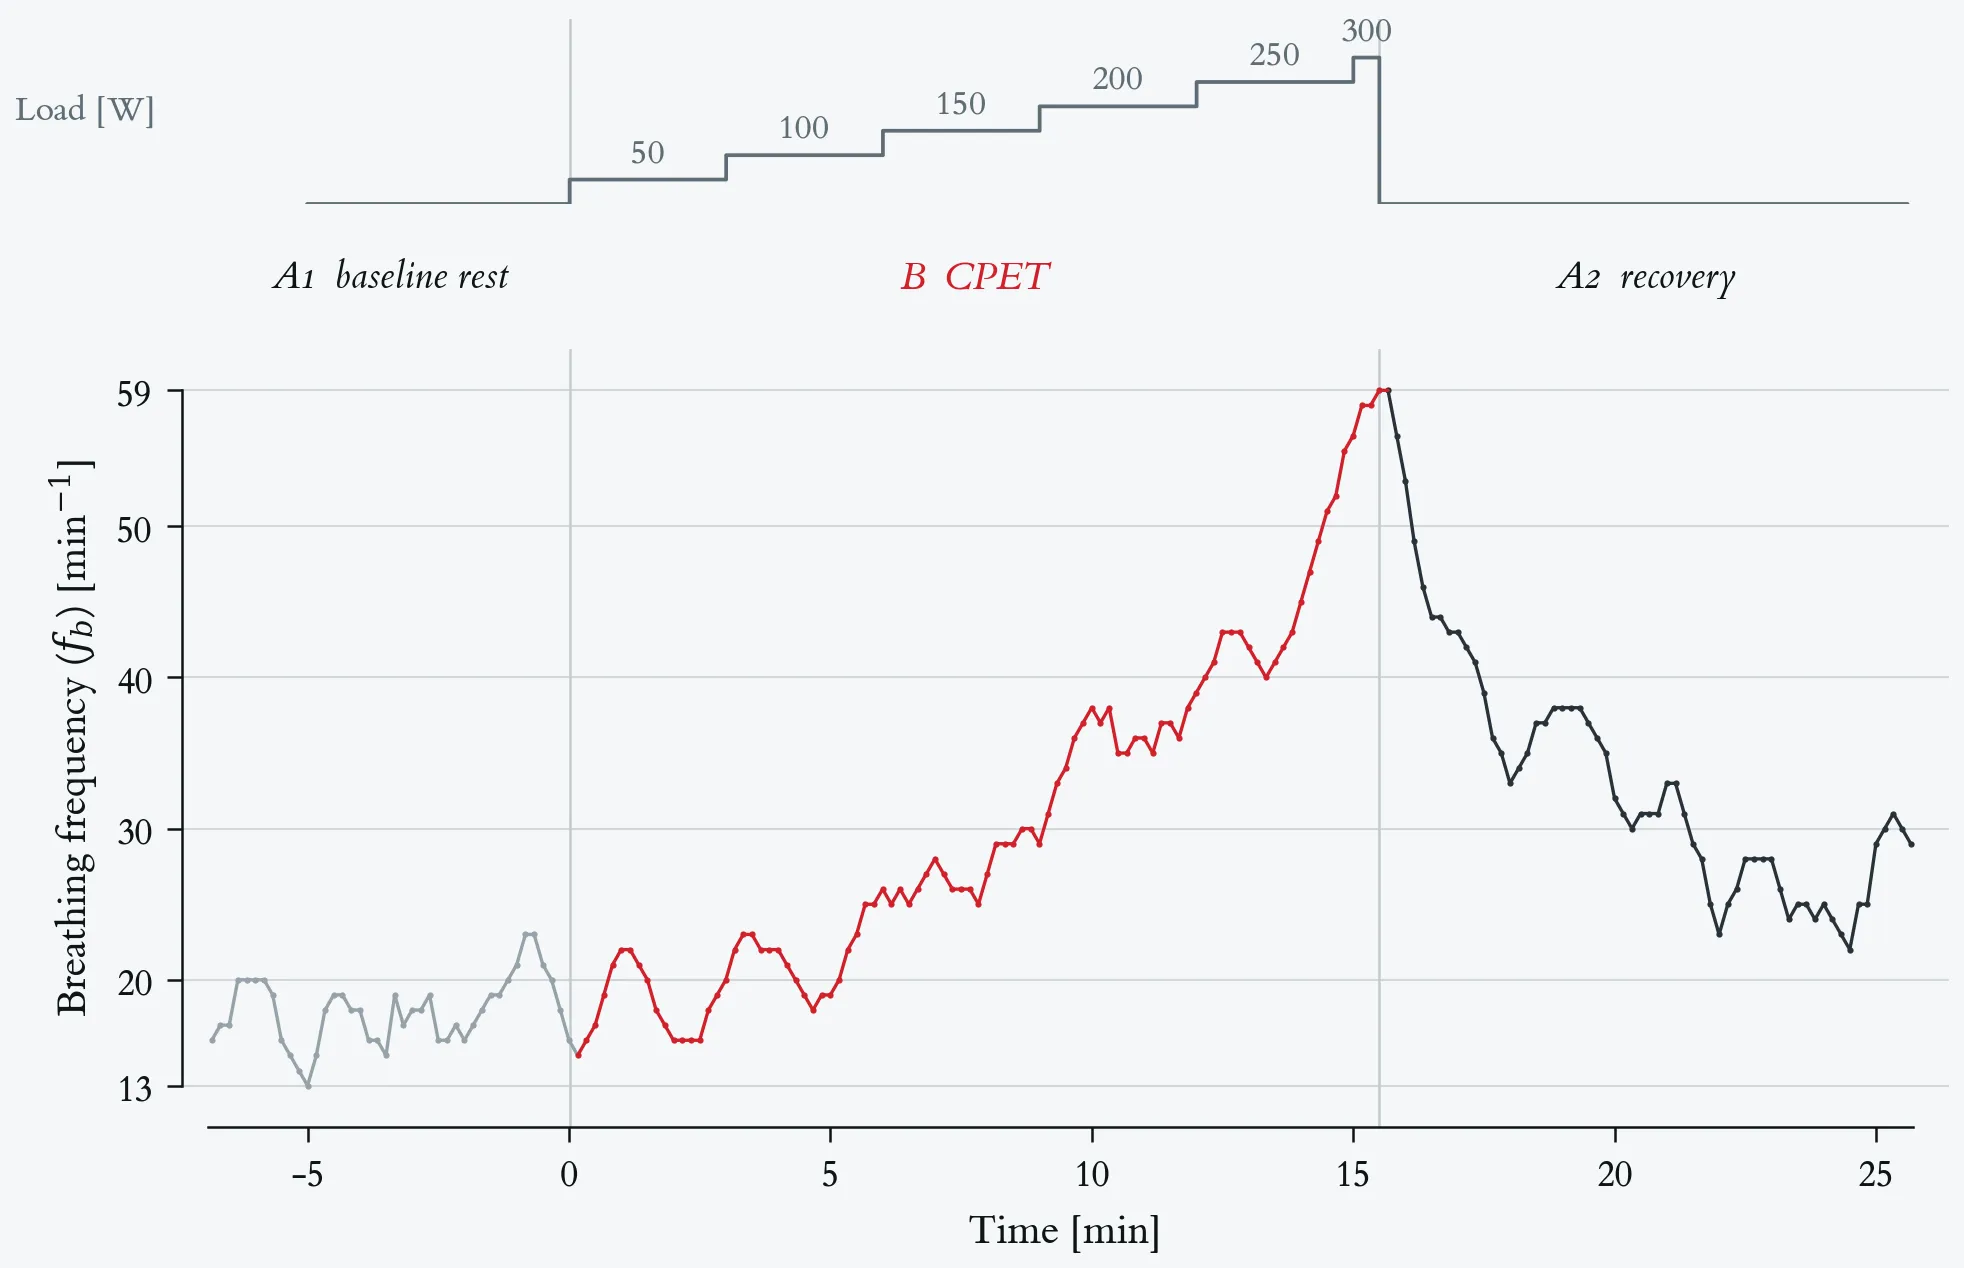
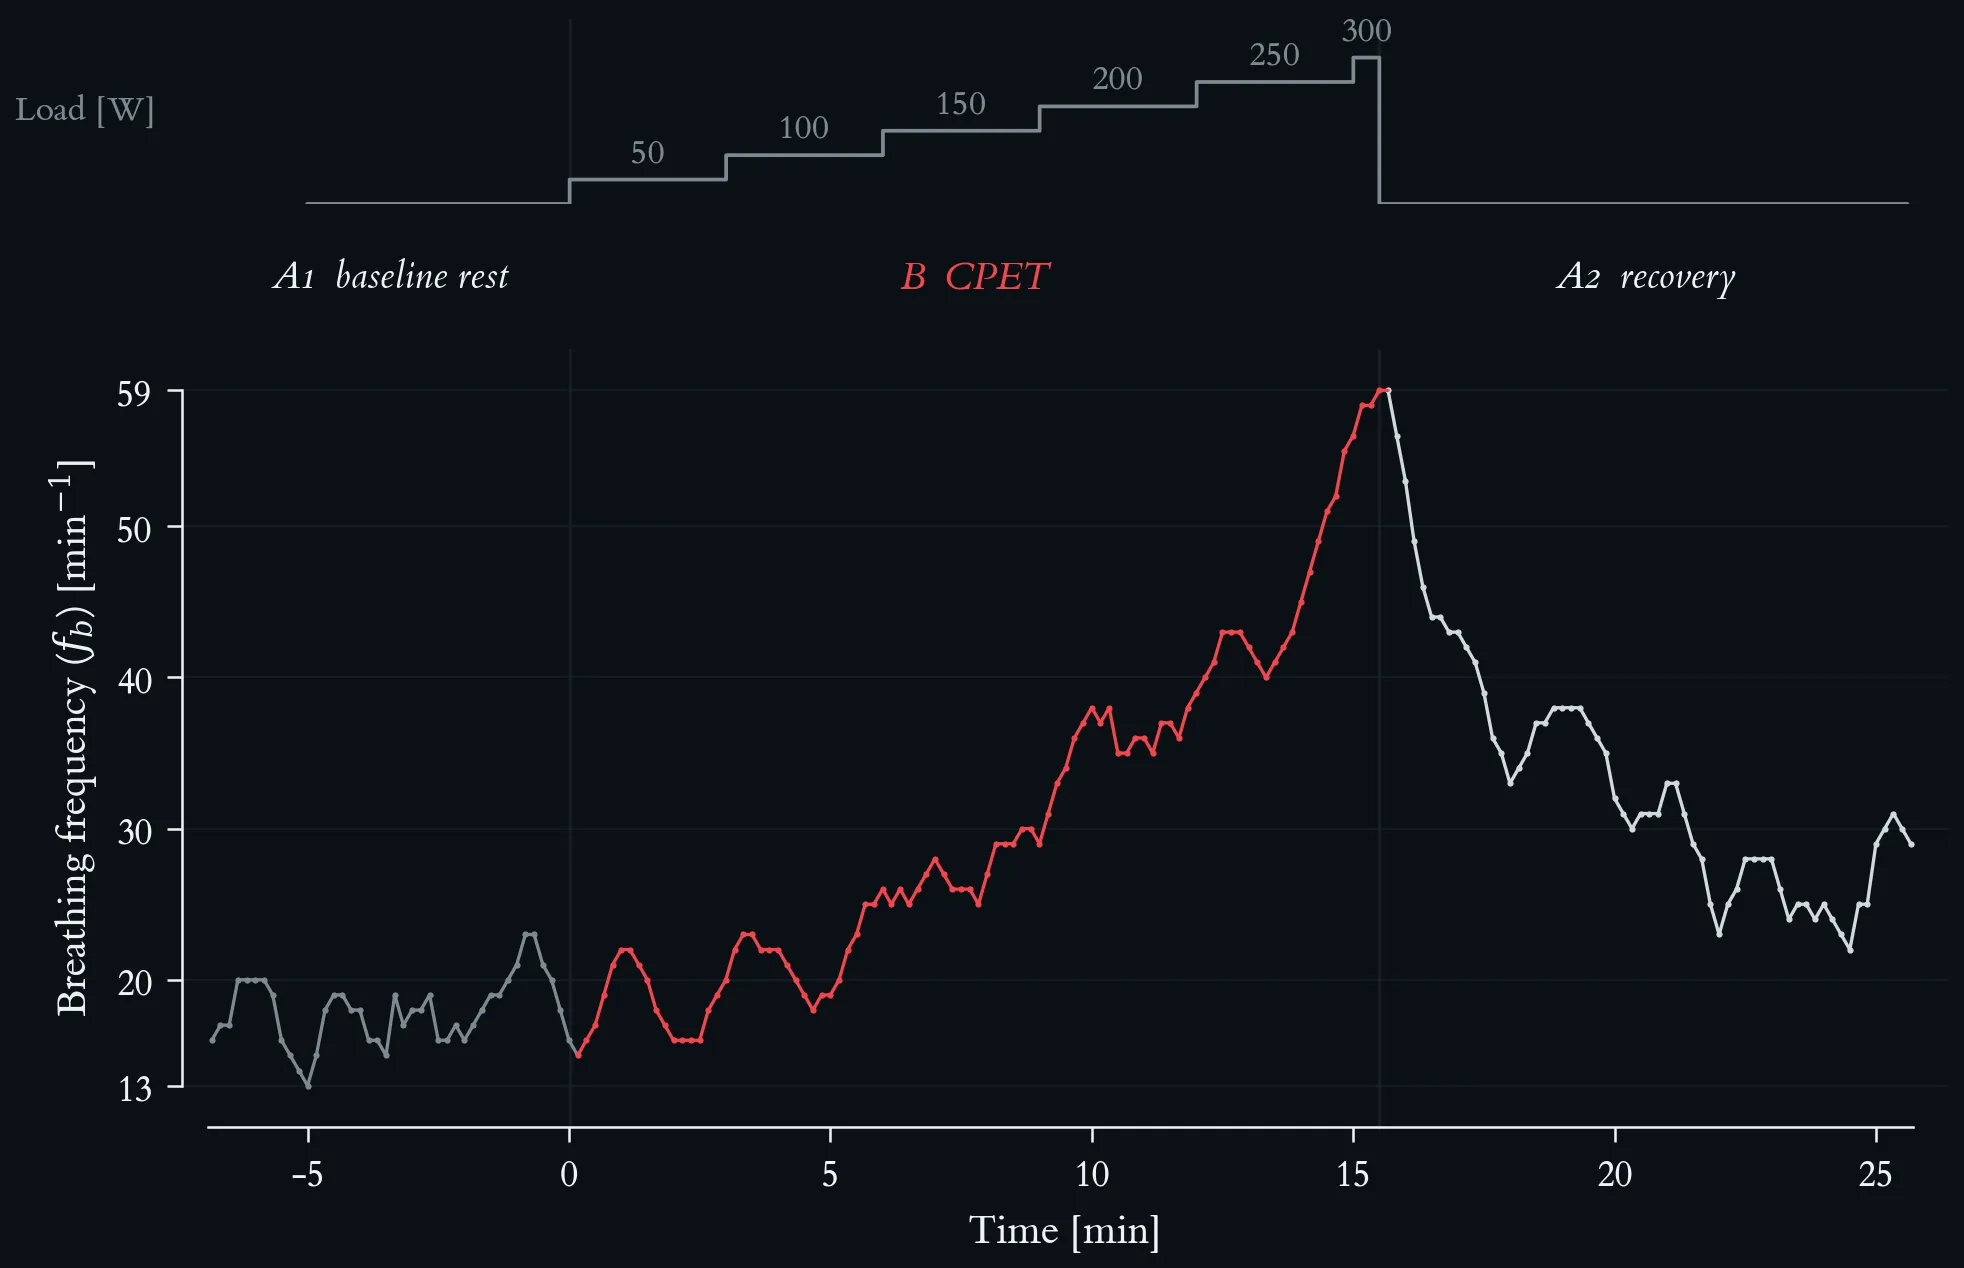
Breathing frequency across the maximal incremental step test. Top strip: external work rate, incremented by 50 W every three minutes from 50 W to a final 300 W stage terminated after 30 s at volitional exhaustion. Lactate-based reference loads: aerobic threshold 117 W, individual anaerobic threshold 145 W. Phases are A1 baseline rest, B step test (red) and A2 passive recovery; vertical hairlines mark the two transitions. Breathing frequency (fb) as 10-s averages from the metabolic cart, 196 samples.
Mass-related oxygen uptake and respiratory exchange ratio across the maximal incremental step test. Top strip: external work rate, incremented by 50 W every three minutes from 50 W to a final 300 W stage terminated after 30 s at volitional exhaustion. Lactate-based reference loads: aerobic threshold 117 W, individual anaerobic threshold 145 W. Phases are A1 baseline rest, B step test (red) and A2 passive recovery; vertical hairlines mark the two transitions. Both series are 10-s averages from the metabolic cart, 196 samples. (A) Mass-related oxygen uptake, V̇O₂ per body mass (69 kg), in ml · min⁻¹ · kg⁻¹, rising from 2.8 at rest to a peak of 40.7 in the first recovery sample. (B) Respiratory exchange ratio (RER), with a hairline at 1.00.
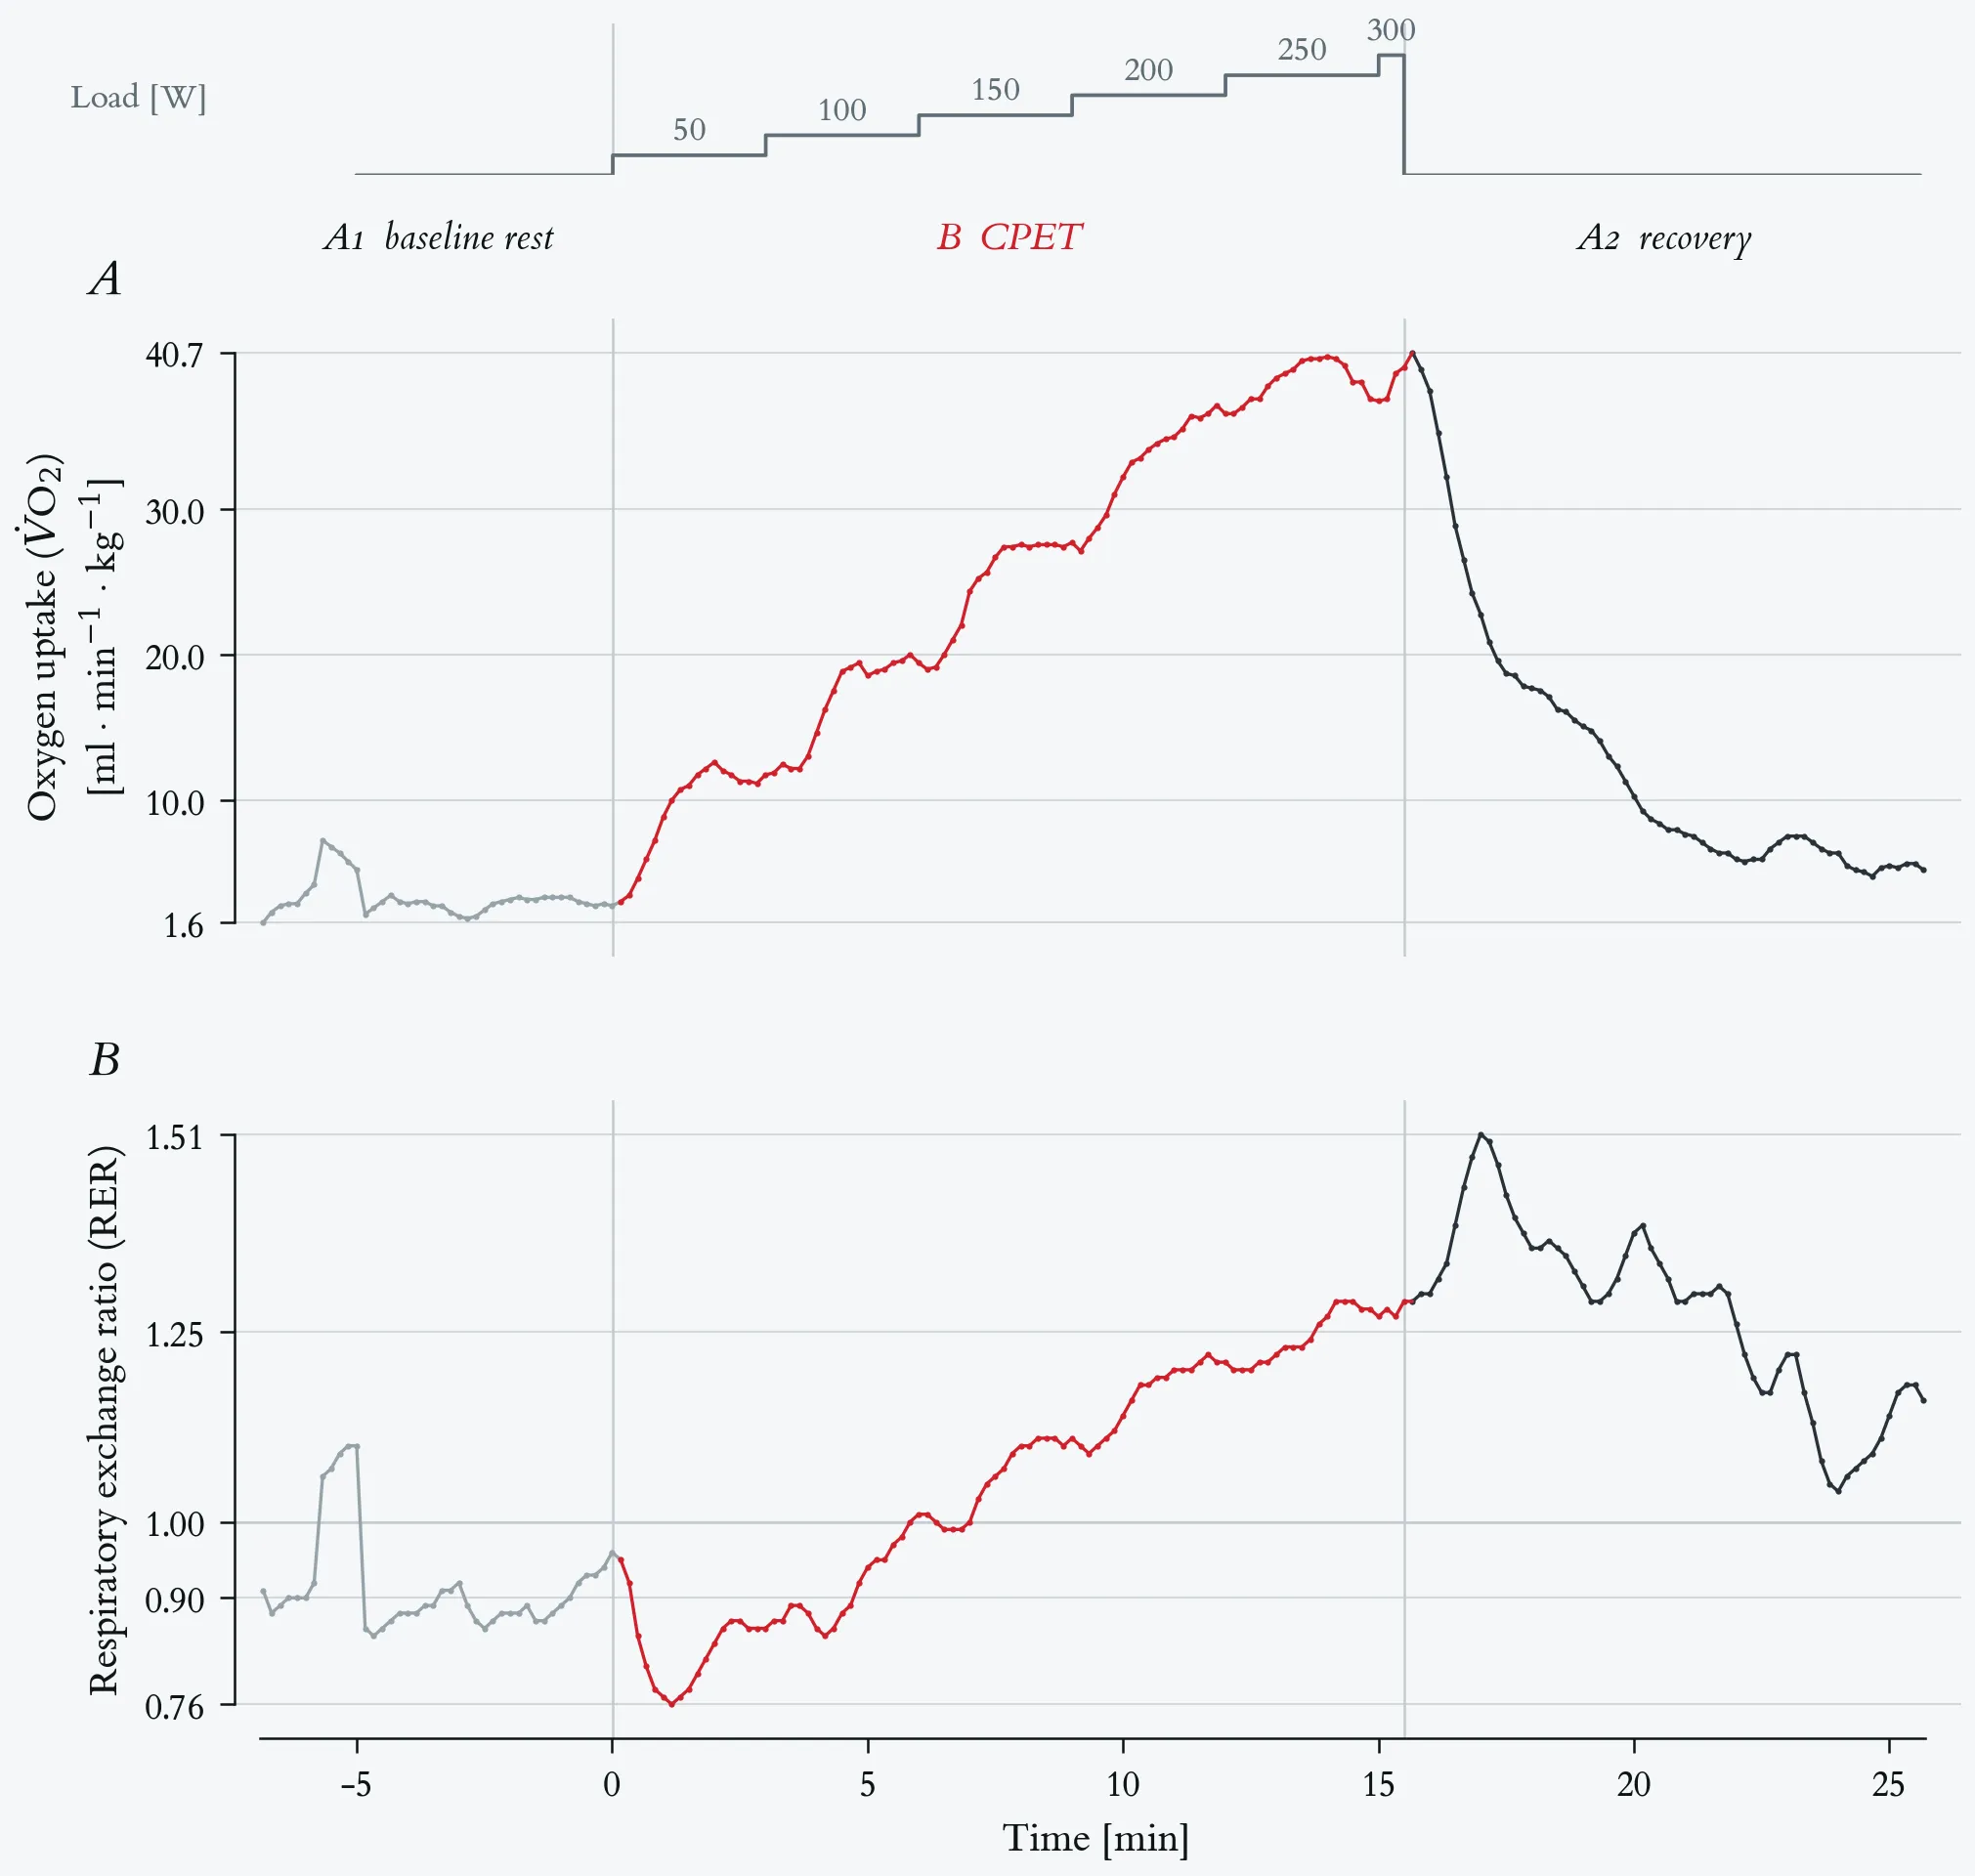
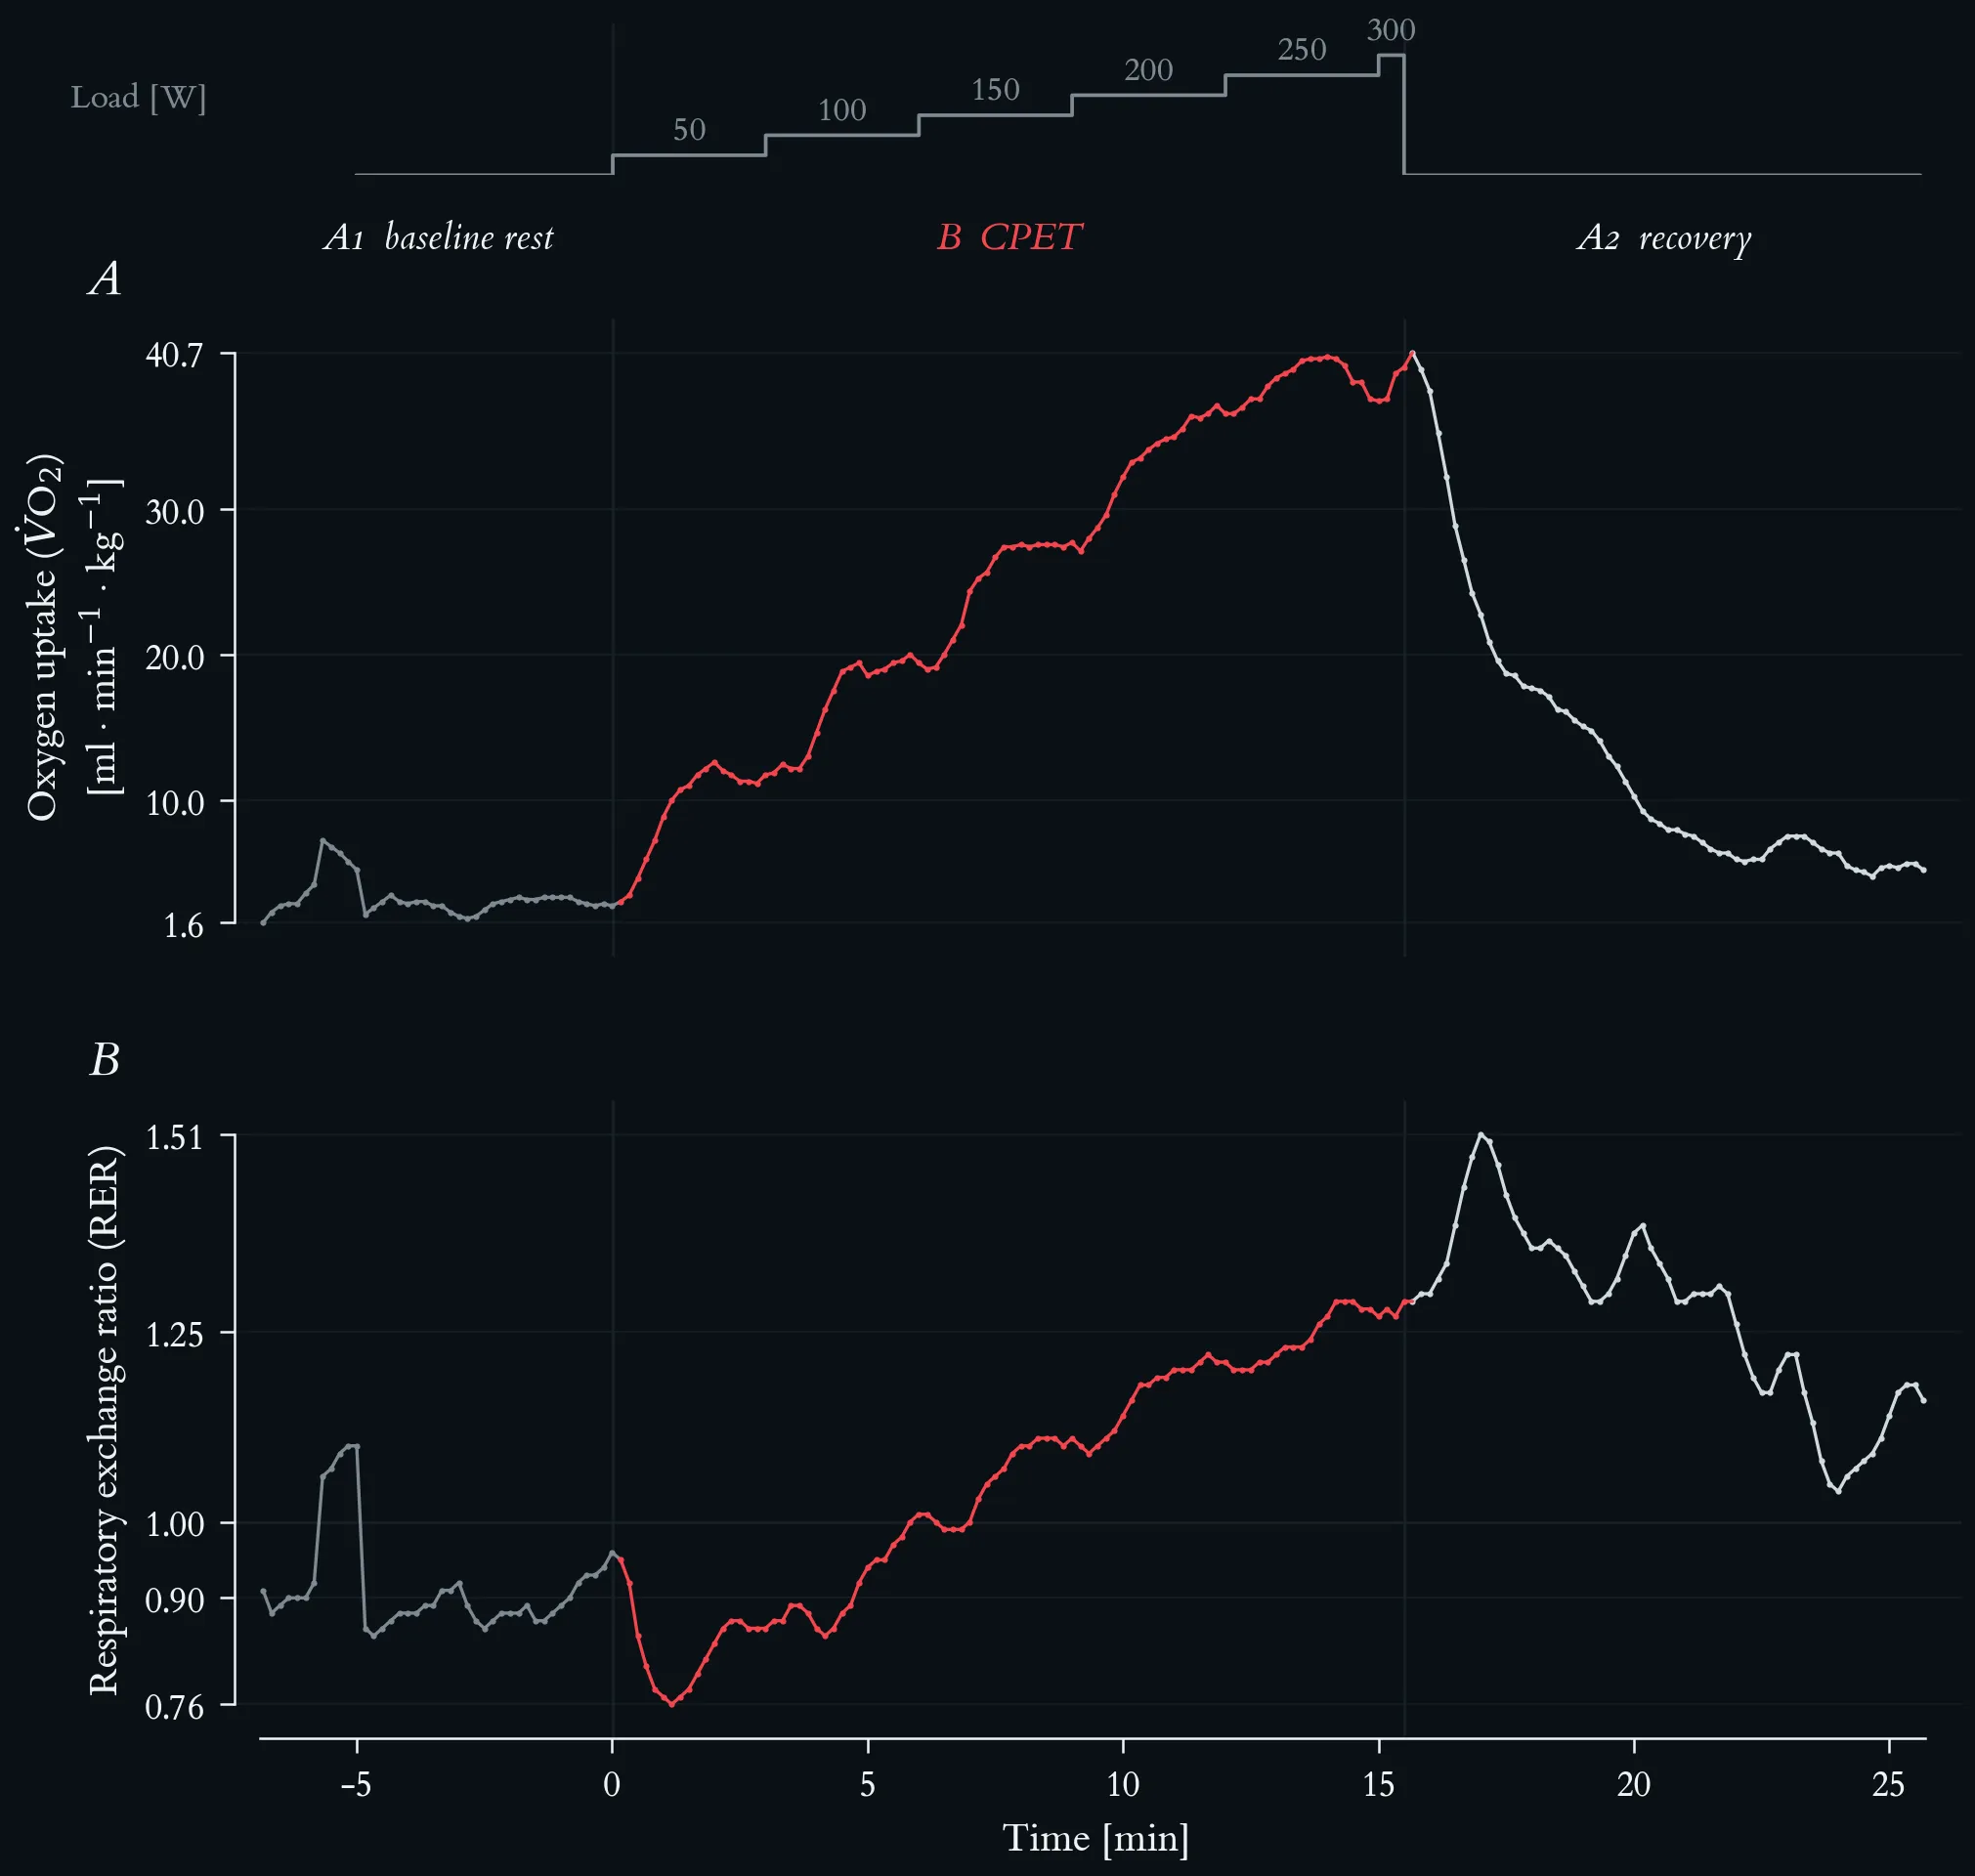
Mass-related oxygen uptake and respiratory exchange ratio across the maximal incremental step test. Top strip: external work rate, incremented by 50 W every three minutes from 50 W to a final 300 W stage terminated after 30 s at volitional exhaustion. Lactate-based reference loads: aerobic threshold 117 W, individual anaerobic threshold 145 W. Phases are A1 baseline rest, B step test (red) and A2 passive recovery; vertical hairlines mark the two transitions. Both series are 10-s averages from the metabolic cart, 196 samples. (A) Mass-related oxygen uptake, V̇O₂ per body mass (69 kg), in ml · min⁻¹ · kg⁻¹, rising from 2.8 at rest to a peak of 40.7 in the first recovery sample. (B) Respiratory exchange ratio (RER), with a hairline at 1.00.
Homeostasis time-course: the IL-6 peak, delayed IL-10/IL-1Ra counter-response, functional capacity dip, and the set-point reference line, with annotated phase zones.
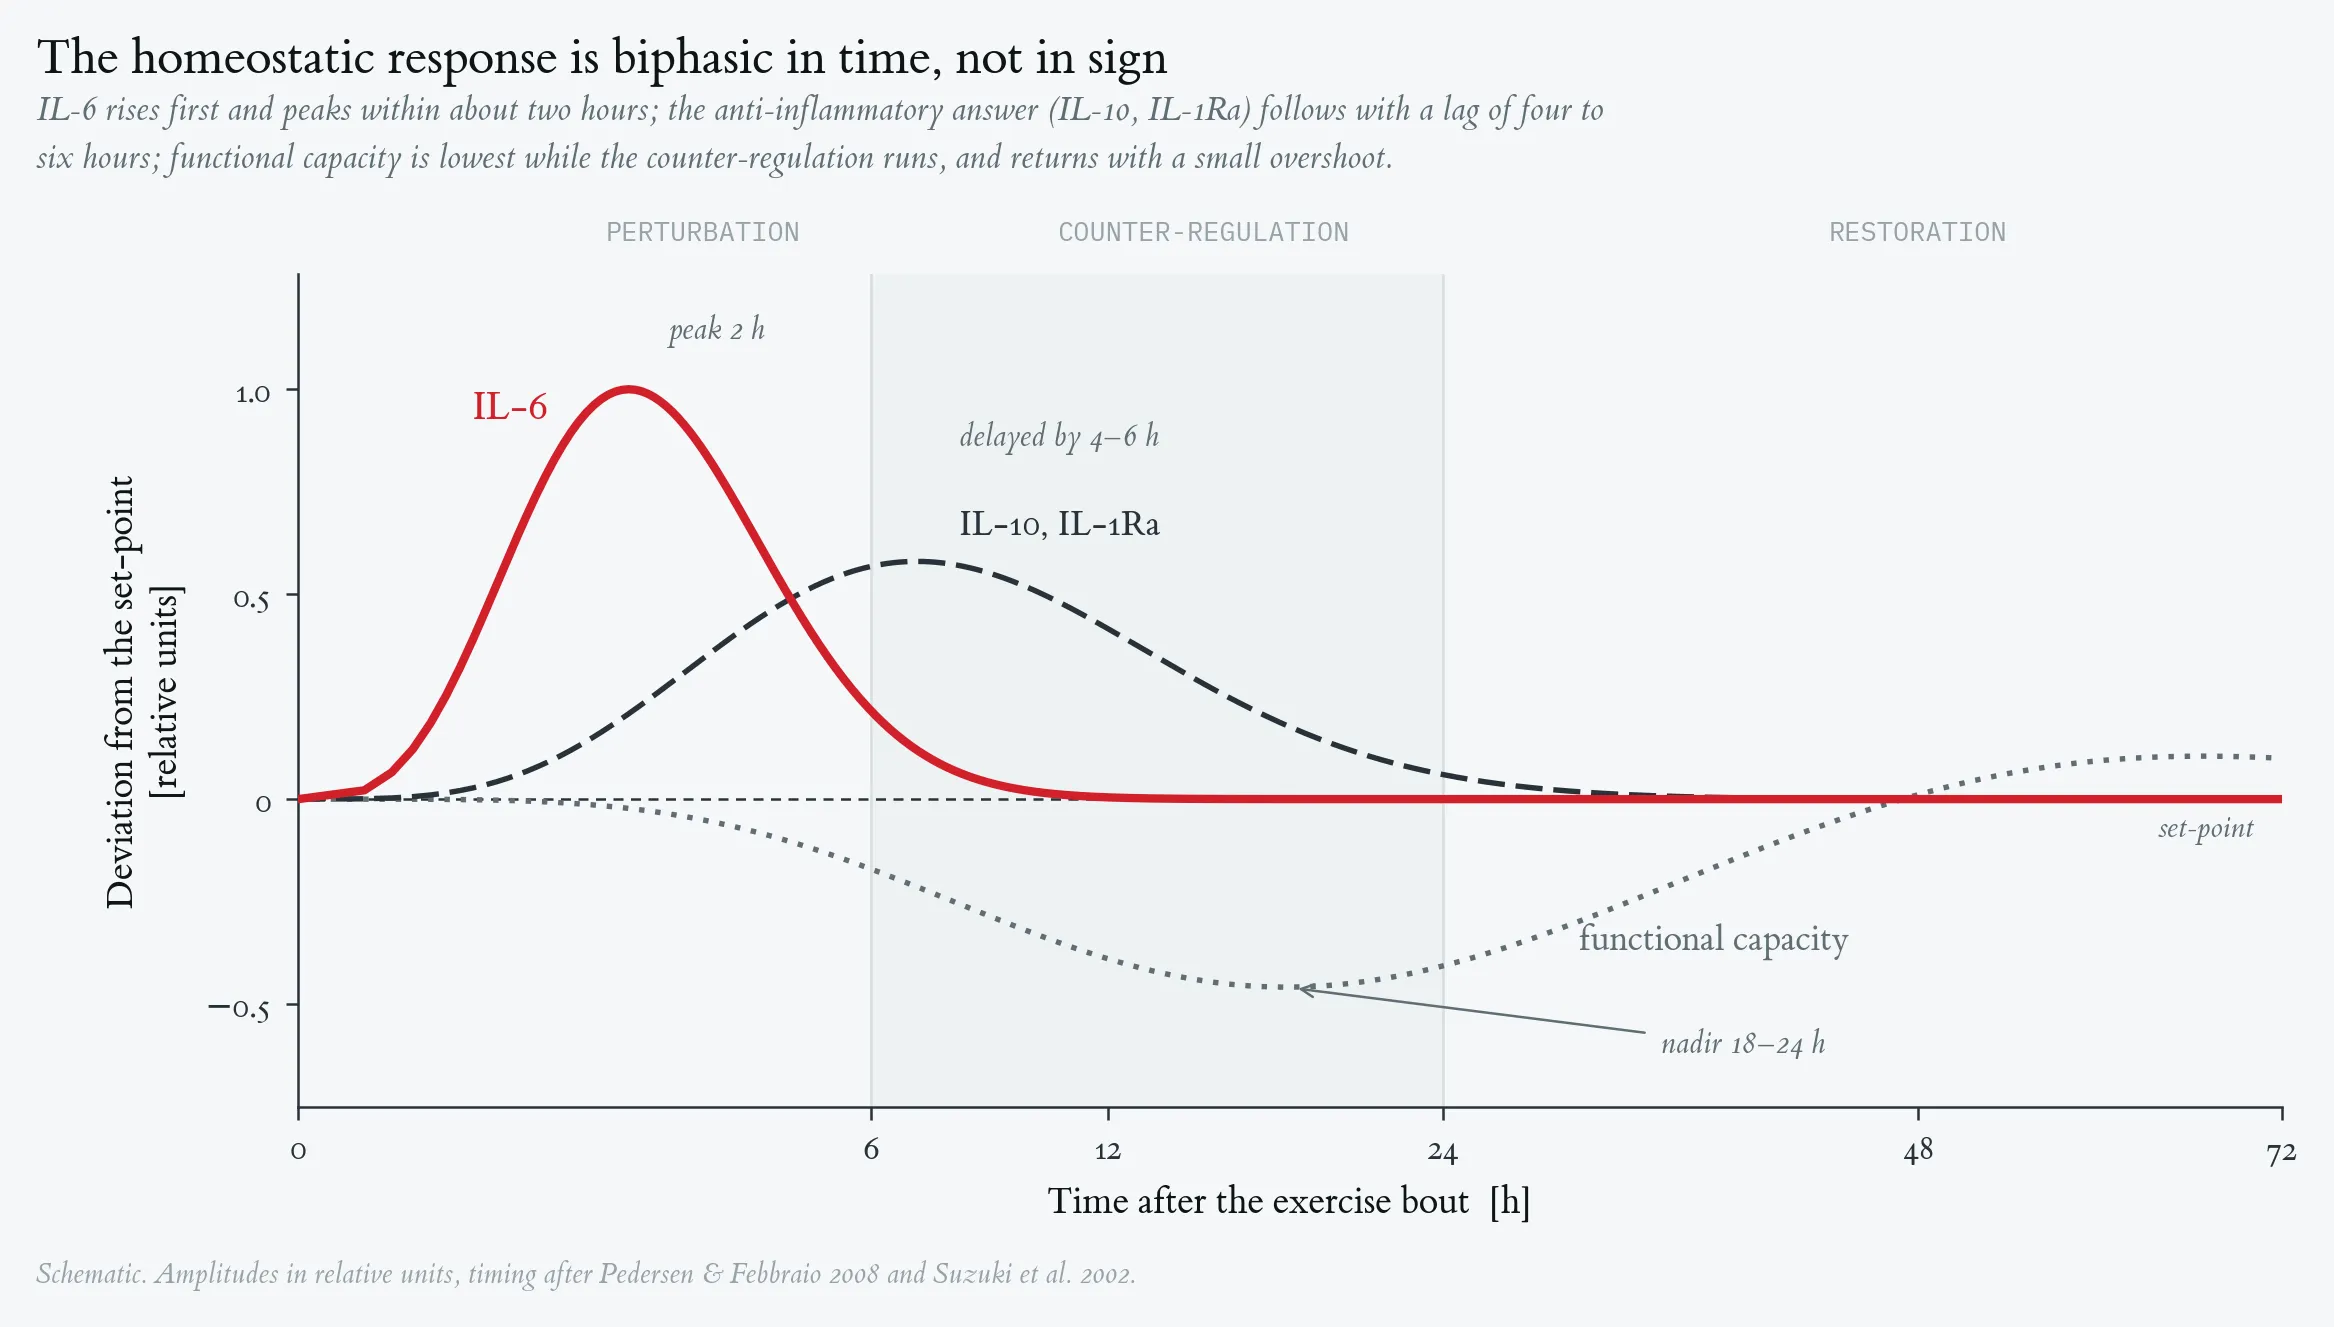
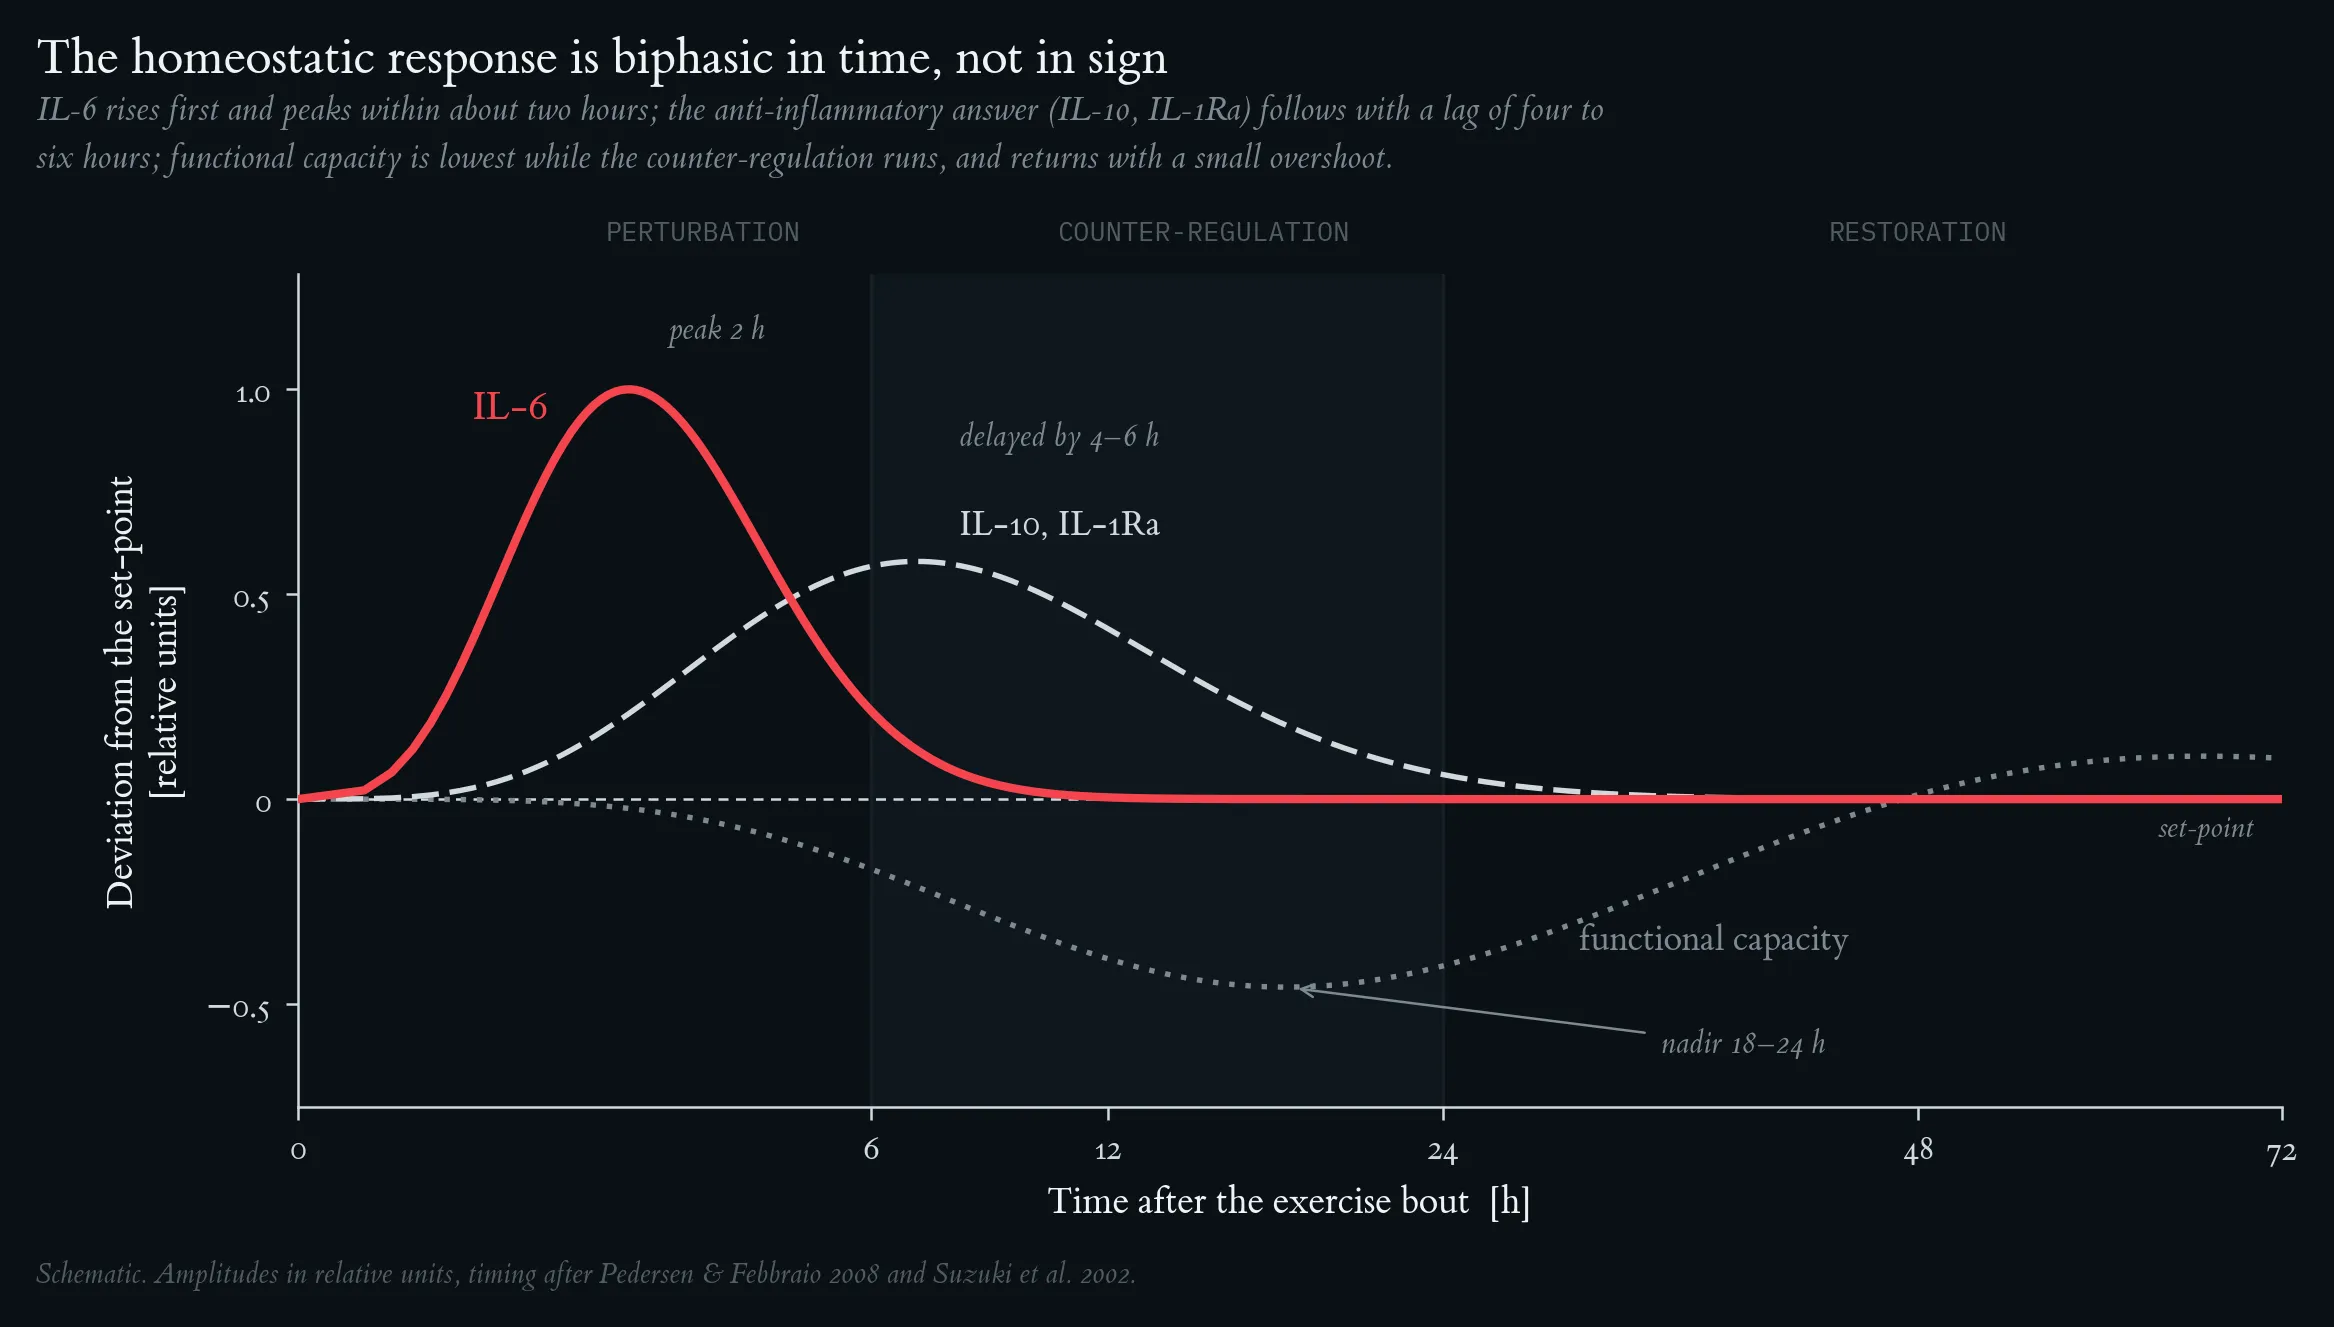
Homeostasis time-course: the IL-6 peak, delayed IL-10/IL-1Ra counter-response, functional capacity dip, and the set-point reference line, with annotated phase zones.
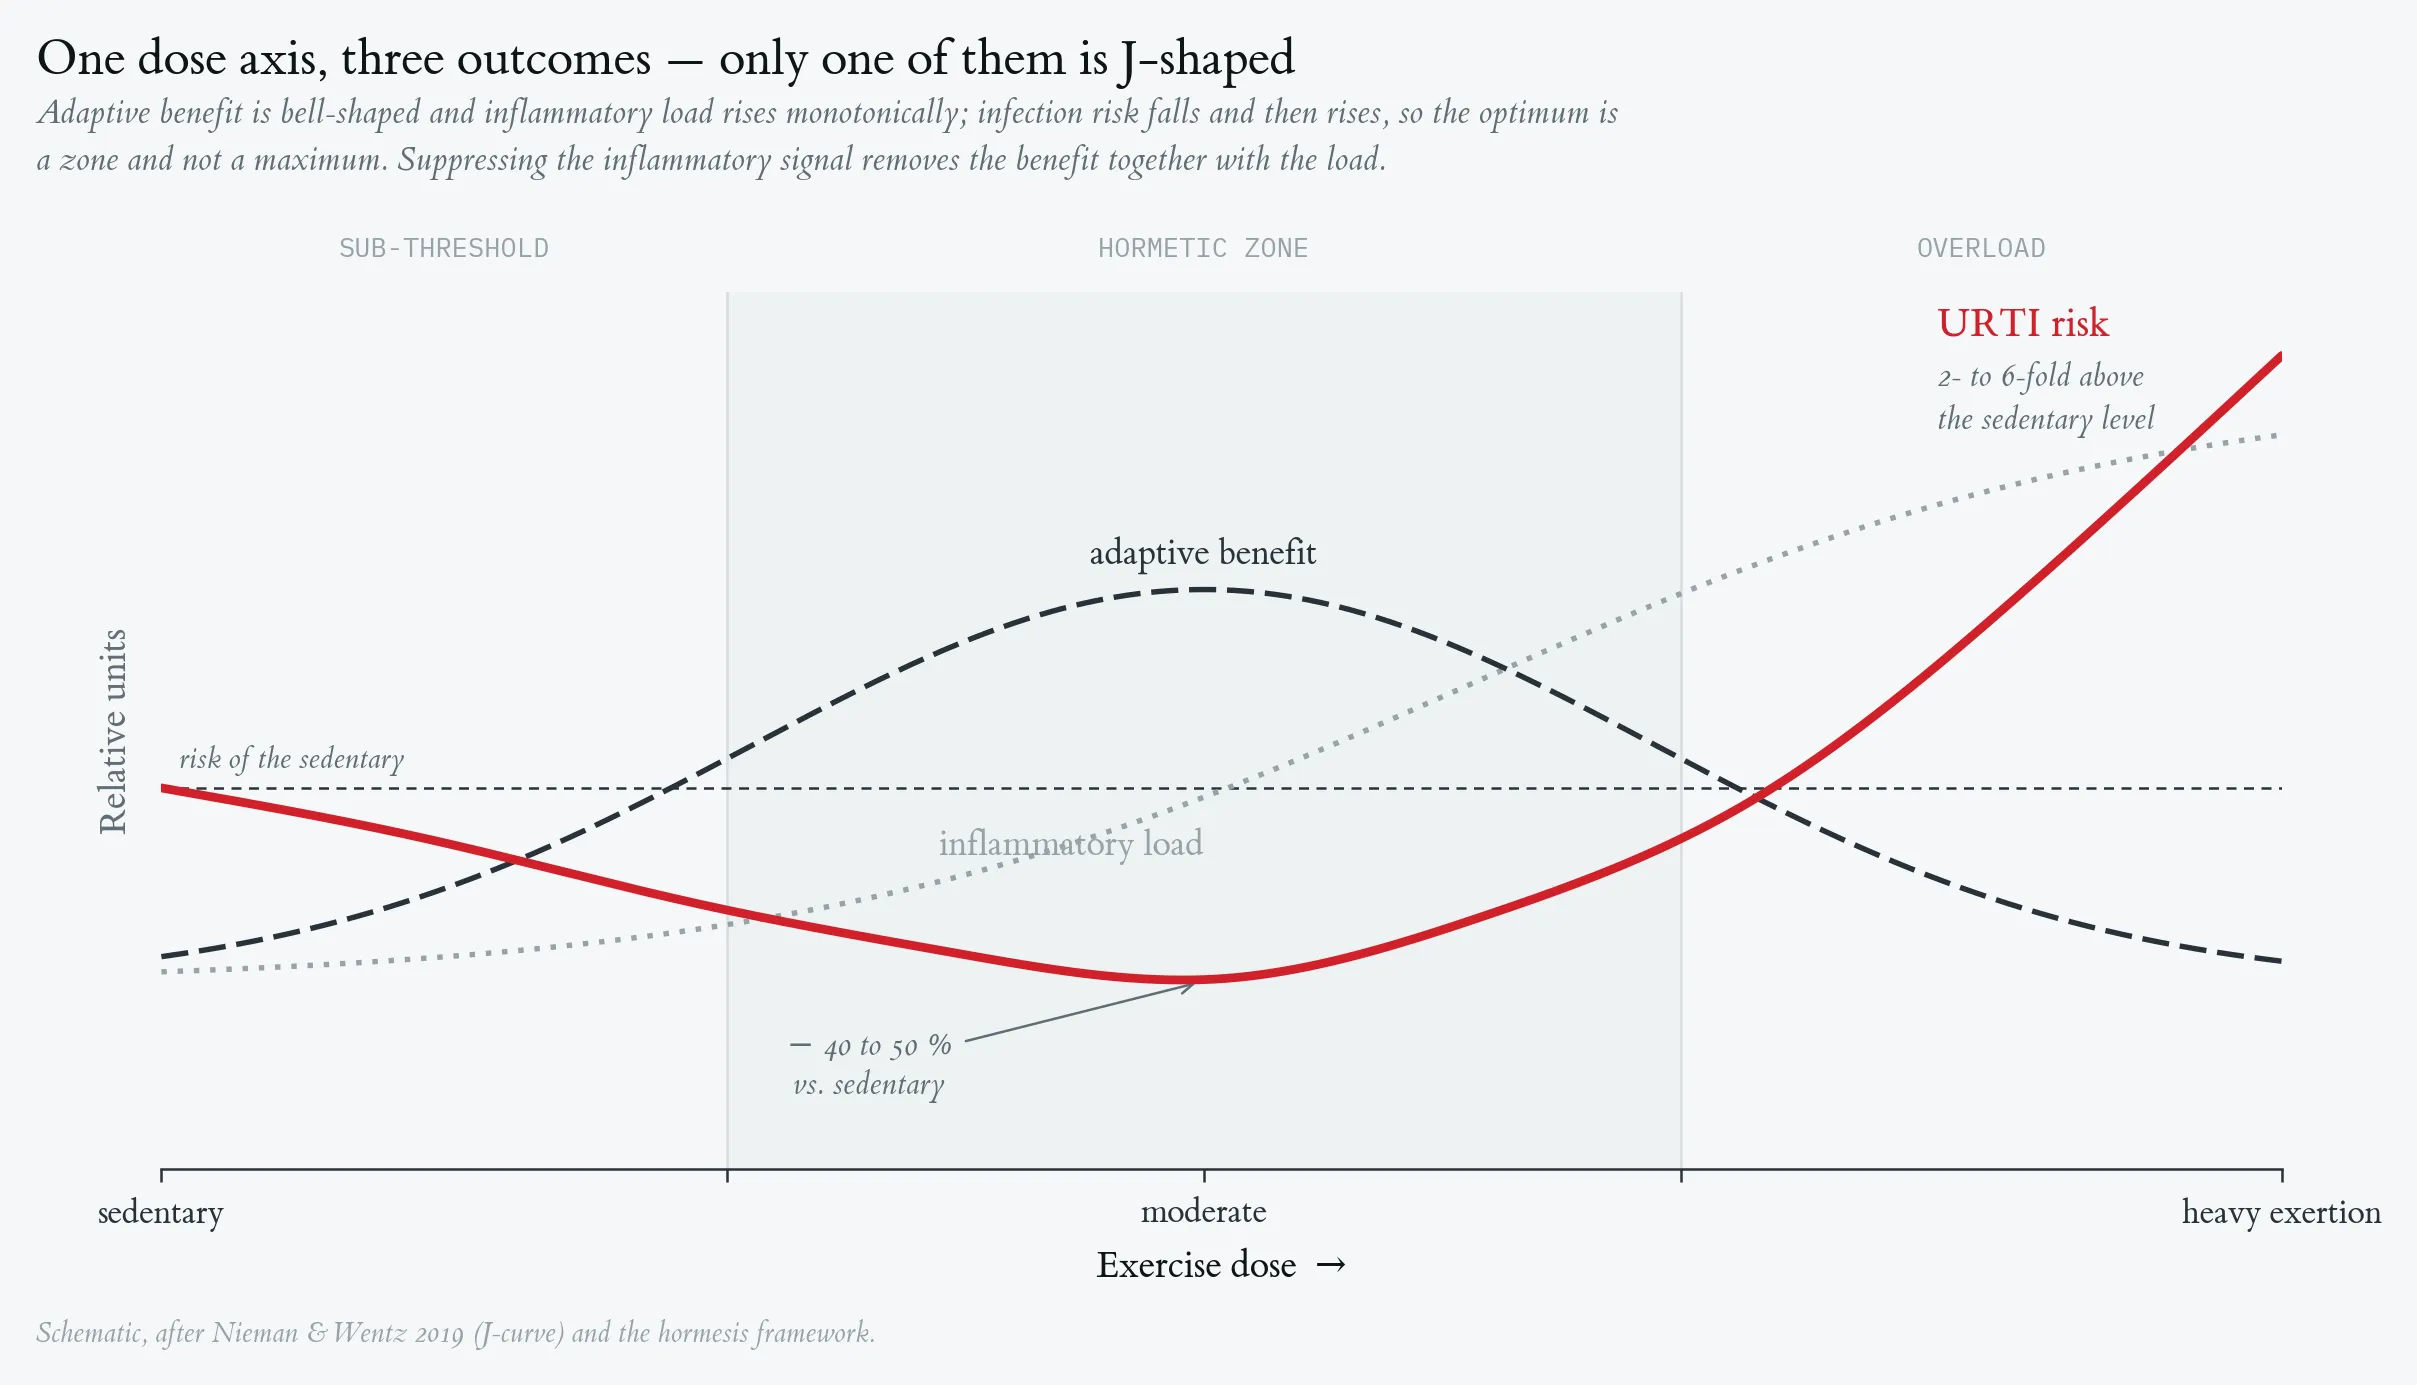
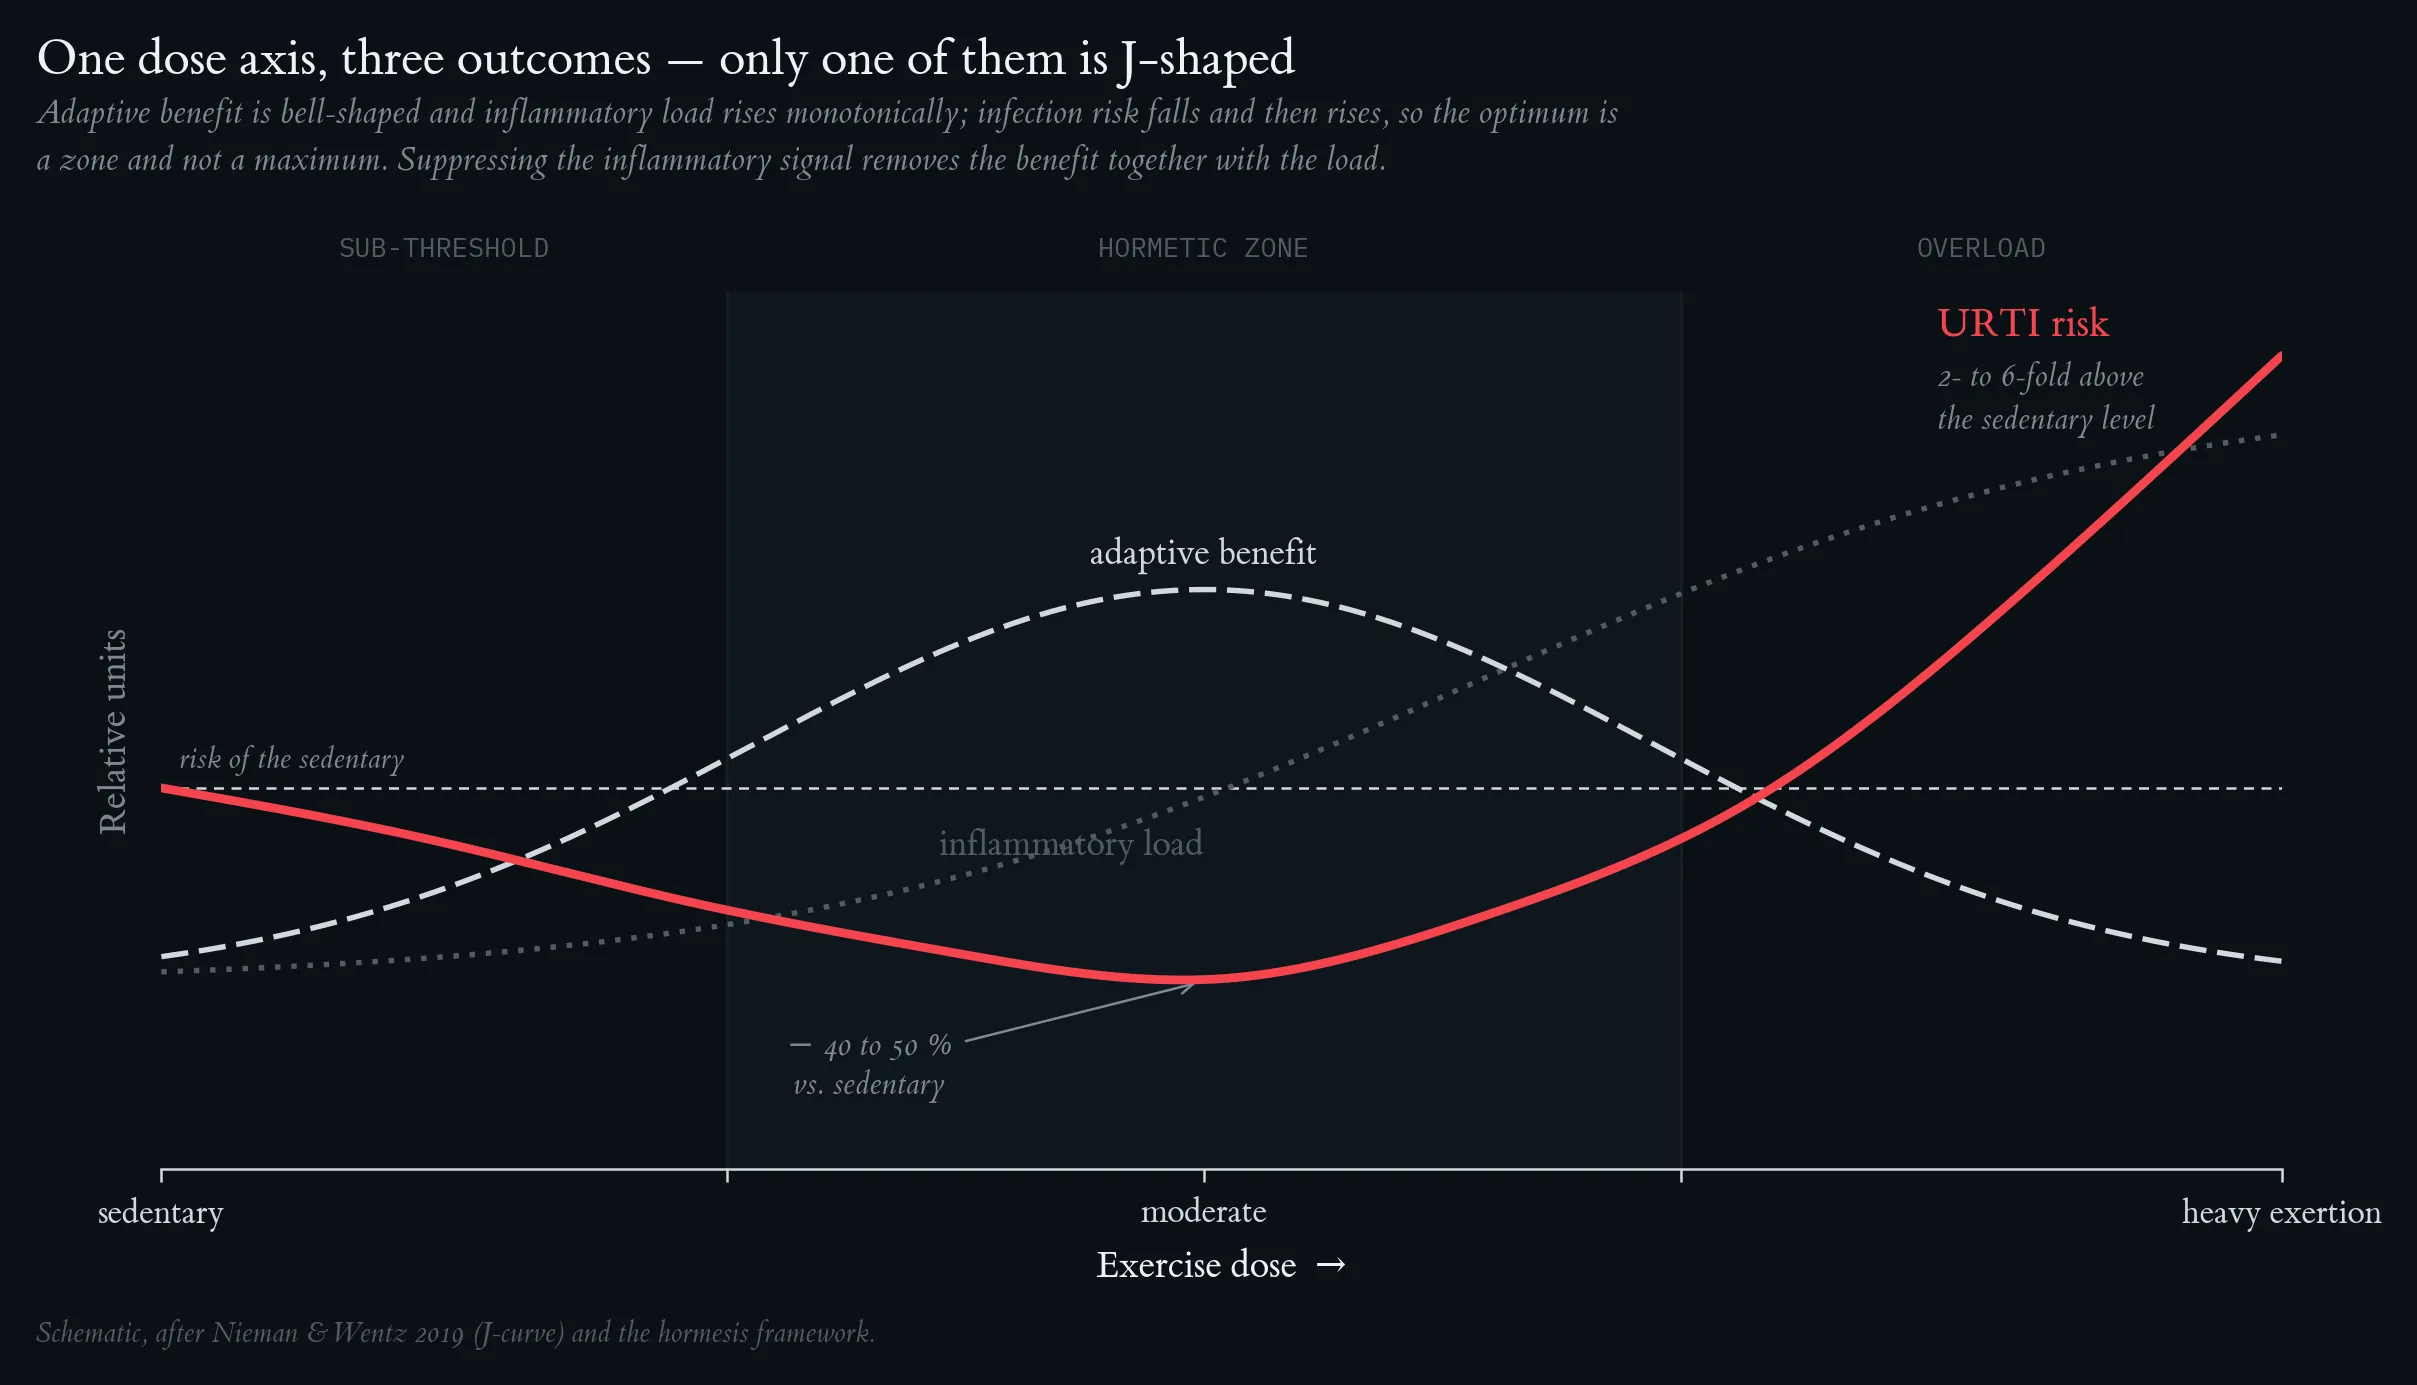
Hormesis dose-response: the full J-curve (URTI risk), bell-shaped adaptive benefit, and monotonically rising inflammatory load, with the three dose zones (sub-threshold / hormetic / overload) shaded.
Hormesis dose-response: the full J-curve (URTI risk), bell-shaped adaptive benefit, and monotonically rising inflammatory load, with the three dose zones (sub-threshold / hormetic / overload) shaded.
Lecture 2: Essential Components of the Immune System - Innate and Adaptive Immunity and the Chronological Immune Response to Viral Infections
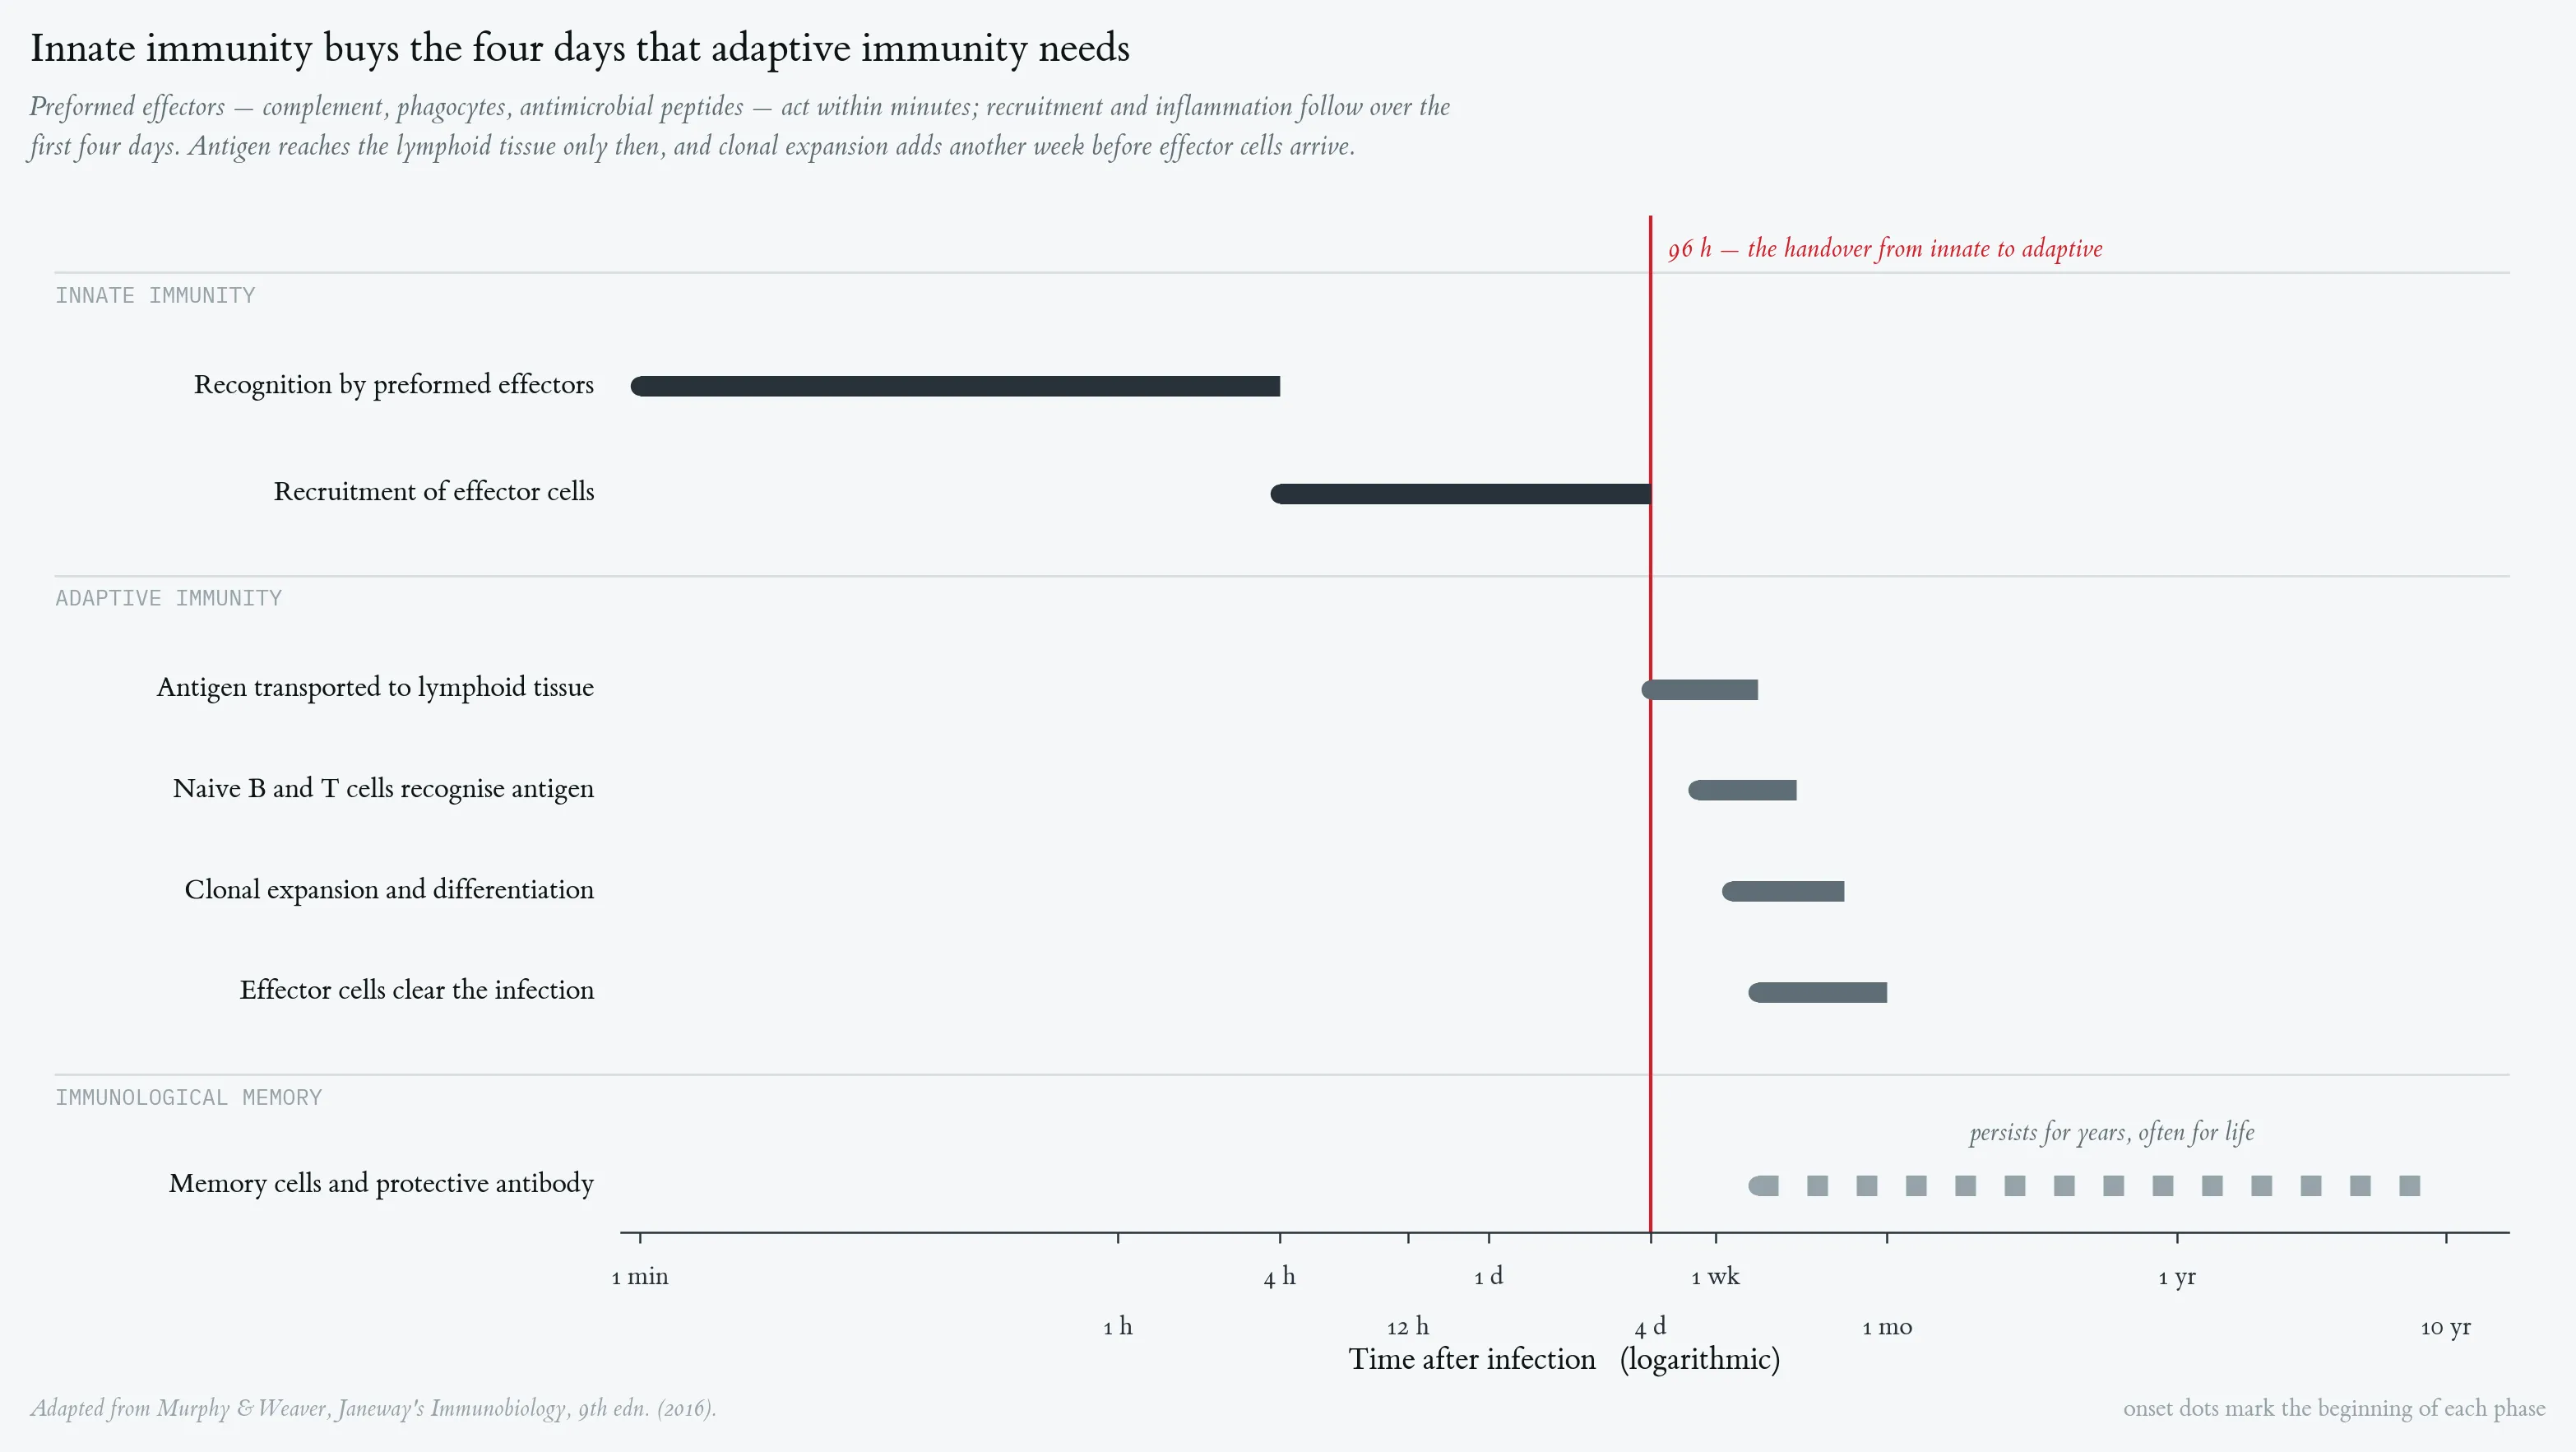
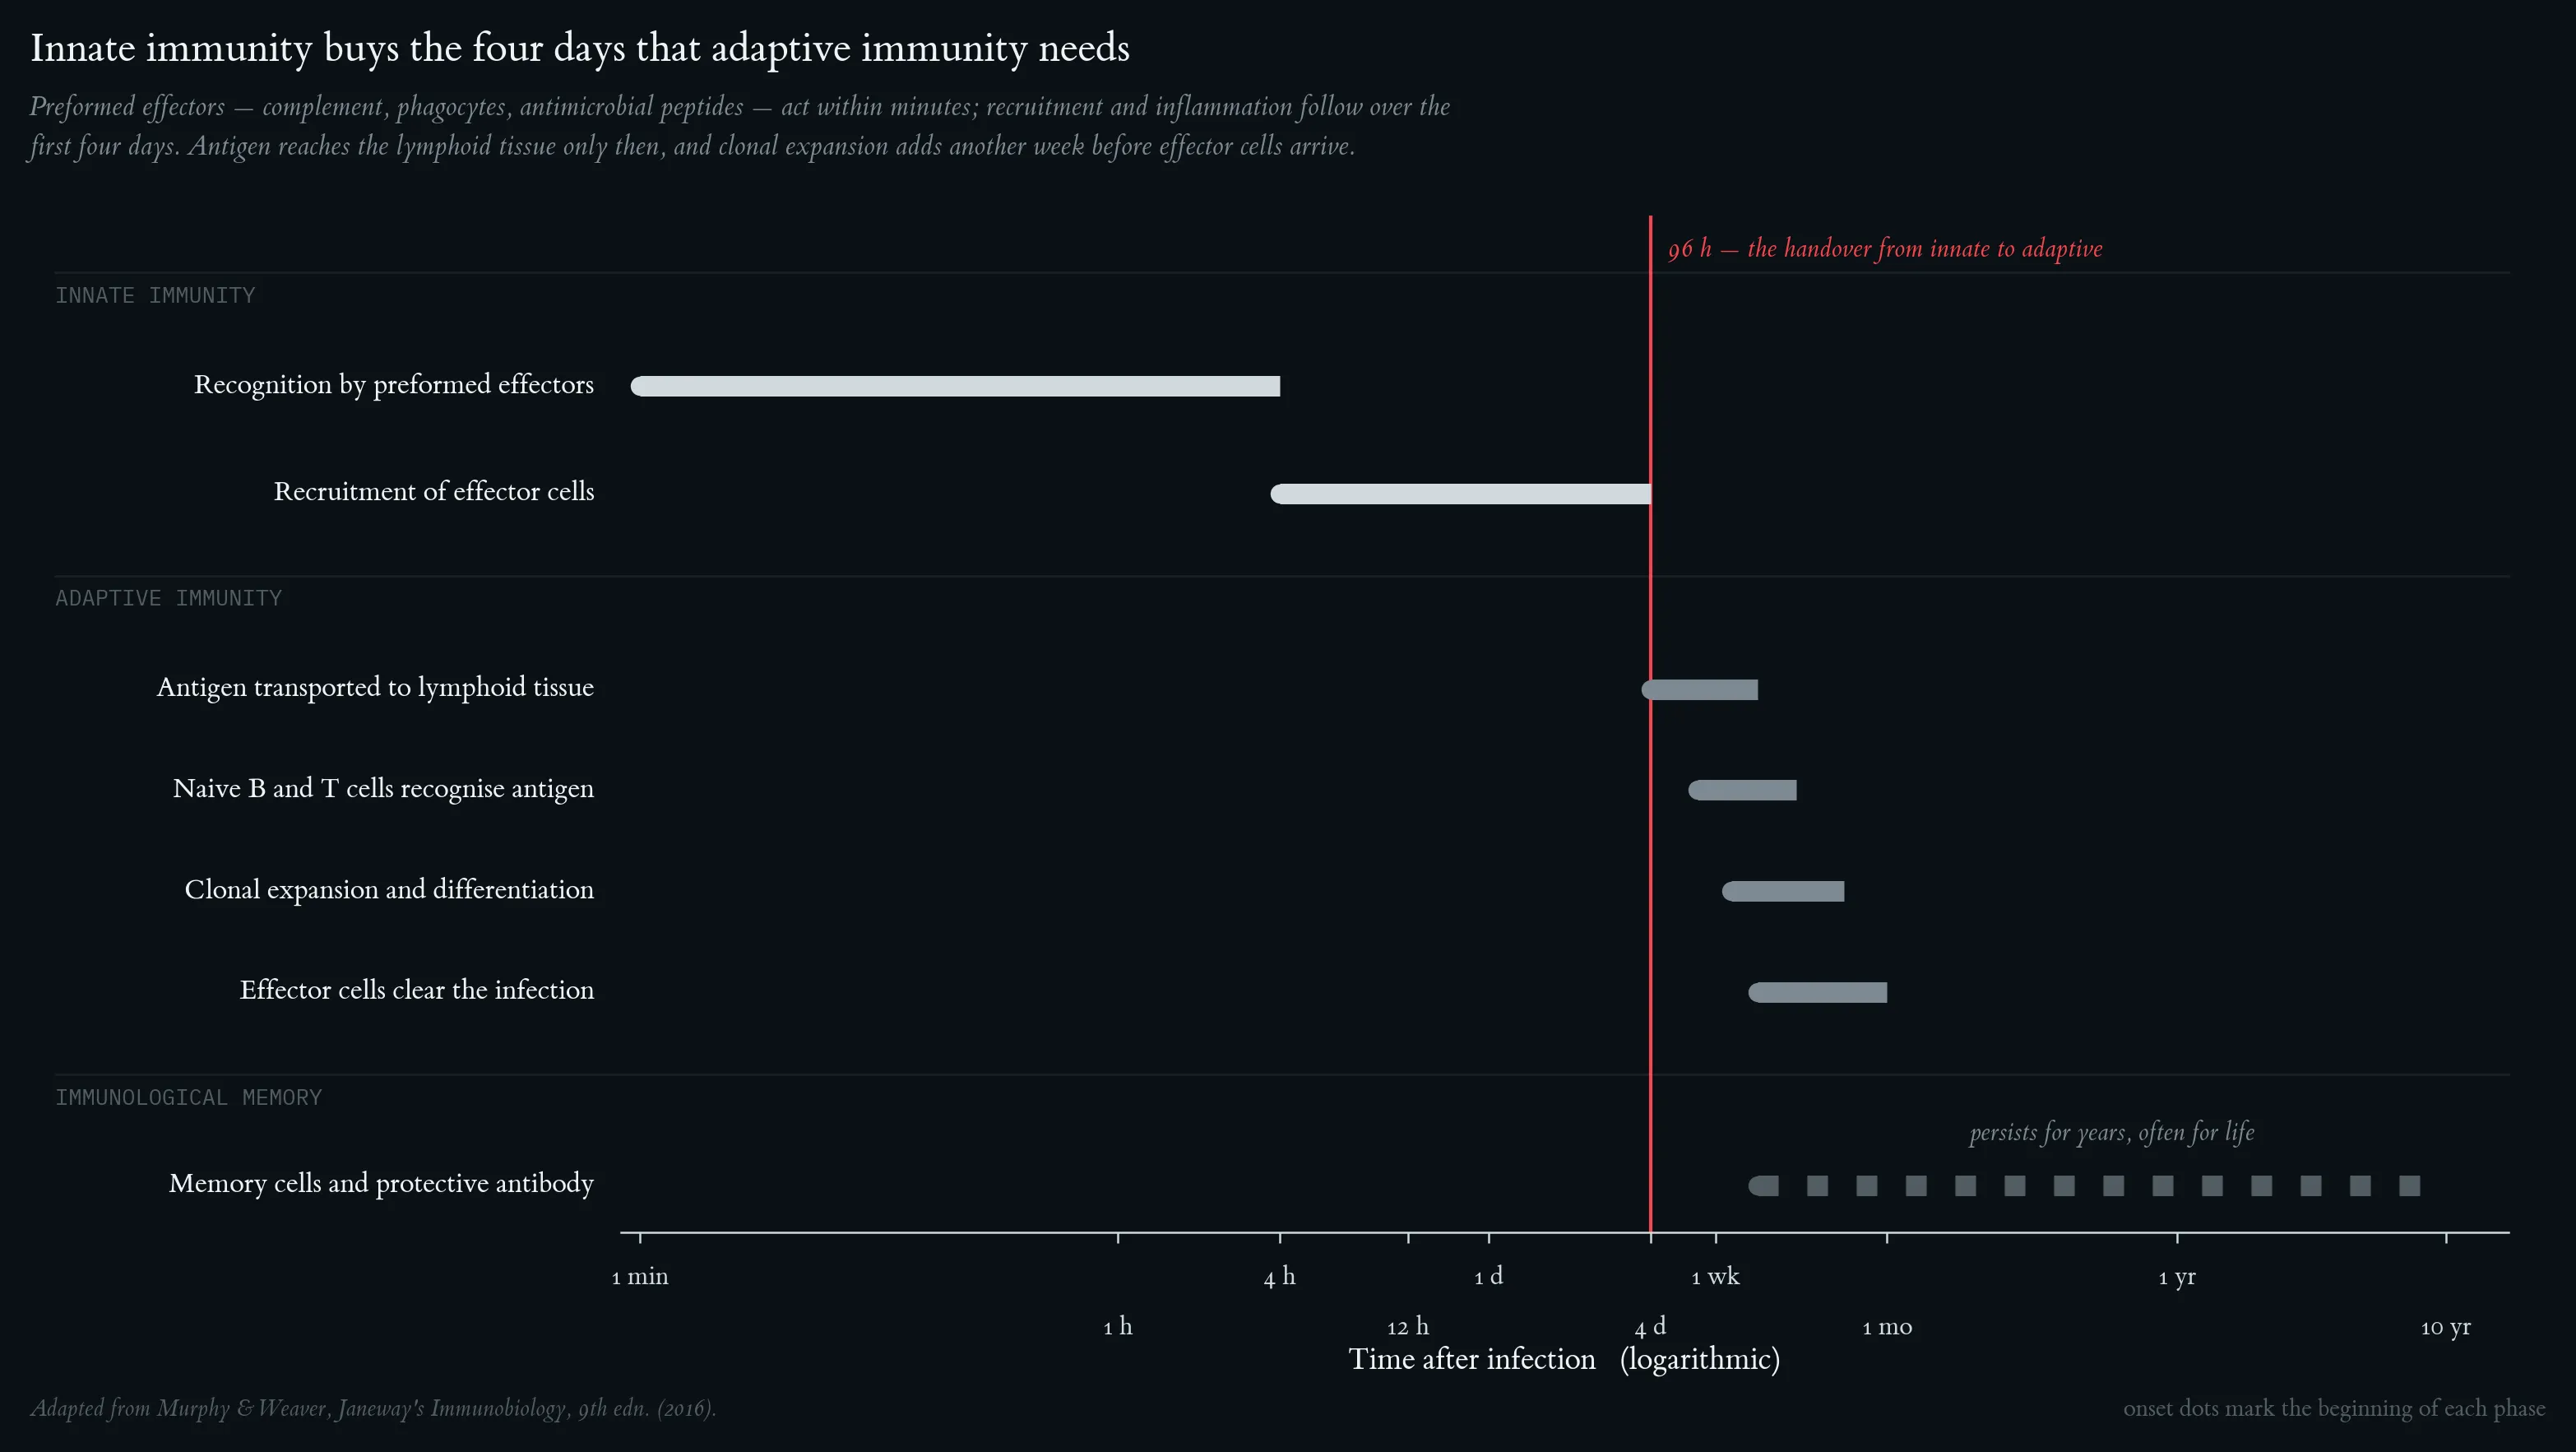
Phases of the Immune Response -- Gantt-Style Timeline Chart. The innate immune response (black) is initiated within minutes; the adaptive response (dark grey) develops over days to weeks; immunological memory (medium grey, dotted) can persist lifelong. Onset dots mark the beginning of each phase. Adapted from Murphy K & Weaver C (2016). Janeway's Immunobiology, 9th edn.
Phases of the Immune Response -- Gantt-Style Timeline Chart. The innate immune response (black) is initiated within minutes; the adaptive response (dark grey) develops over days to weeks; immunological memory (medium grey, dotted) can persist lifelong. Onset dots mark the beginning of each phase. Adapted from Murphy K & Weaver C (2016). Janeway's Immunobiology, 9th edn.
Dendritic cells initiate adaptive immune responses. Immature dendritic cells in peripheral tissue take up pathogens via macropinocytosis and receptor-mediated endocytosis, then migrate to regional lymph nodes where they mature and activate naive T cells via antigen presentation and co-stimulatory molecules. Adapted from Murphy K & Weaver C (2016). Janeway's Immunobiology, 9th edn.
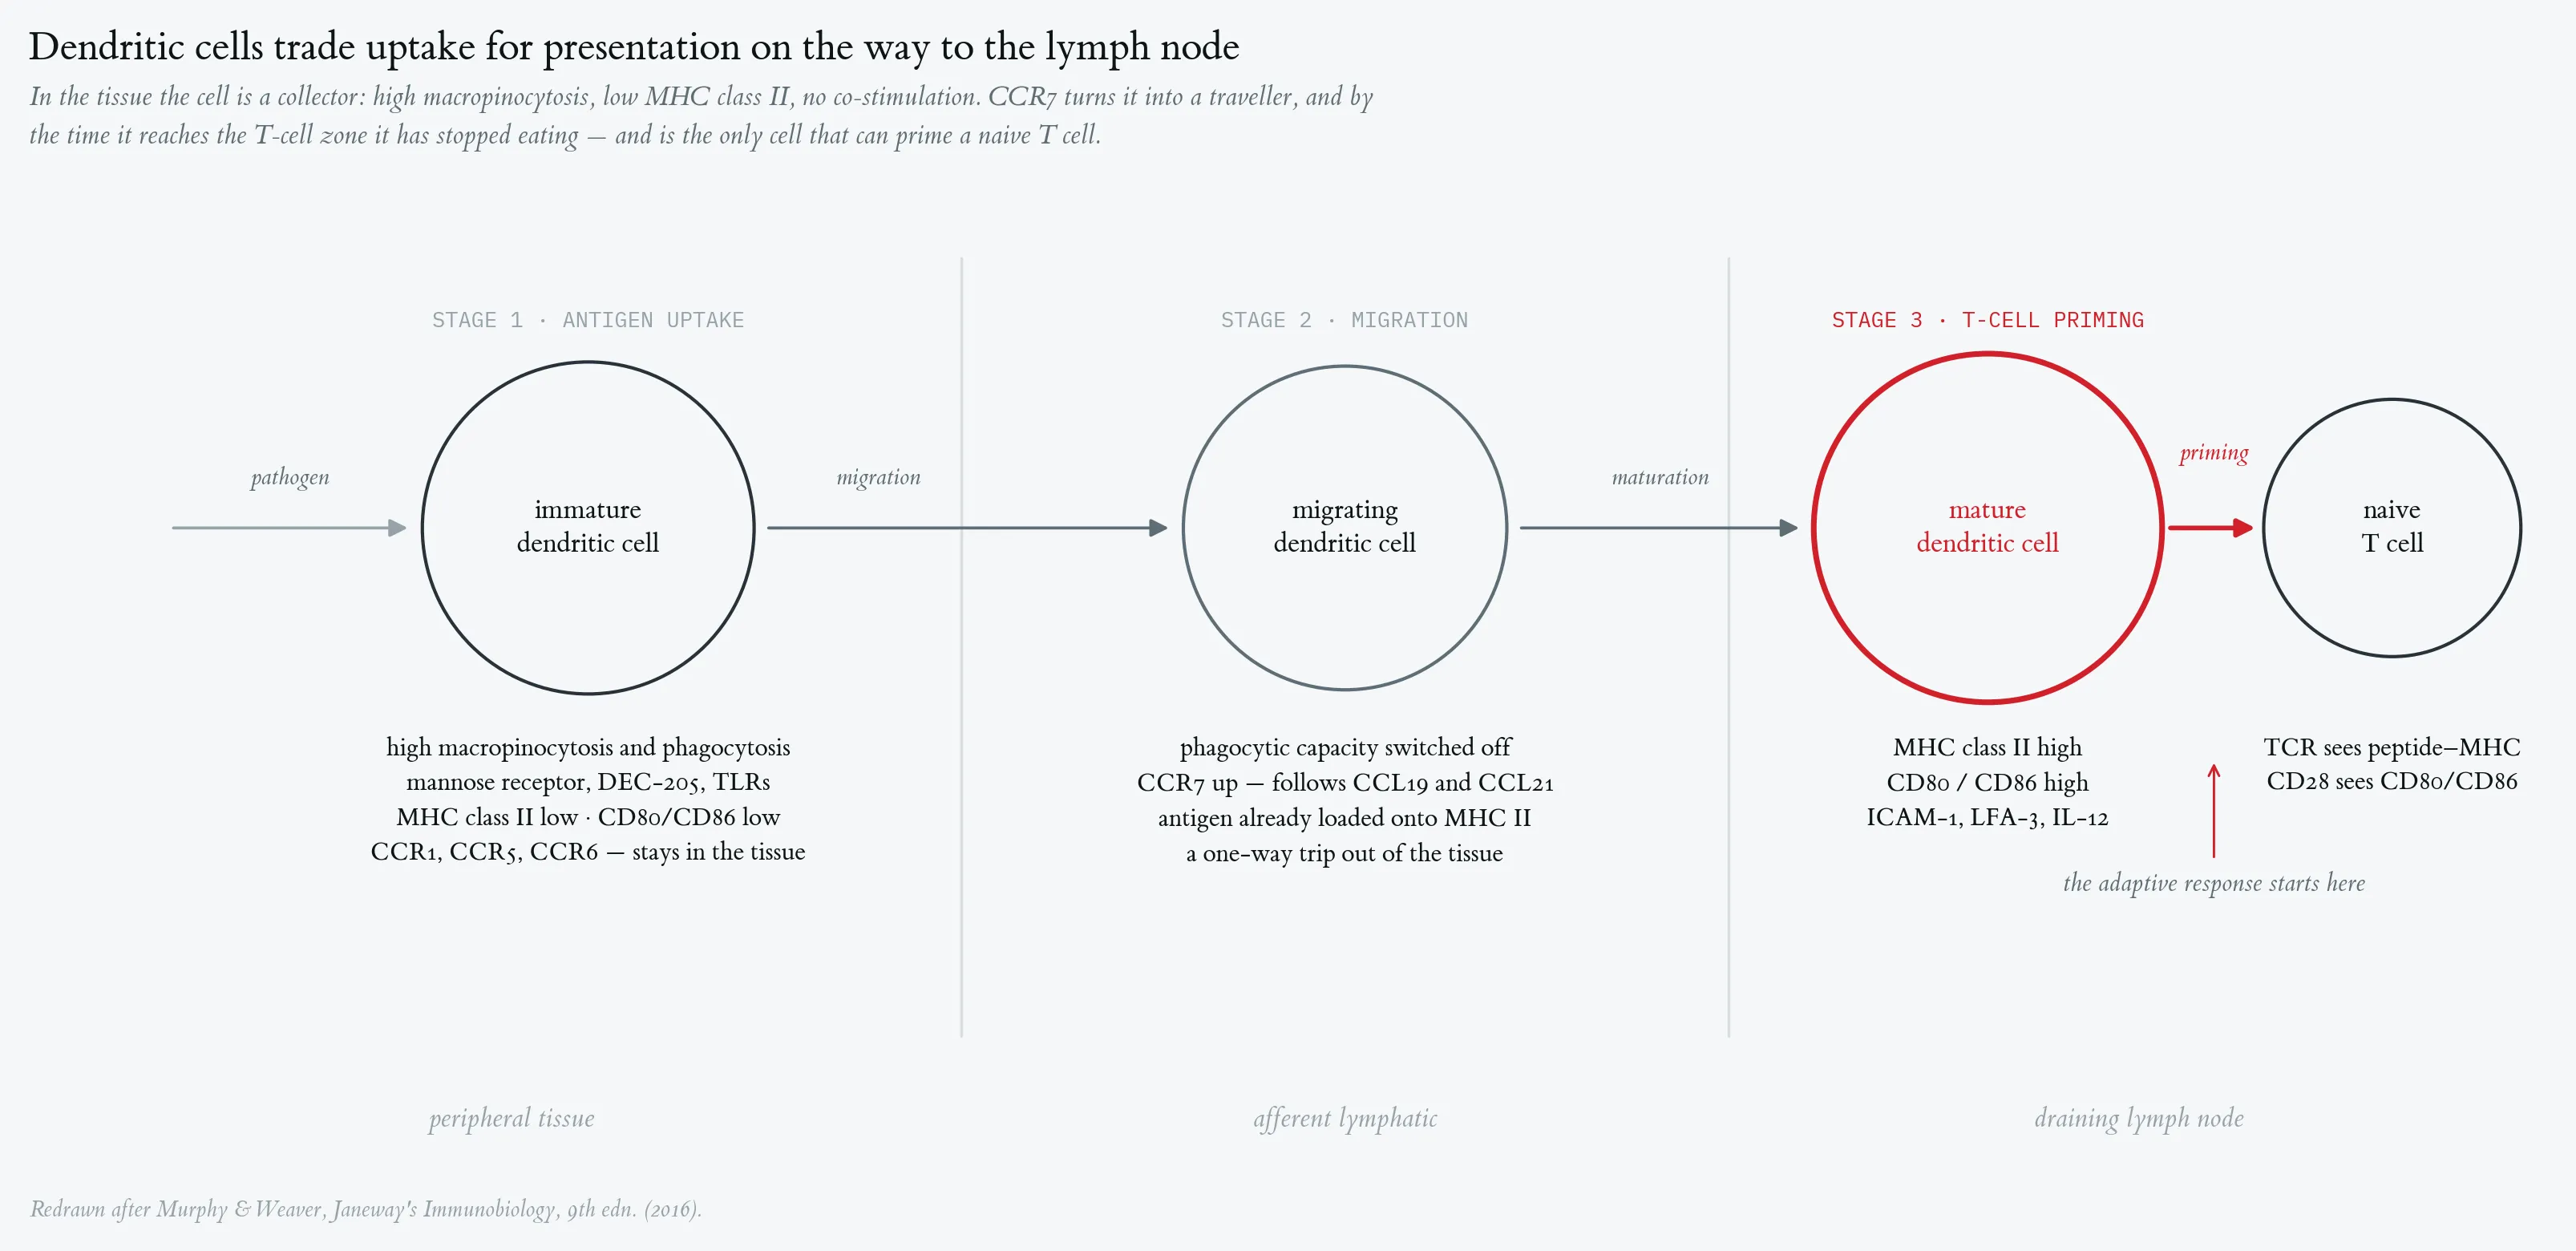
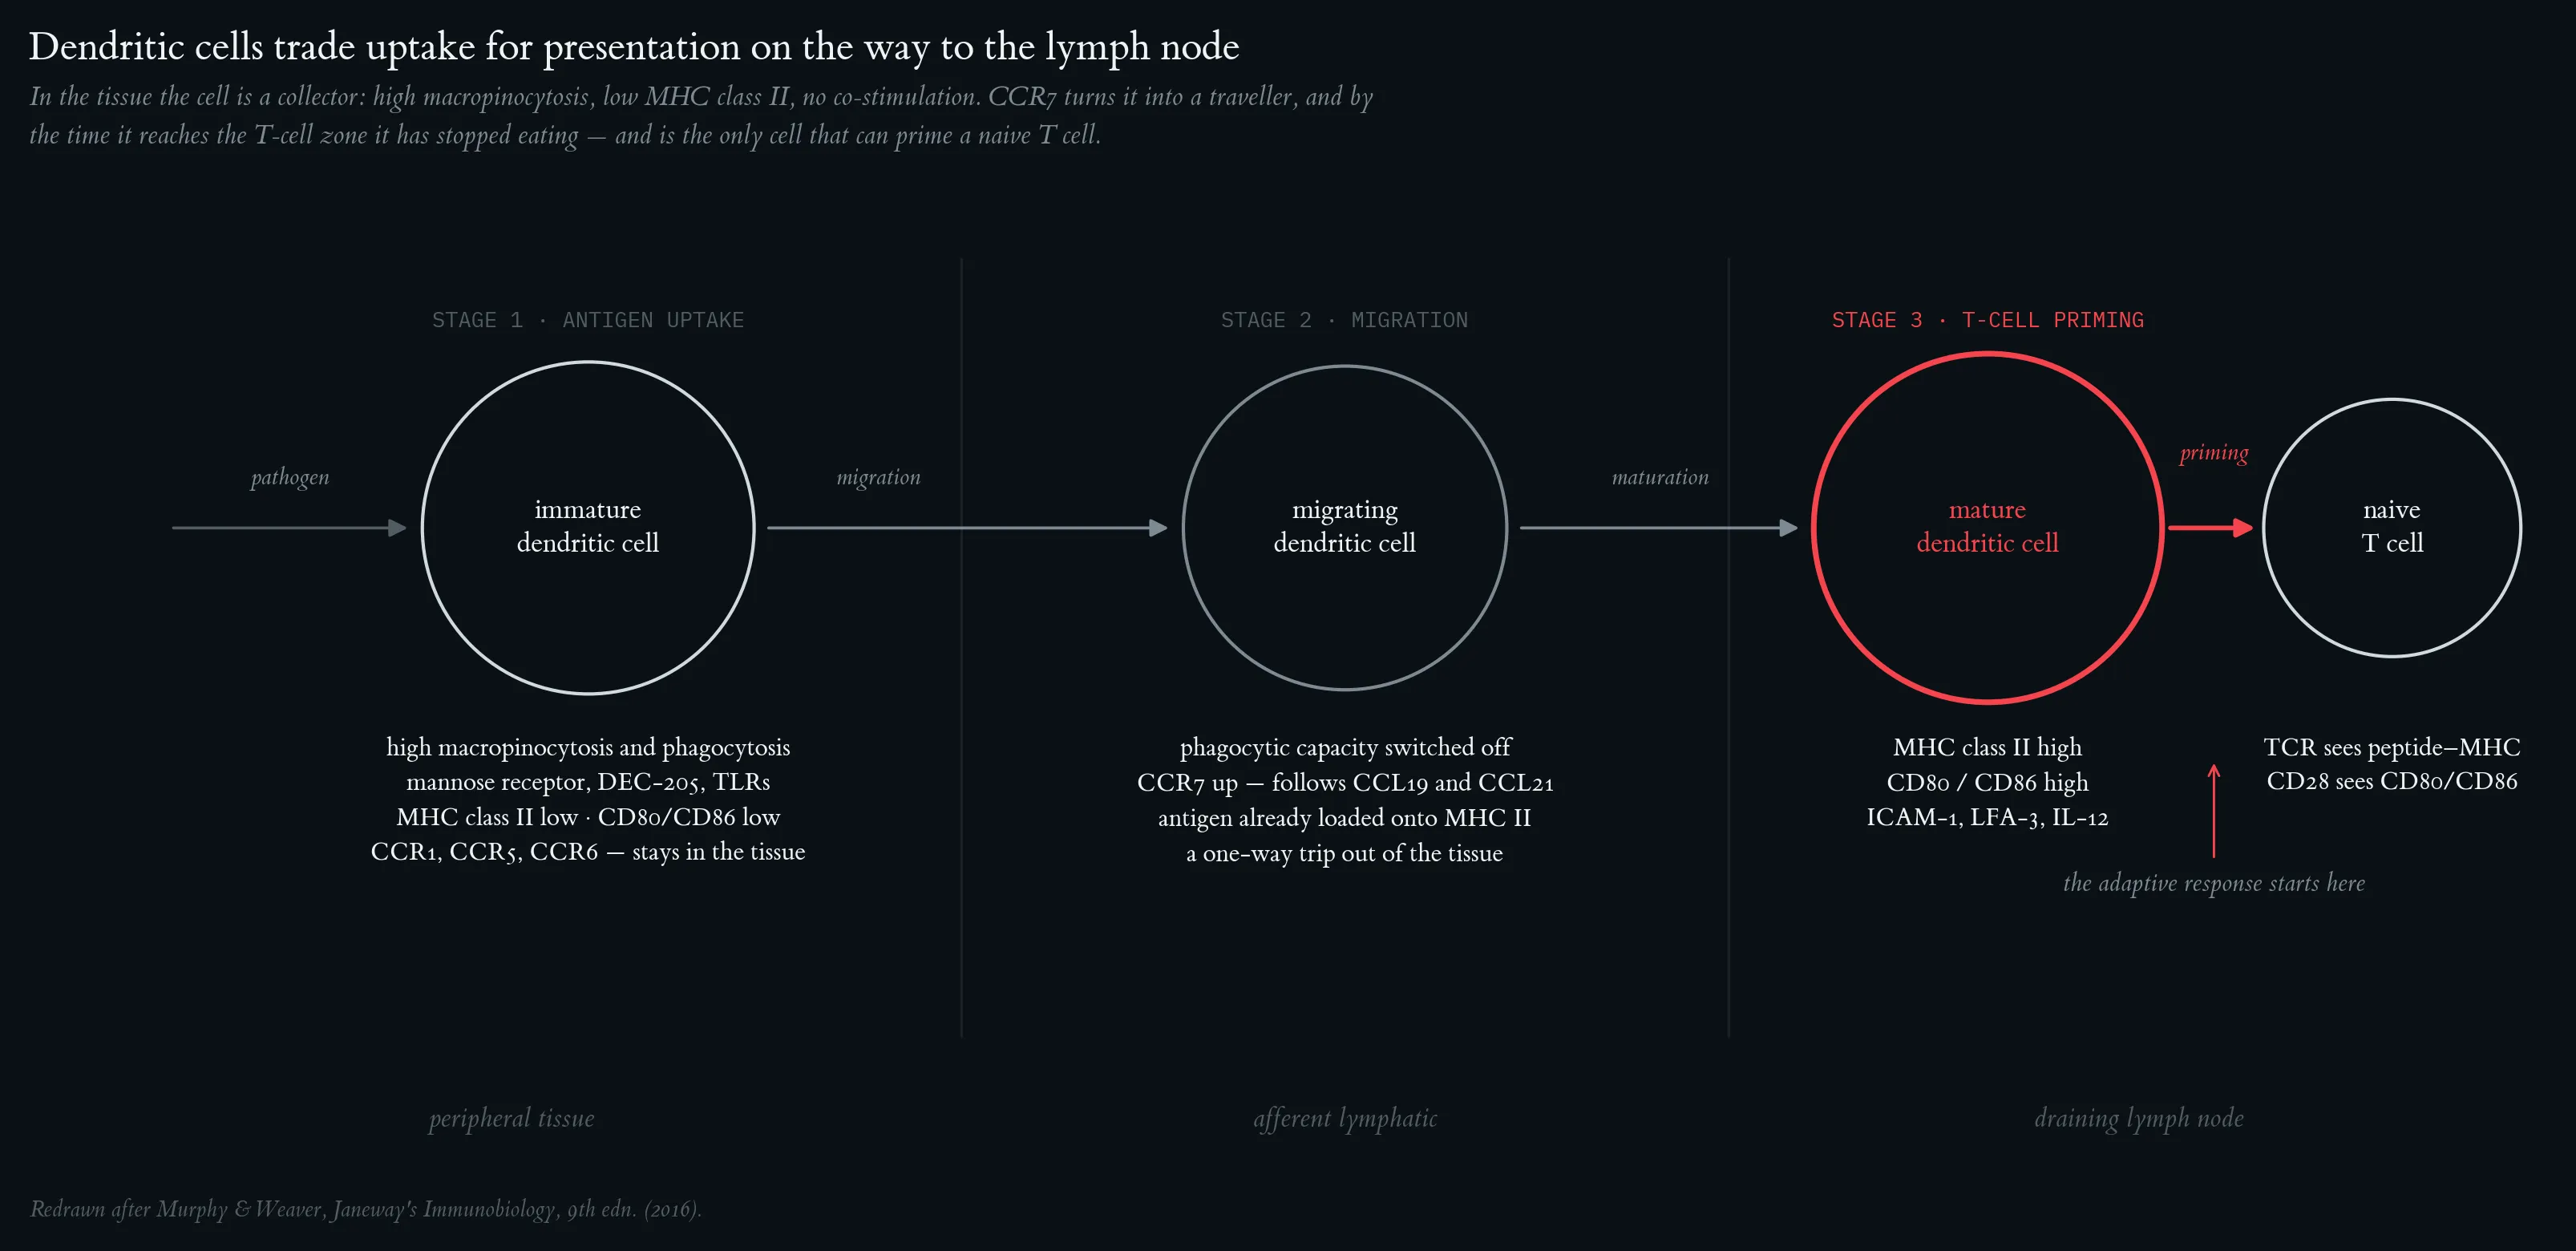
Dendritic cells initiate adaptive immune responses. Immature dendritic cells in peripheral tissue take up pathogens via macropinocytosis and receptor-mediated endocytosis, then migrate to regional lymph nodes where they mature and activate naive T cells via antigen presentation and co-stimulatory molecules. Adapted from Murphy K & Weaver C (2016). Janeway's Immunobiology, 9th edn.
NK cells are an early component of the host response to virus infection. IFN-α/IFN-β and cytokines (black, solid) are produced first, followed by NK-cell killing (dark grey, dashed); T-cell killing (medium grey, dotted) peaks later as the adaptive response matures. Virus titer (light grey, dash-dot) rises then falls once adaptive immunity is established. Adapted from Murphy K & Weaver C (2016). Janeway's Immunobiology, 9th edn.
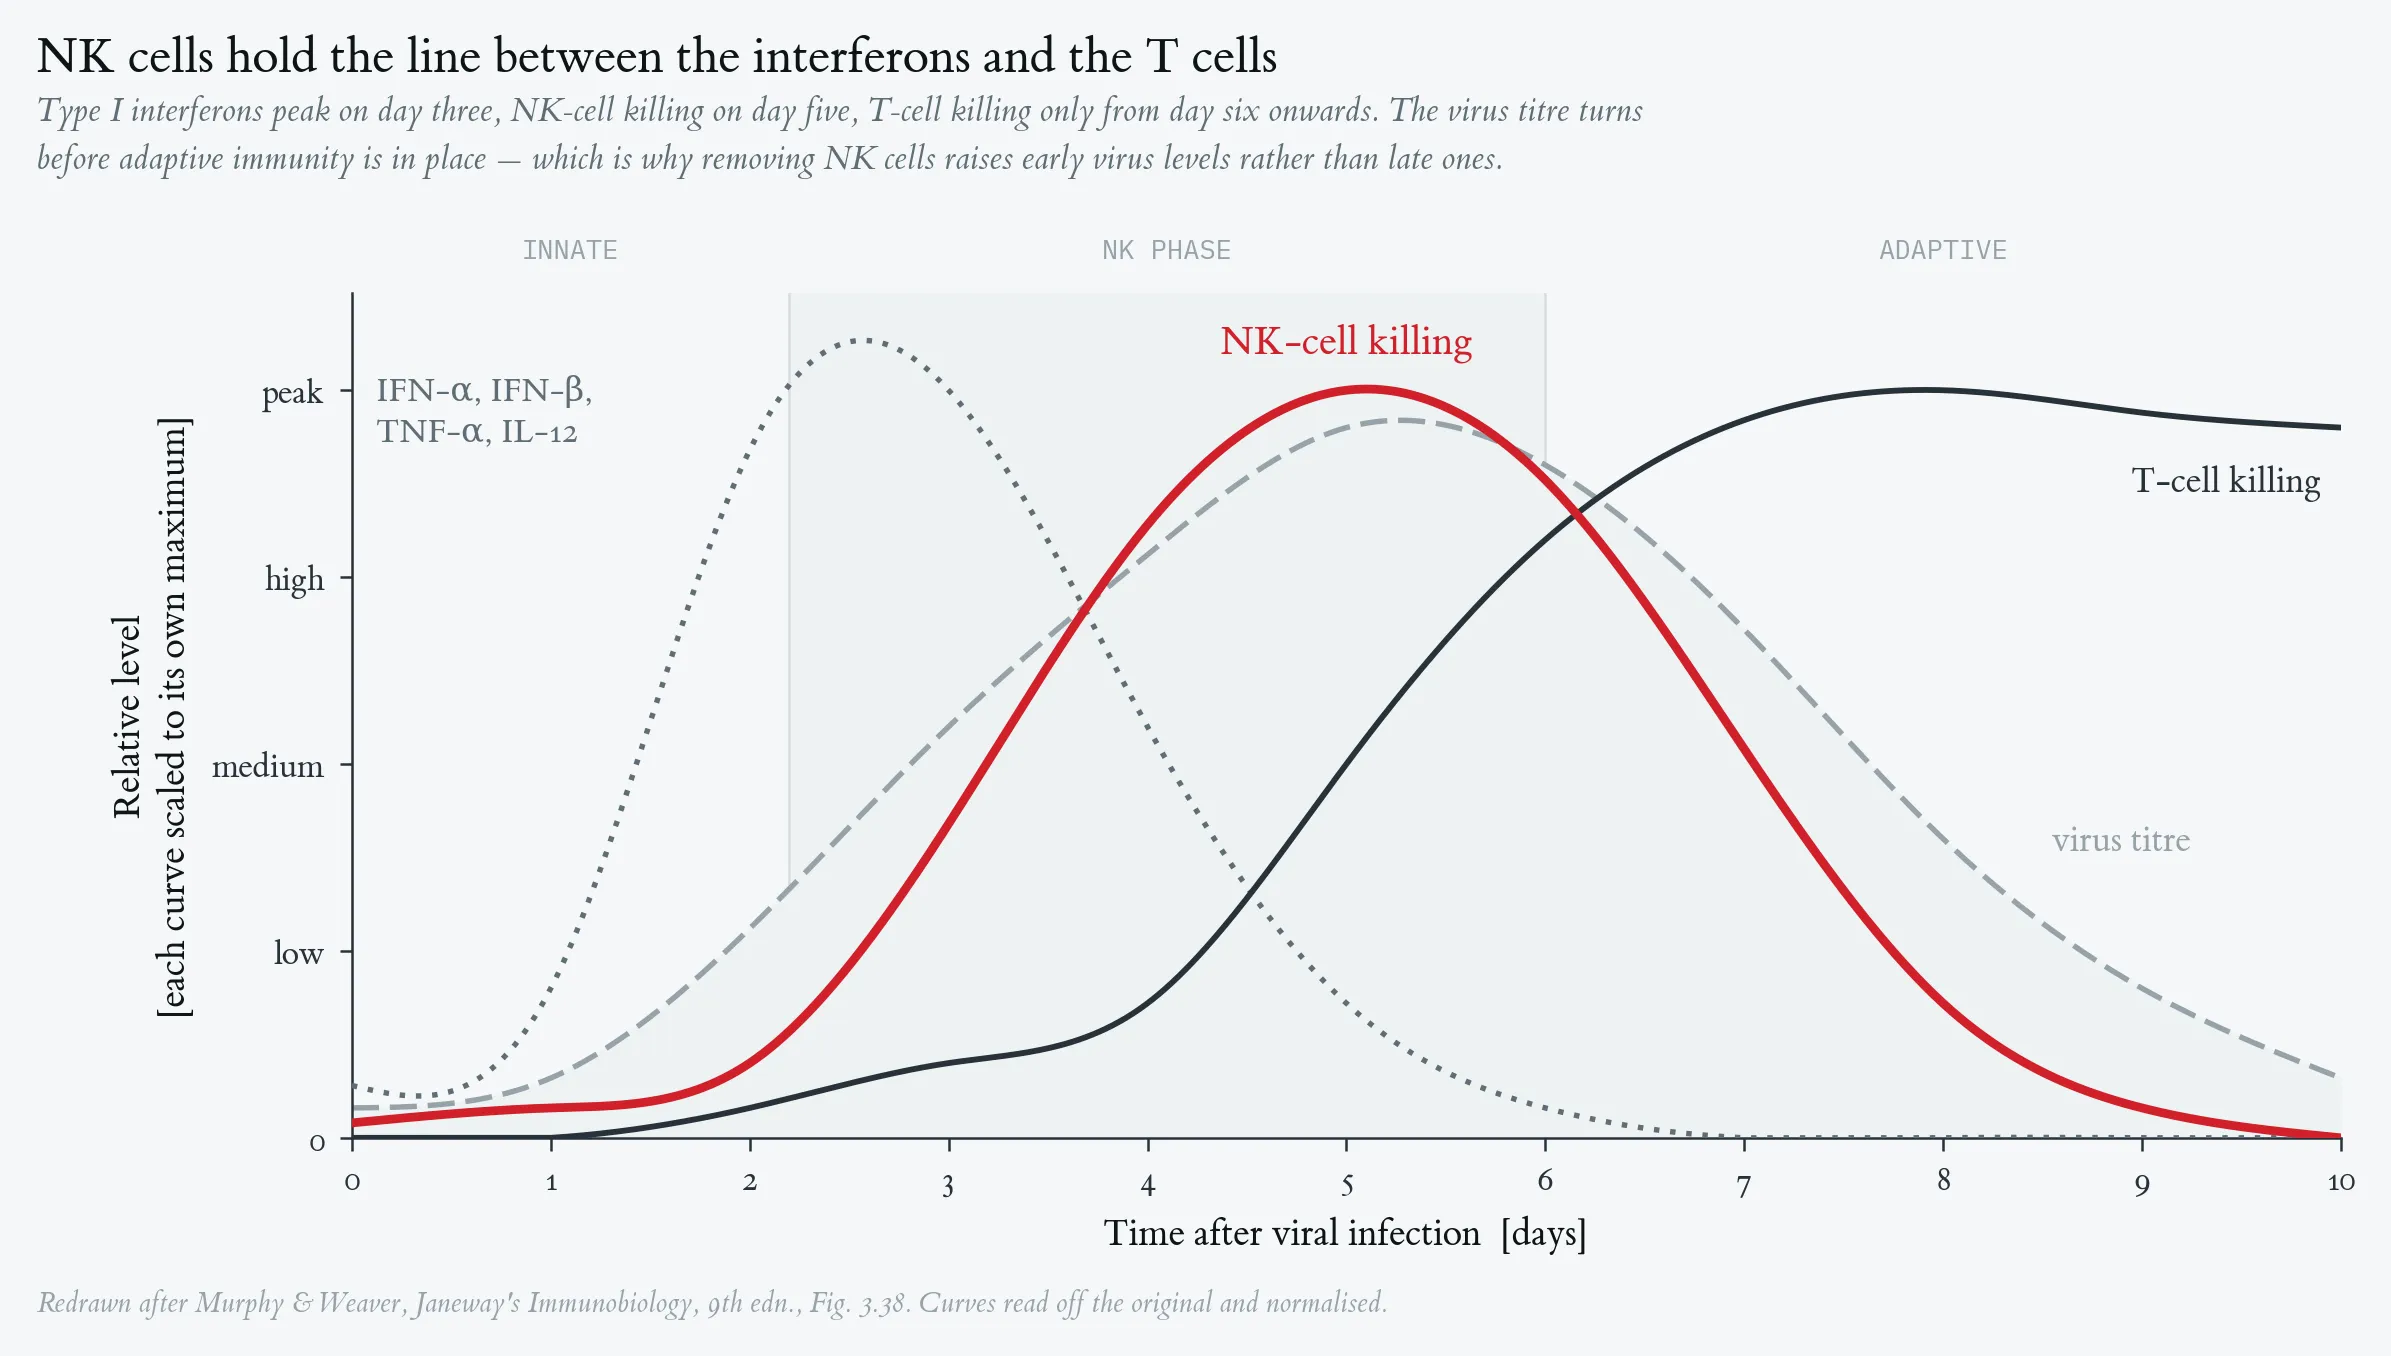
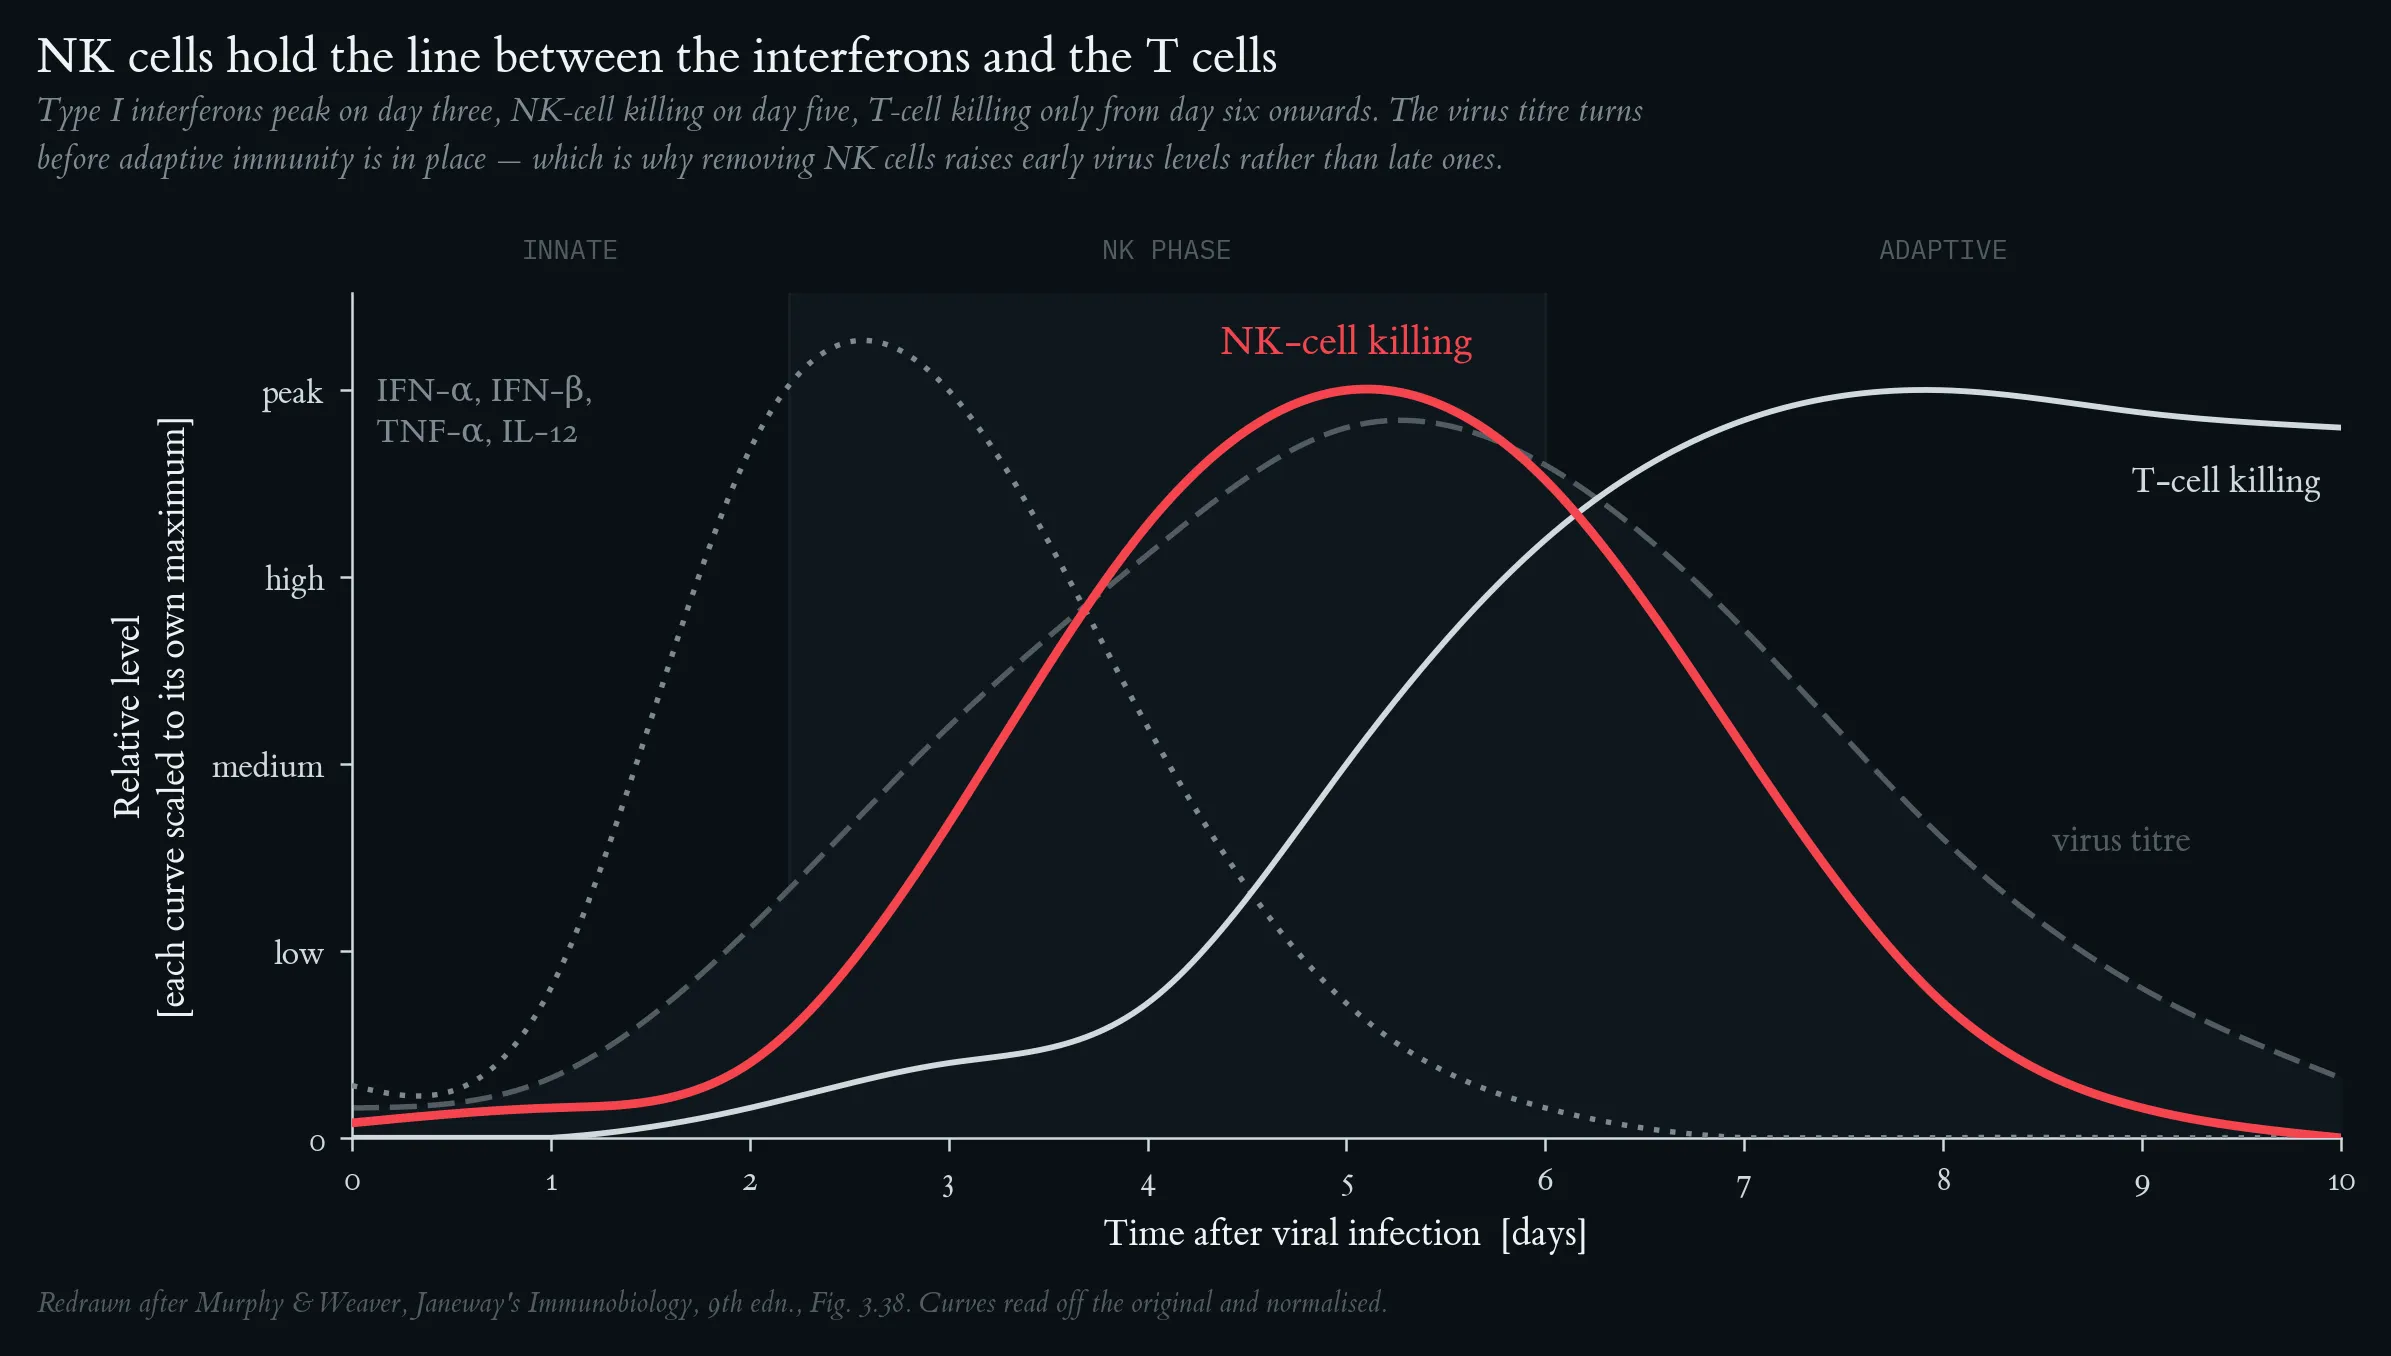
NK cells are an early component of the host response to virus infection. IFN-α/IFN-β and cytokines (black, solid) are produced first, followed by NK-cell killing (dark grey, dashed); T-cell killing (medium grey, dotted) peaks later as the adaptive response matures. Virus titer (light grey, dash-dot) rises then falls once adaptive immunity is established. Adapted from Murphy K & Weaver C (2016). Janeway's Immunobiology, 9th edn.
Lecture 3: The Biphasic Immune Cell Response to Acute Dynamic Exercise and the Immune Cell Response to Regular Physical Activity
The biphasic immune cell response to dynamic acute physical stress. The lymphocytosis (immediate response), which mainly affects natural killer (NK) cells, CD8+ T cells, and γδ T cells, is essentially induced by increased blood pressure and by adrenaline stimulation of β2-adrenergic receptors on the surface of lymphocytes. This is followed by a transient lymphopenia (delayed immune response) lasting up to approximately 24 hours, during which previously mobilized cells are redistributed to target tissues. This lymphopenia may improve immune surveillance. (Created in BioRender. Puta, C. (2025) https://BioRender.com/l87d474)
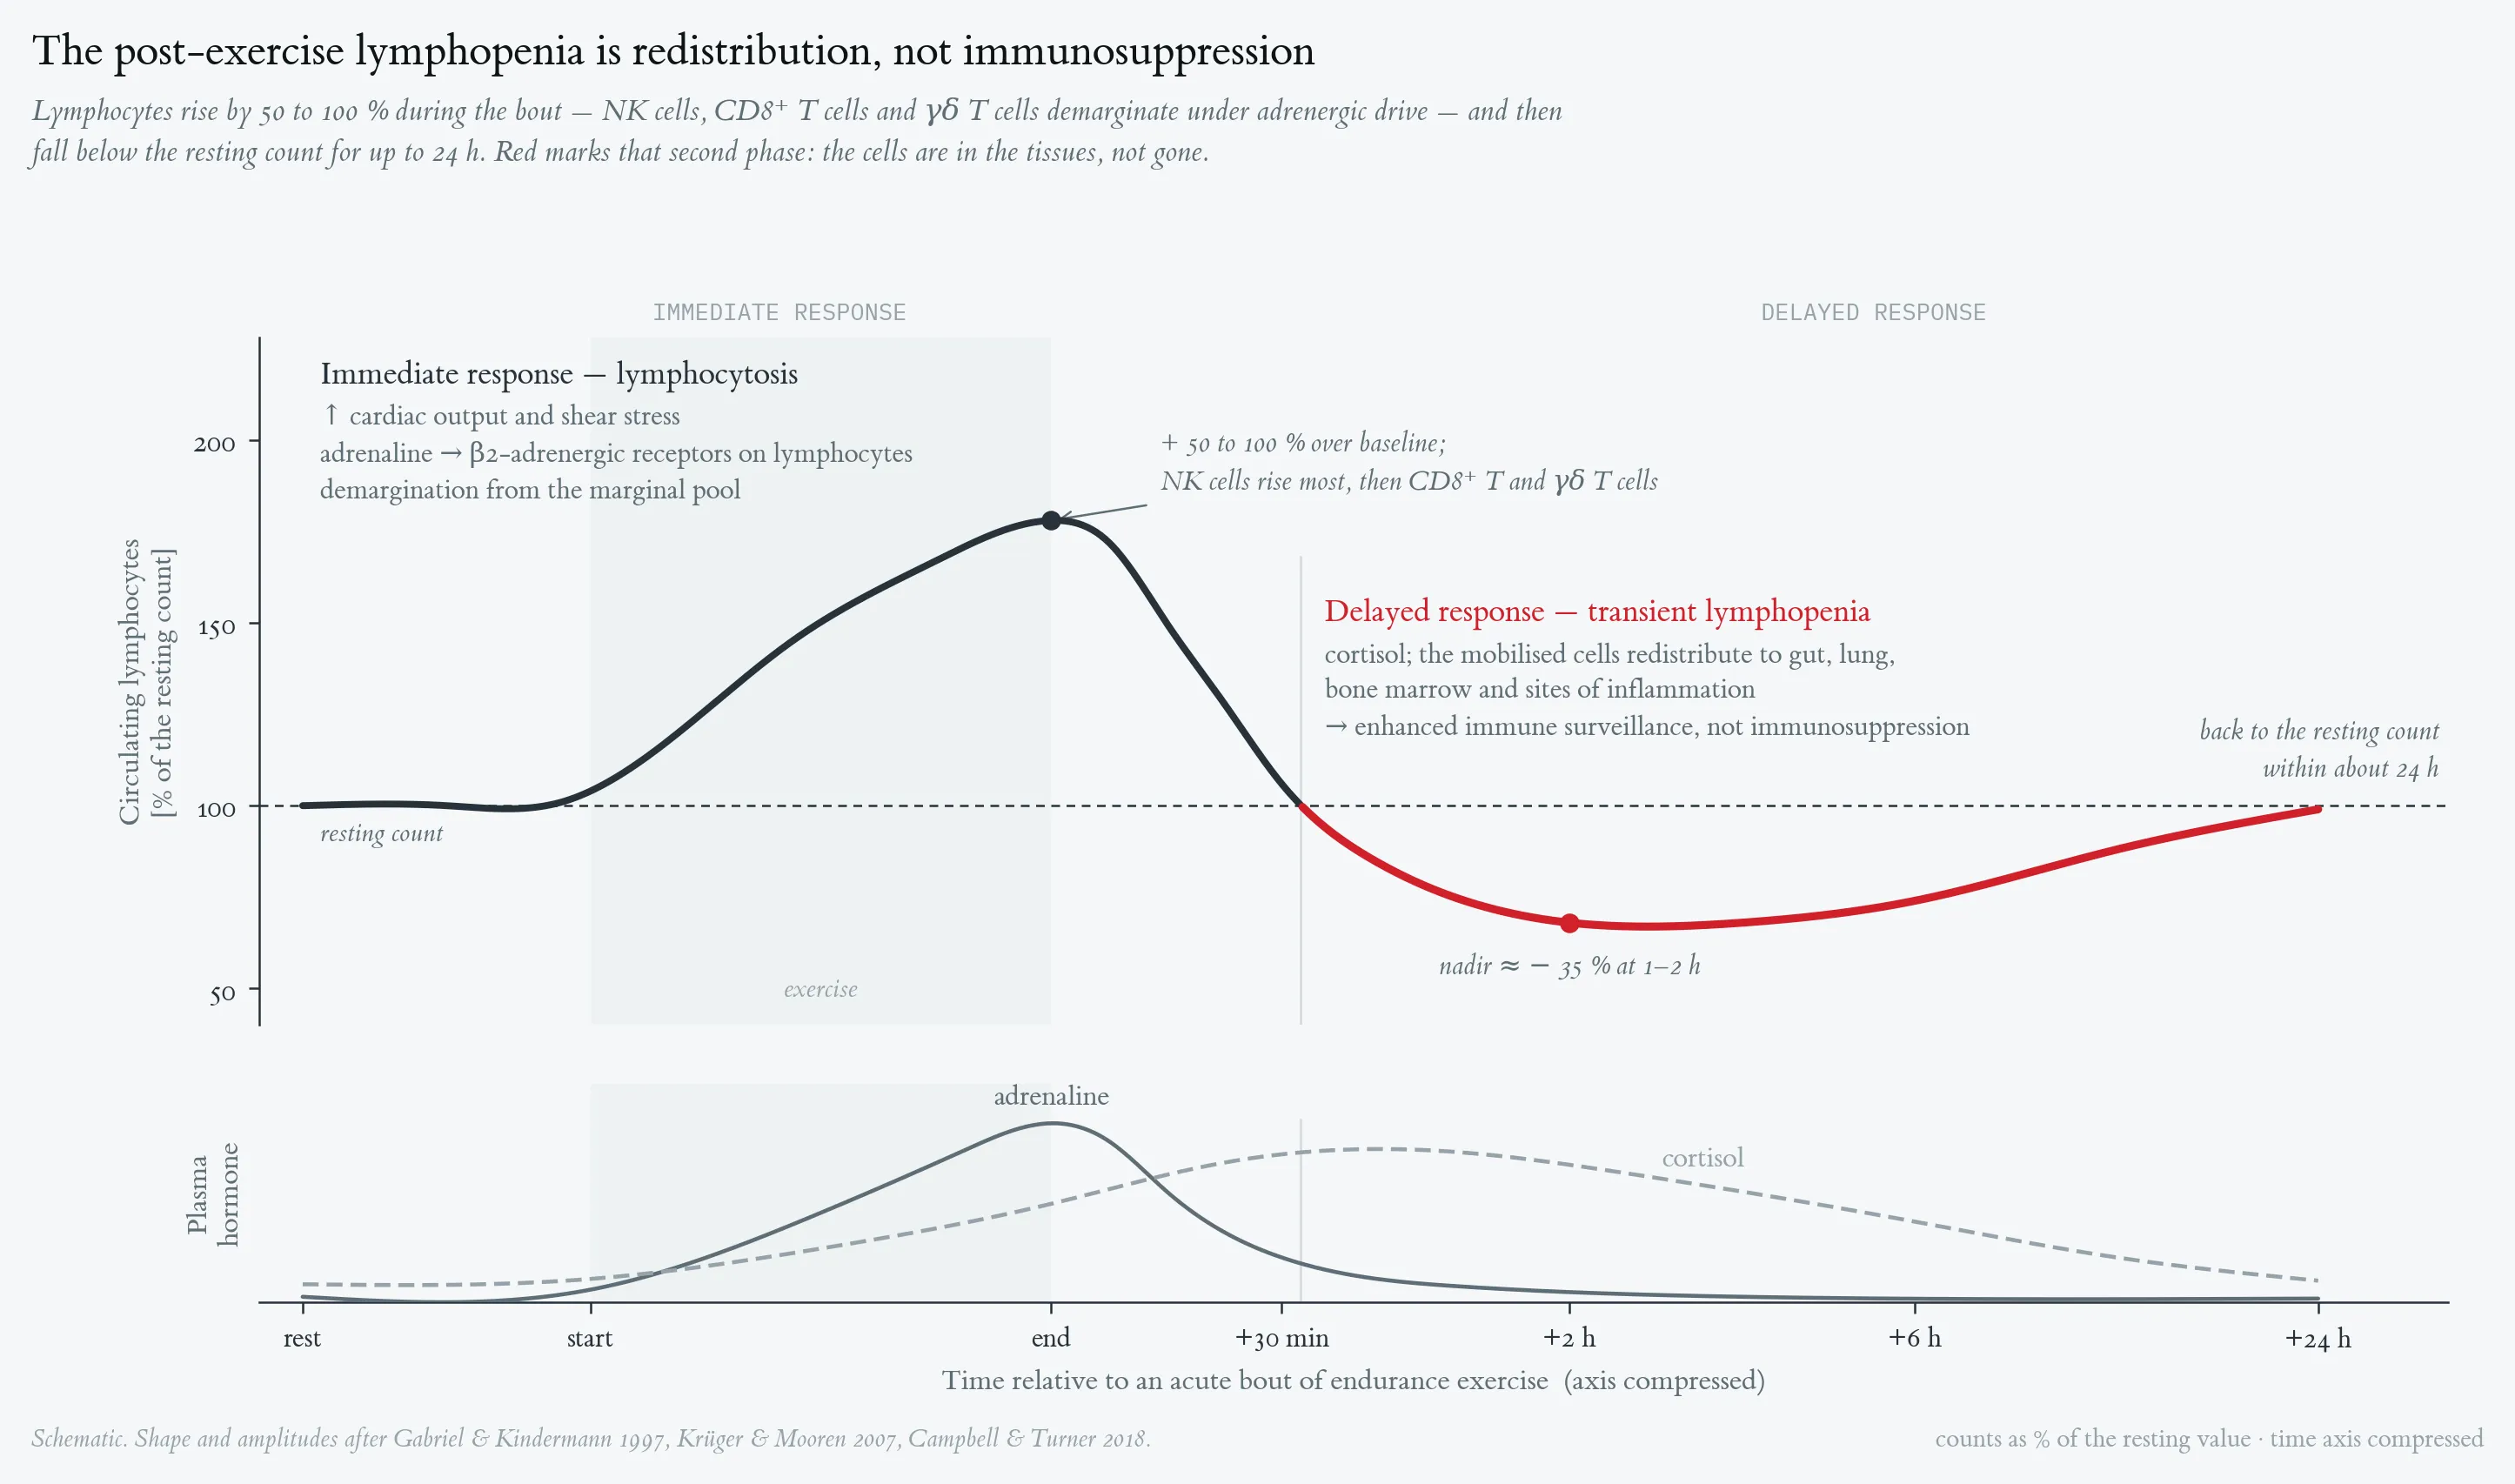
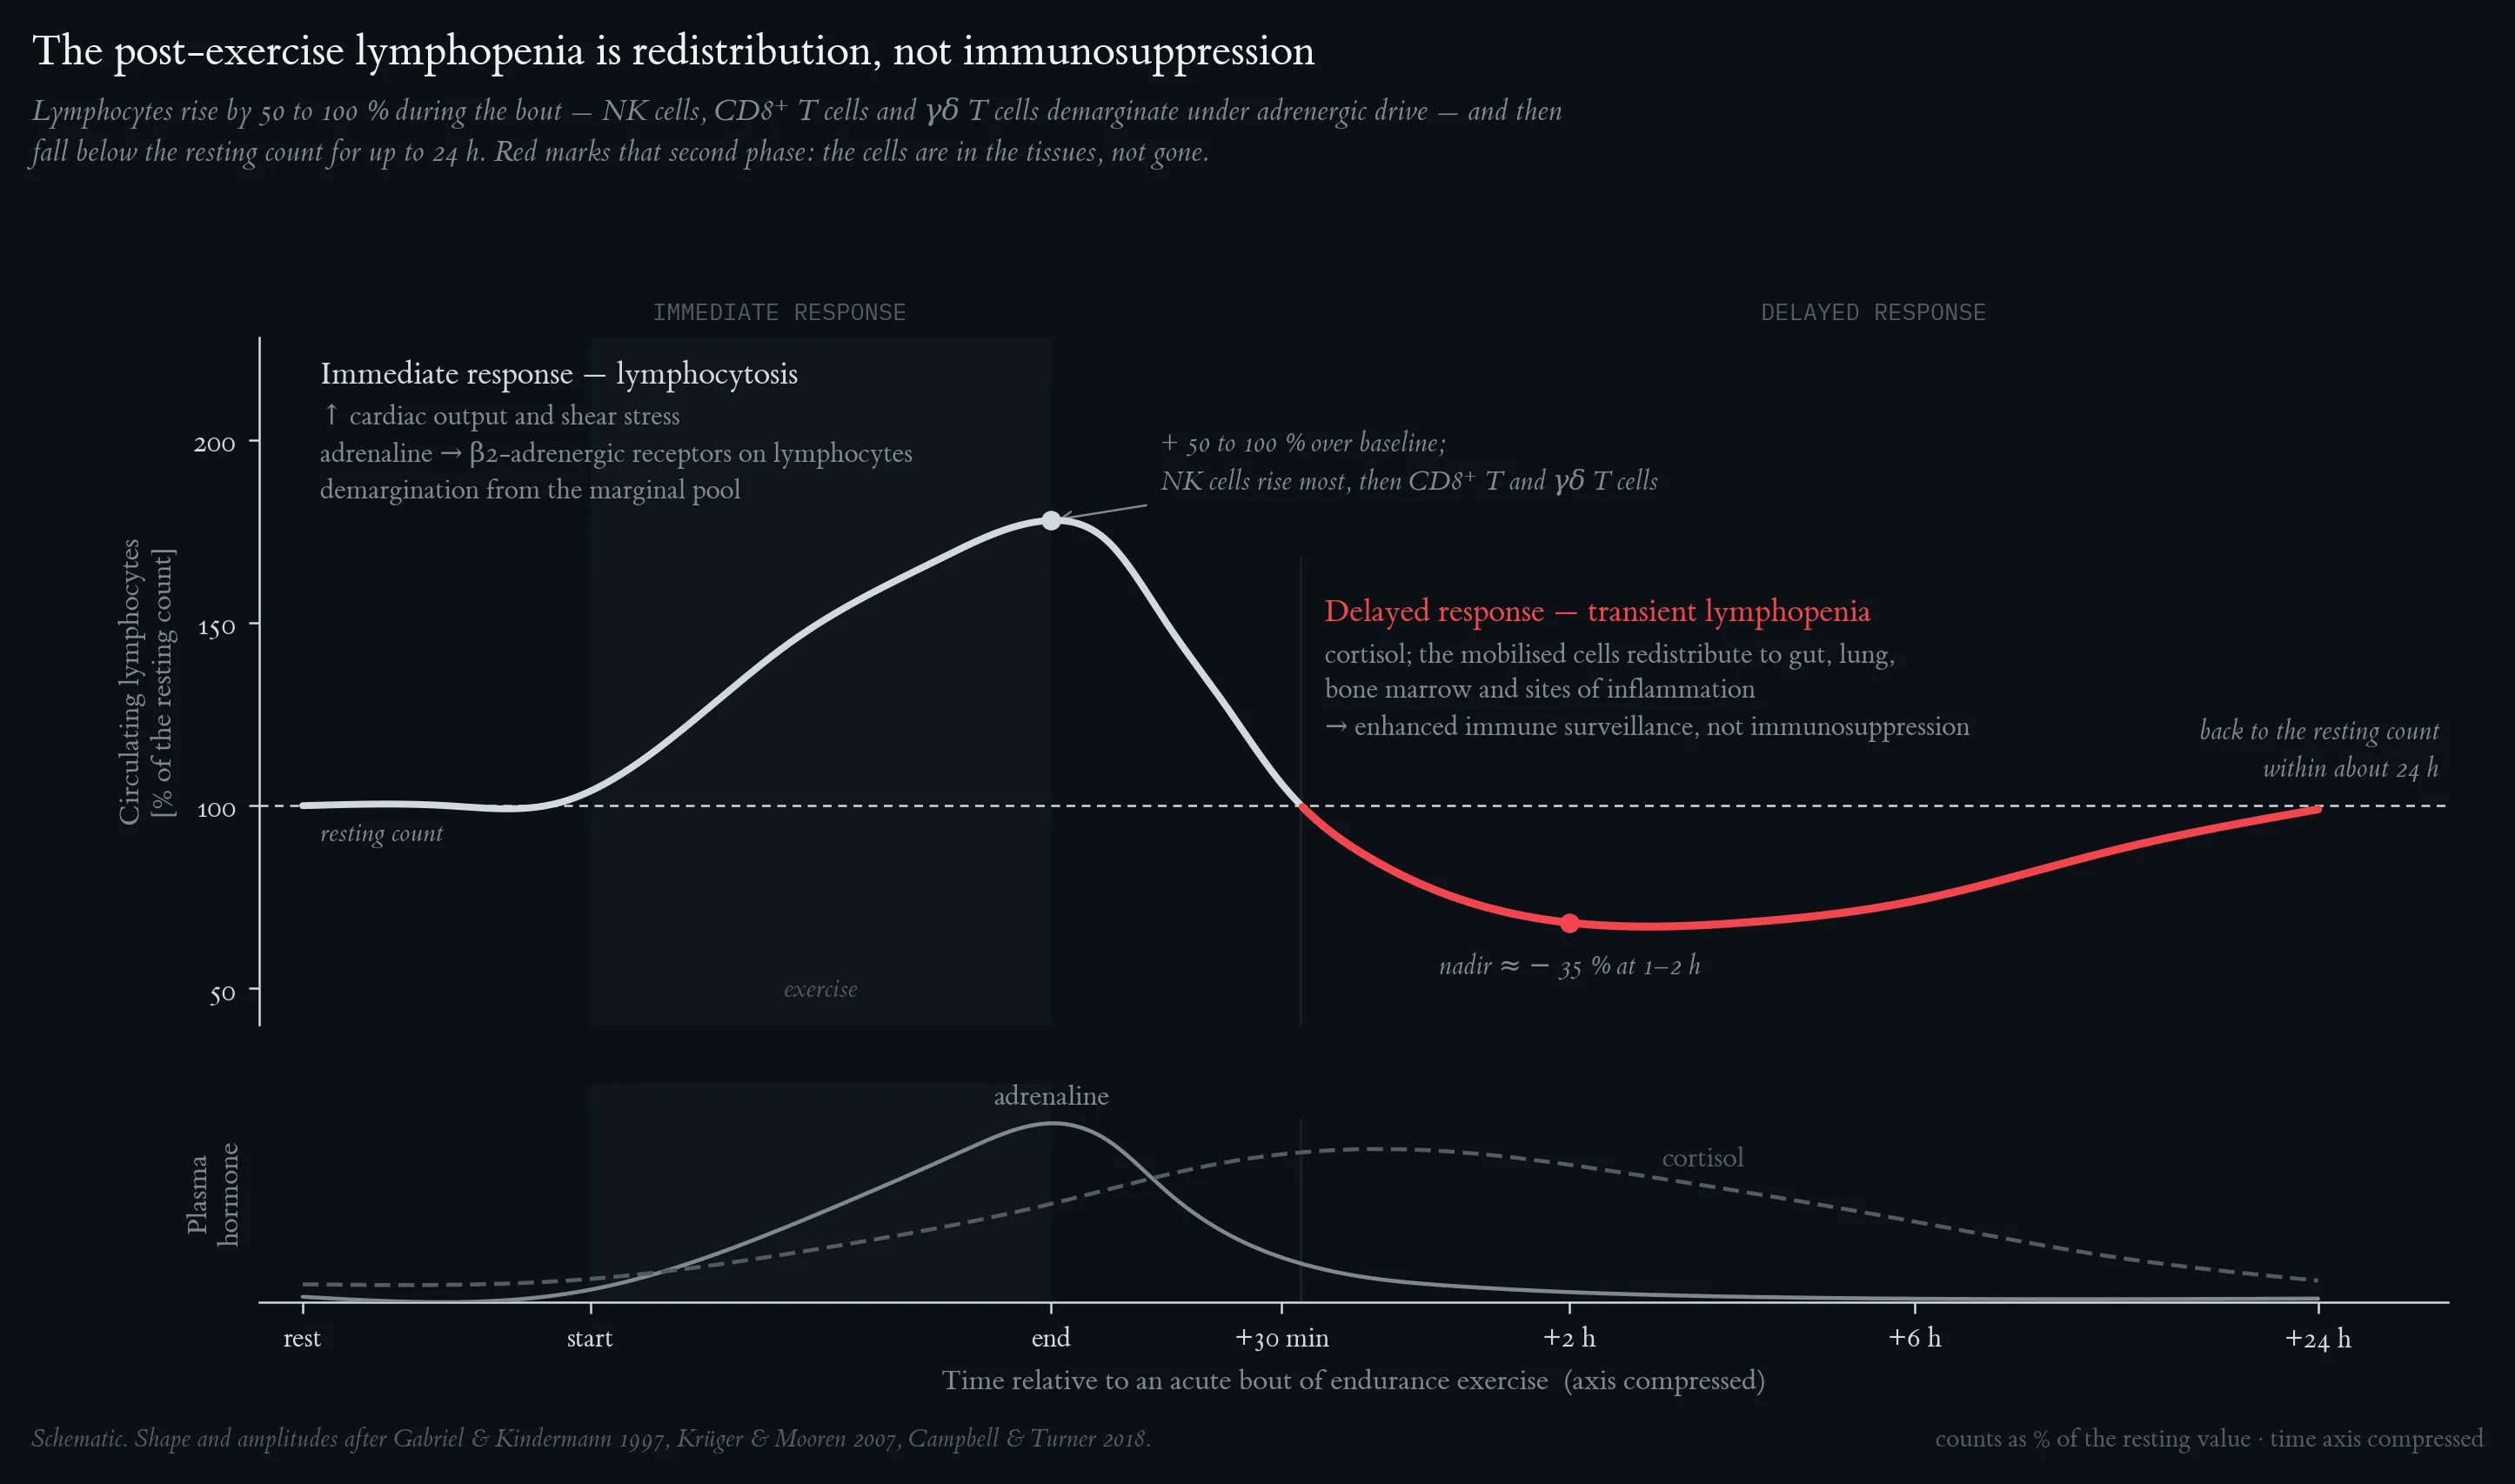
The biphasic immune cell response to dynamic acute physical stress. The lymphocytosis (immediate response), which mainly affects natural killer (NK) cells, CD8+ T cells, and γδ T cells, is essentially induced by increased blood pressure and by adrenaline stimulation of β2-adrenergic receptors on the surface of lymphocytes. This is followed by a transient lymphopenia (delayed immune response) lasting up to approximately 24 hours, during which previously mobilized cells are redistributed to target tissues. This lymphopenia may improve immune surveillance. (Created in BioRender. Puta, C. (2025) https://BioRender.com/l87d474)
Myokine IL-6 as a short-term energy allocator. IL-6 fulfils three characteristics of a short-term energy allocator during physical activity. a, Energy sensing. Physiological components of prolonged muscle activity — lactic-acid buildup, reactive oxygen species (ROS) production, and muscle glycogen depletion — signal that intramuscular energy stores are depleted and precipitate myokine secretion of IL-6. b, Energy liberation. When myokine IL-6 is released into circulation, it liberates somatic energy by upregulating lipolysis and gluconeogenesis throughout the body. Myokine IL-6 also acts indirectly to increase catabolism and energy mobilization by inducing cortisol secretion. c, Energy allocation. Myokine IL-6 increases energy uptake by the muscle through increases in insulin receptor sensitivity, GLUT4 expression, and fatty acid transporter expression. Evidence suggests that it also allocates energy to the muscle indirectly by transiently downregulating other energy-consuming processes, such as immune activity. SCFA, short-chain fatty acids. Adapted from Kistner, Pedersen & Lieberman, Nat. Metab. 4, 170--179 (2022); created with biorender.com.
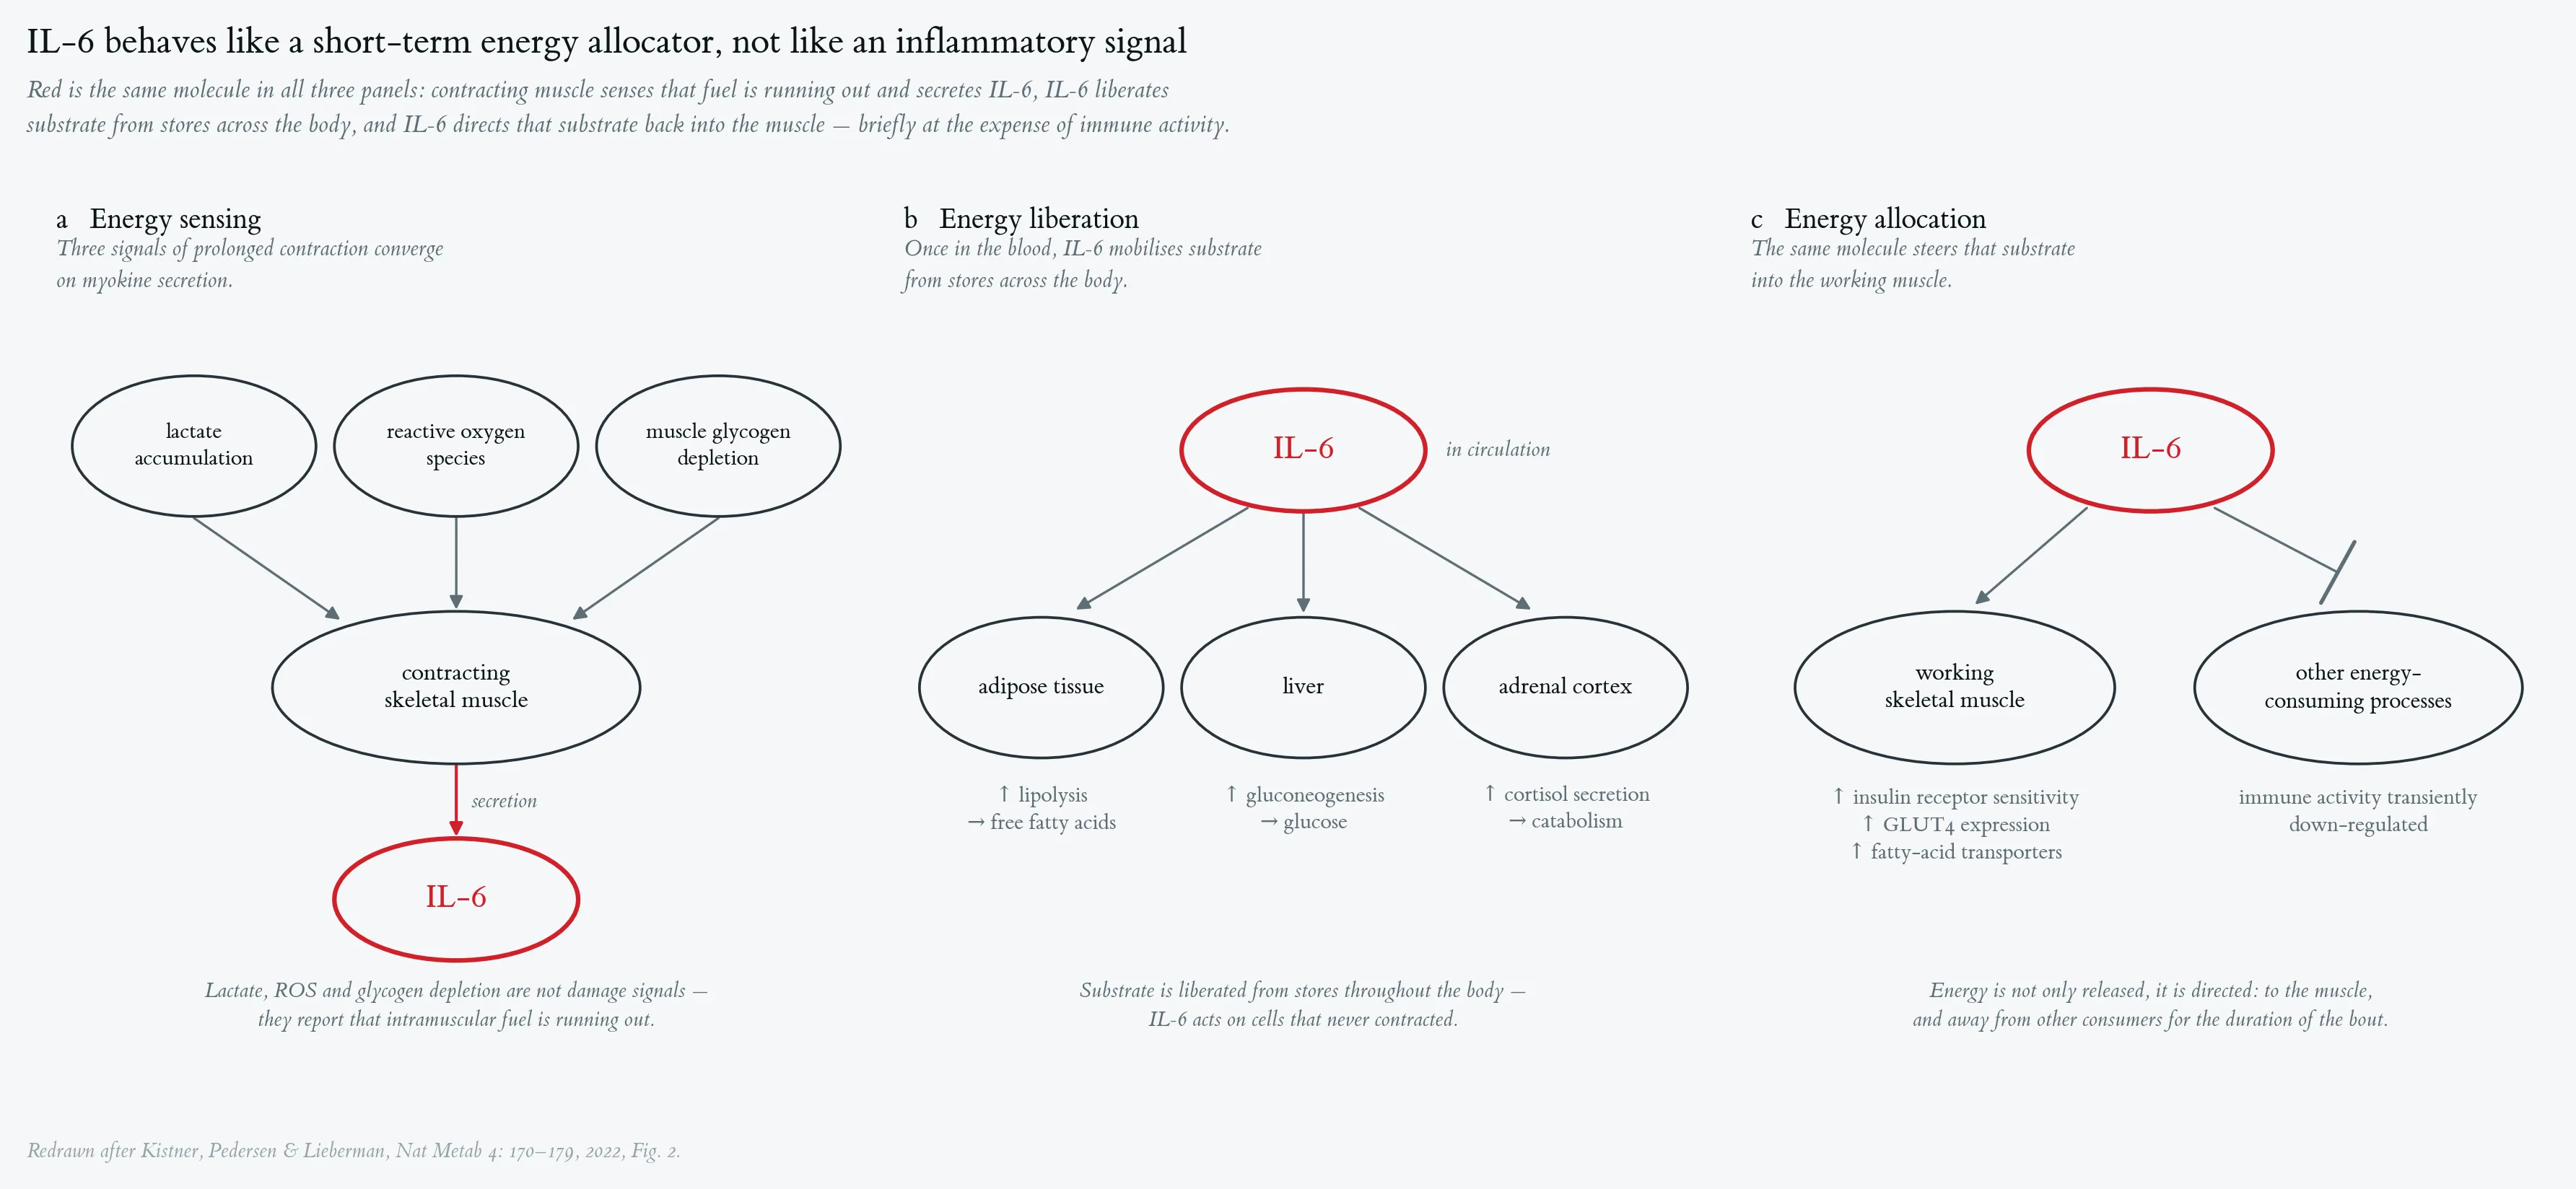
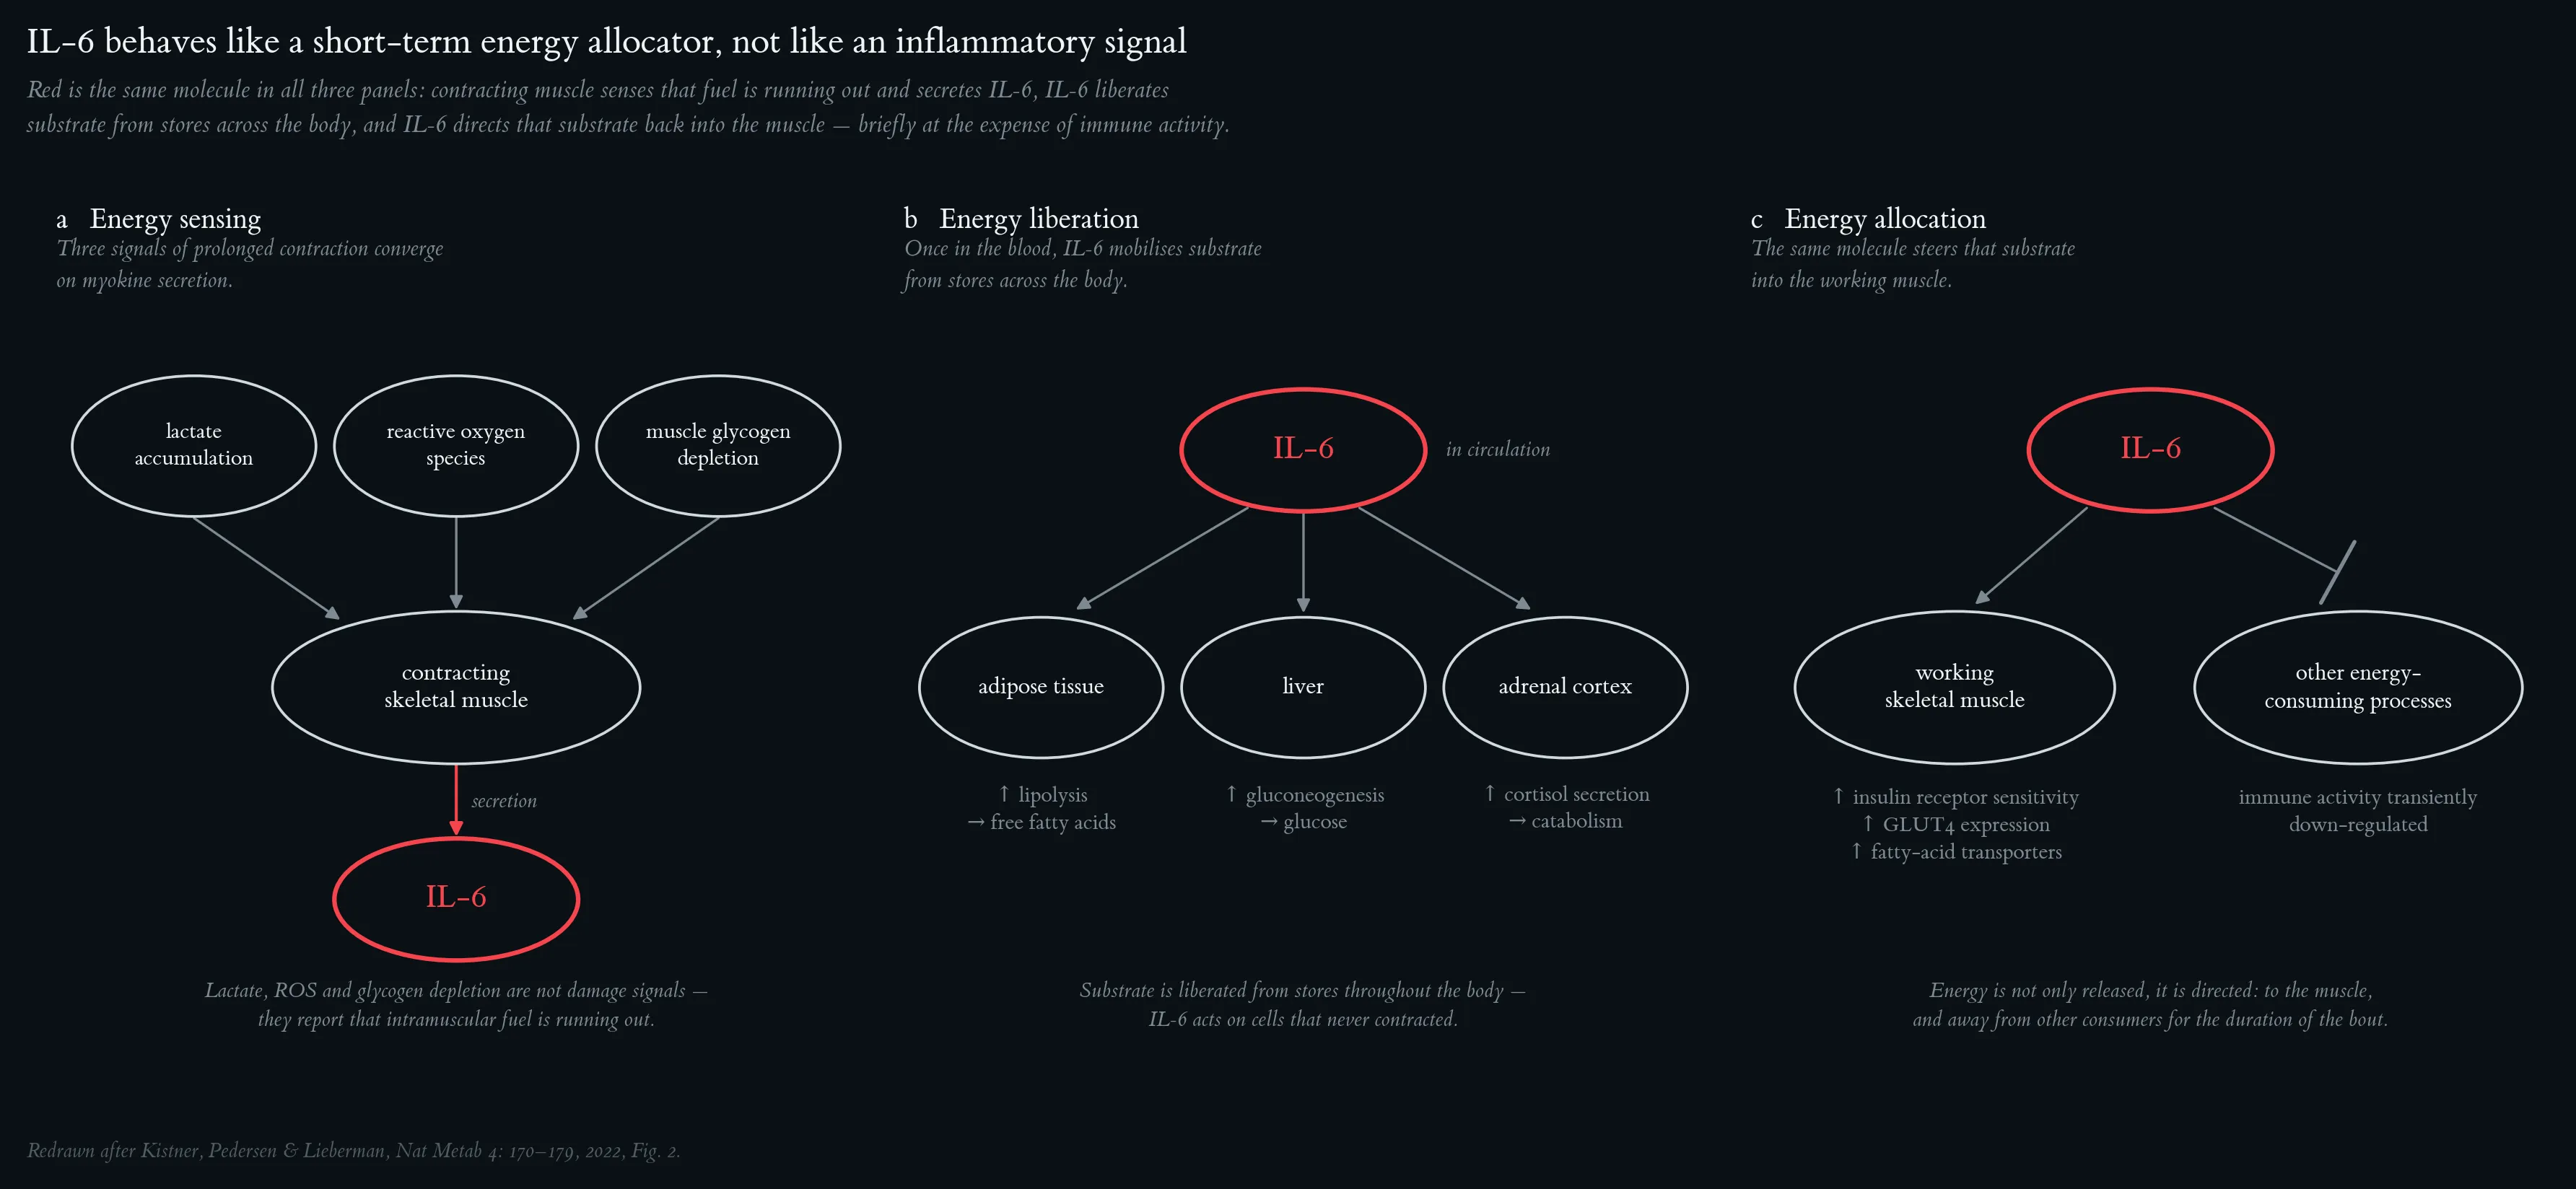
Myokine IL-6 as a short-term energy allocator. IL-6 fulfils three characteristics of a short-term energy allocator during physical activity. a, Energy sensing. Physiological components of prolonged muscle activity — lactic-acid buildup, reactive oxygen species (ROS) production, and muscle glycogen depletion — signal that intramuscular energy stores are depleted and precipitate myokine secretion of IL-6. b, Energy liberation. When myokine IL-6 is released into circulation, it liberates somatic energy by upregulating lipolysis and gluconeogenesis throughout the body. Myokine IL-6 also acts indirectly to increase catabolism and energy mobilization by inducing cortisol secretion. c, Energy allocation. Myokine IL-6 increases energy uptake by the muscle through increases in insulin receptor sensitivity, GLUT4 expression, and fatty acid transporter expression. Evidence suggests that it also allocates energy to the muscle indirectly by transiently downregulating other energy-consuming processes, such as immune activity. SCFA, short-chain fatty acids. Adapted from Kistner, Pedersen & Lieberman, Nat. Metab. 4, 170--179 (2022); created with biorender.com.
Graphical abstract from Ringleb et al. (2026). This systematic review and meta-analysis, which examined the effects of acute endurance training on immunoregulatory myokines, showed significant small-moderate to very large positive effect sizes for IL-6, IL-10, IL-1ra, IL-8, IL-15, and TNF-α. These effects were significantly moderated by risk of bias, sex, age, V̇O2peak, experience, type of exercise, intensity, duration, dose, sample, fasting status, and time of day. This suggests that endurance training is a key component in the treatment of a variety of diseases. Adapted from Ringleb et al. (2026).
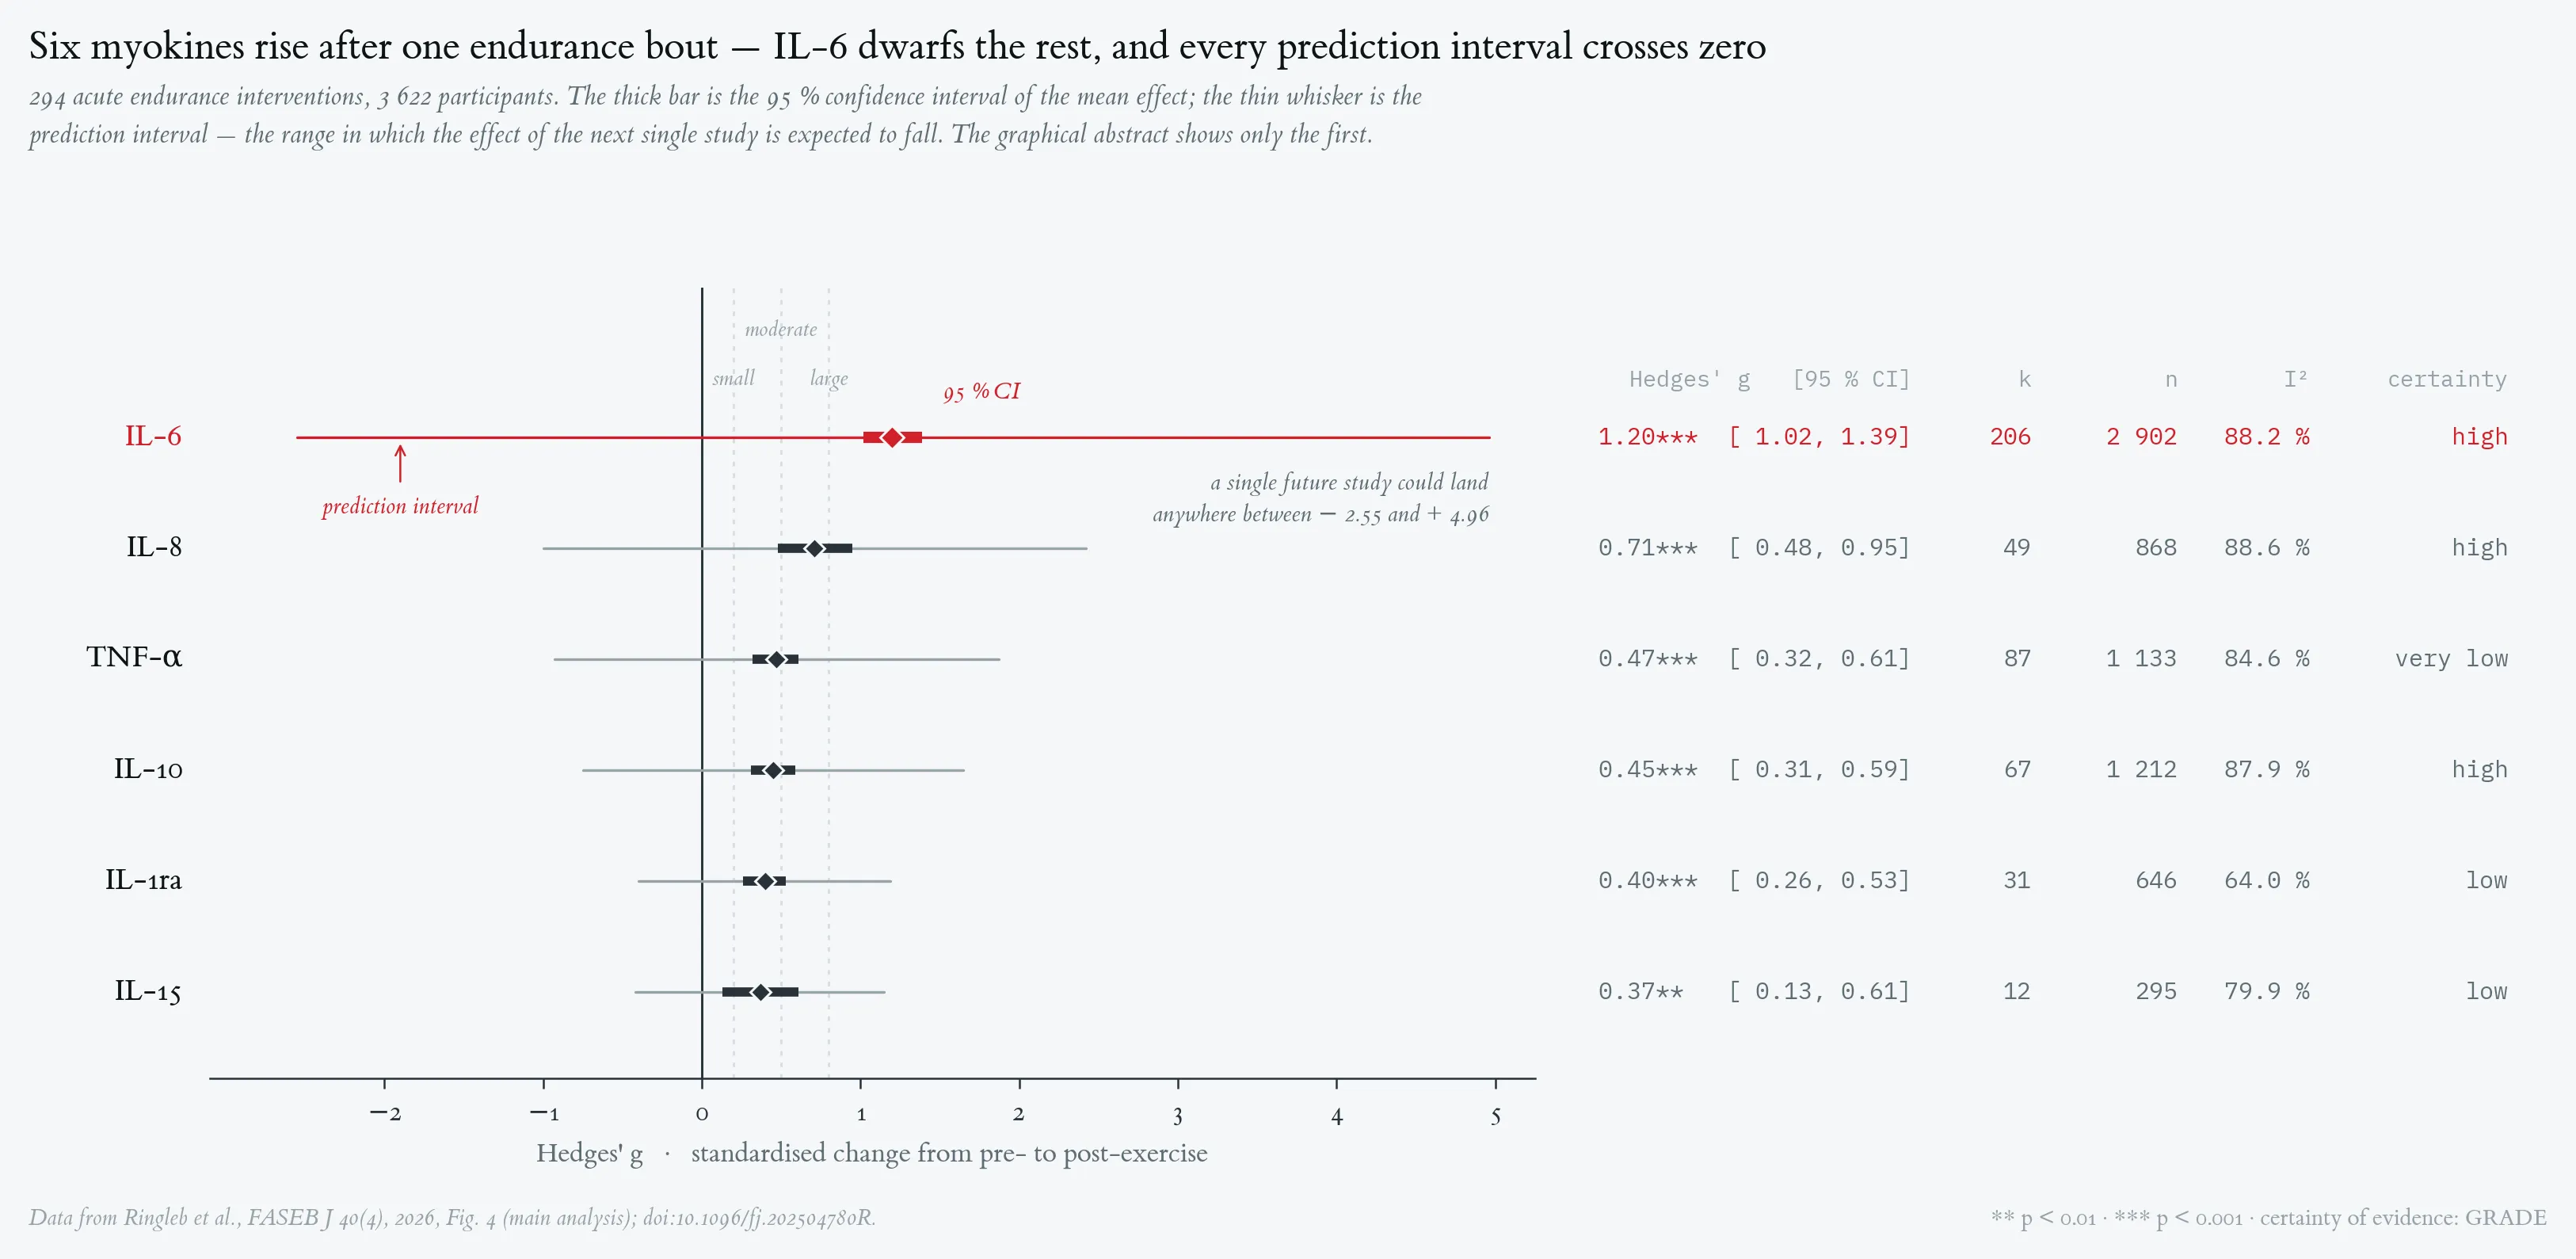
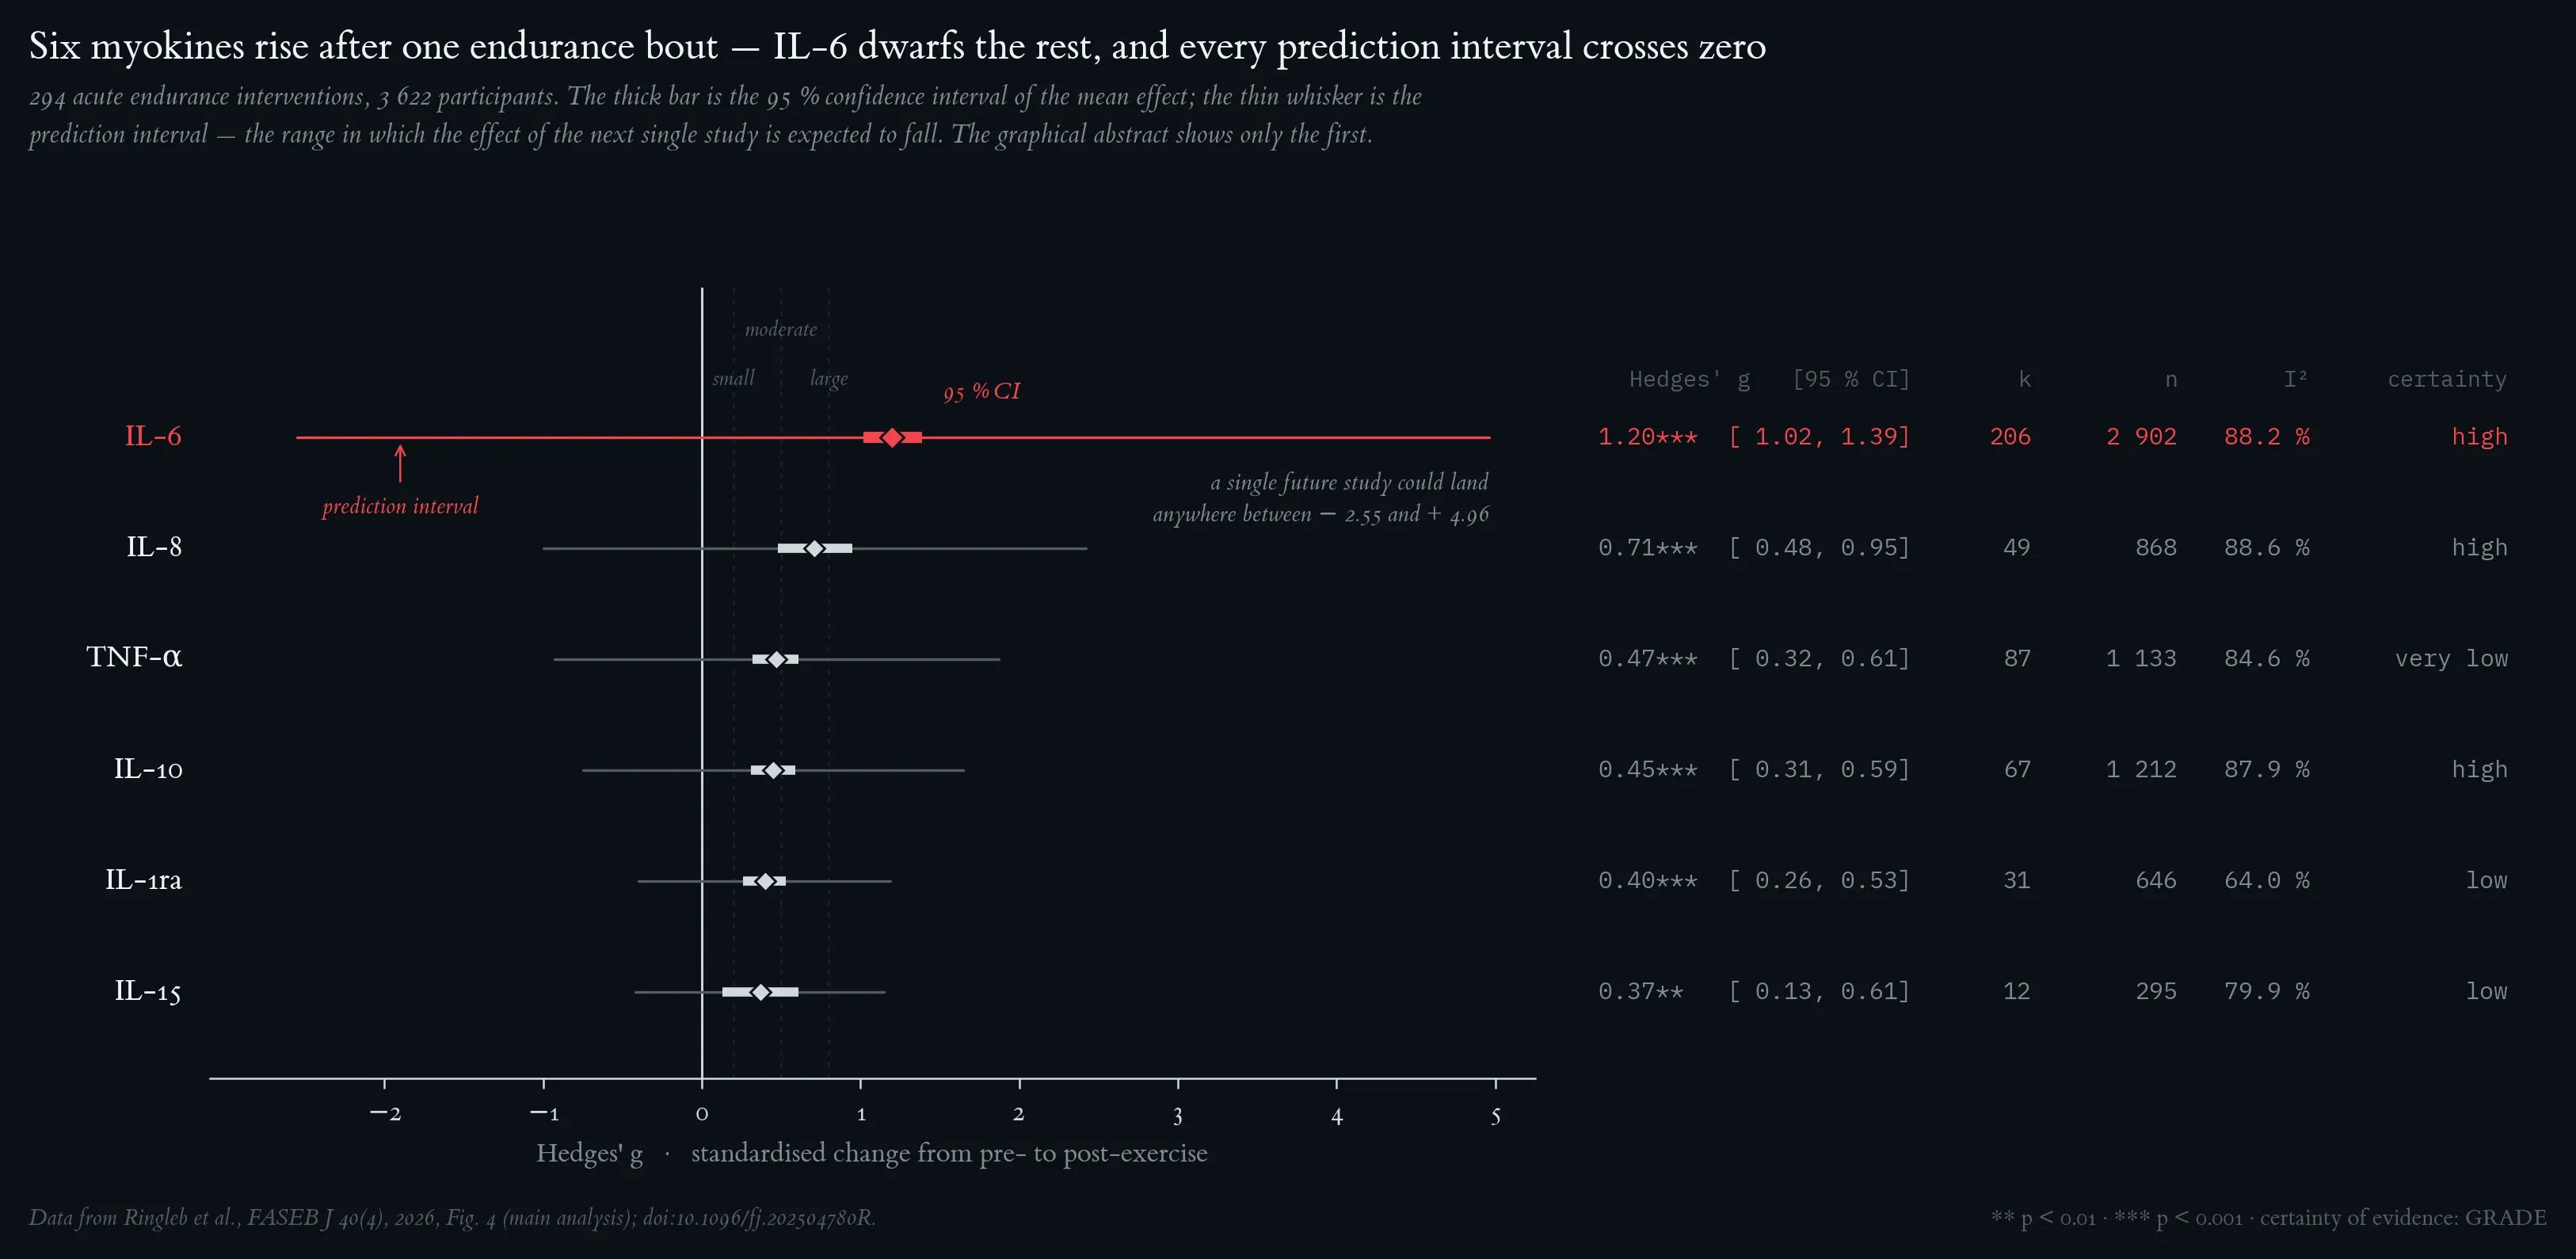
Graphical abstract from Ringleb et al. (2026). This systematic review and meta-analysis, which examined the effects of acute endurance training on immunoregulatory myokines, showed significant small-moderate to very large positive effect sizes for IL-6, IL-10, IL-1ra, IL-8, IL-15, and TNF-α. These effects were significantly moderated by risk of bias, sex, age, V̇O2peak, experience, type of exercise, intensity, duration, dose, sample, fasting status, and time of day. This suggests that endurance training is a key component in the treatment of a variety of diseases. Adapted from Ringleb et al. (2026).
Lecture 4: The Acute Immune Response to Exercise
Absolute blood concentrations of four leukocyte populations before, during and after a single endurance bout. (A) neutrophils, (B) total lymphocytes including NK cells, (C) CD14⁺⁺CD16⁻ regular monocytes, (D) CD14⁺CD16⁺⁺ mature monocytes (premacrophages). Eight regional-class triathletes (26 ± 2 yr; V̇O₂max 60 ± 3 mL·min⁻¹·kg⁻¹) cycled for 70 ± 12 min at 100 % of the individual anaerobic threshold. Sampling: at rest, after 30 min of exercise, during the last 2 min of exercise (End), then 30 min, 2 h, 6 h and 24 h post-exercise; the shaded band marks the exercise period and the axis break precedes the 24-h sample. Medians and quartiles; (+)/+/++/+++ p < 0.1 / 0.05 / 0.01 / 0.001 vs. before exercise. Note the opposite post-exercise trajectories of neutrophils (delayed second rise peaking at 2 h) and lymphocytes (fall below baseline within 30 min), and the divergence of the two monocyte subsets. Redrawn after Gabriel & Kindermann 1997, Fig. 1.
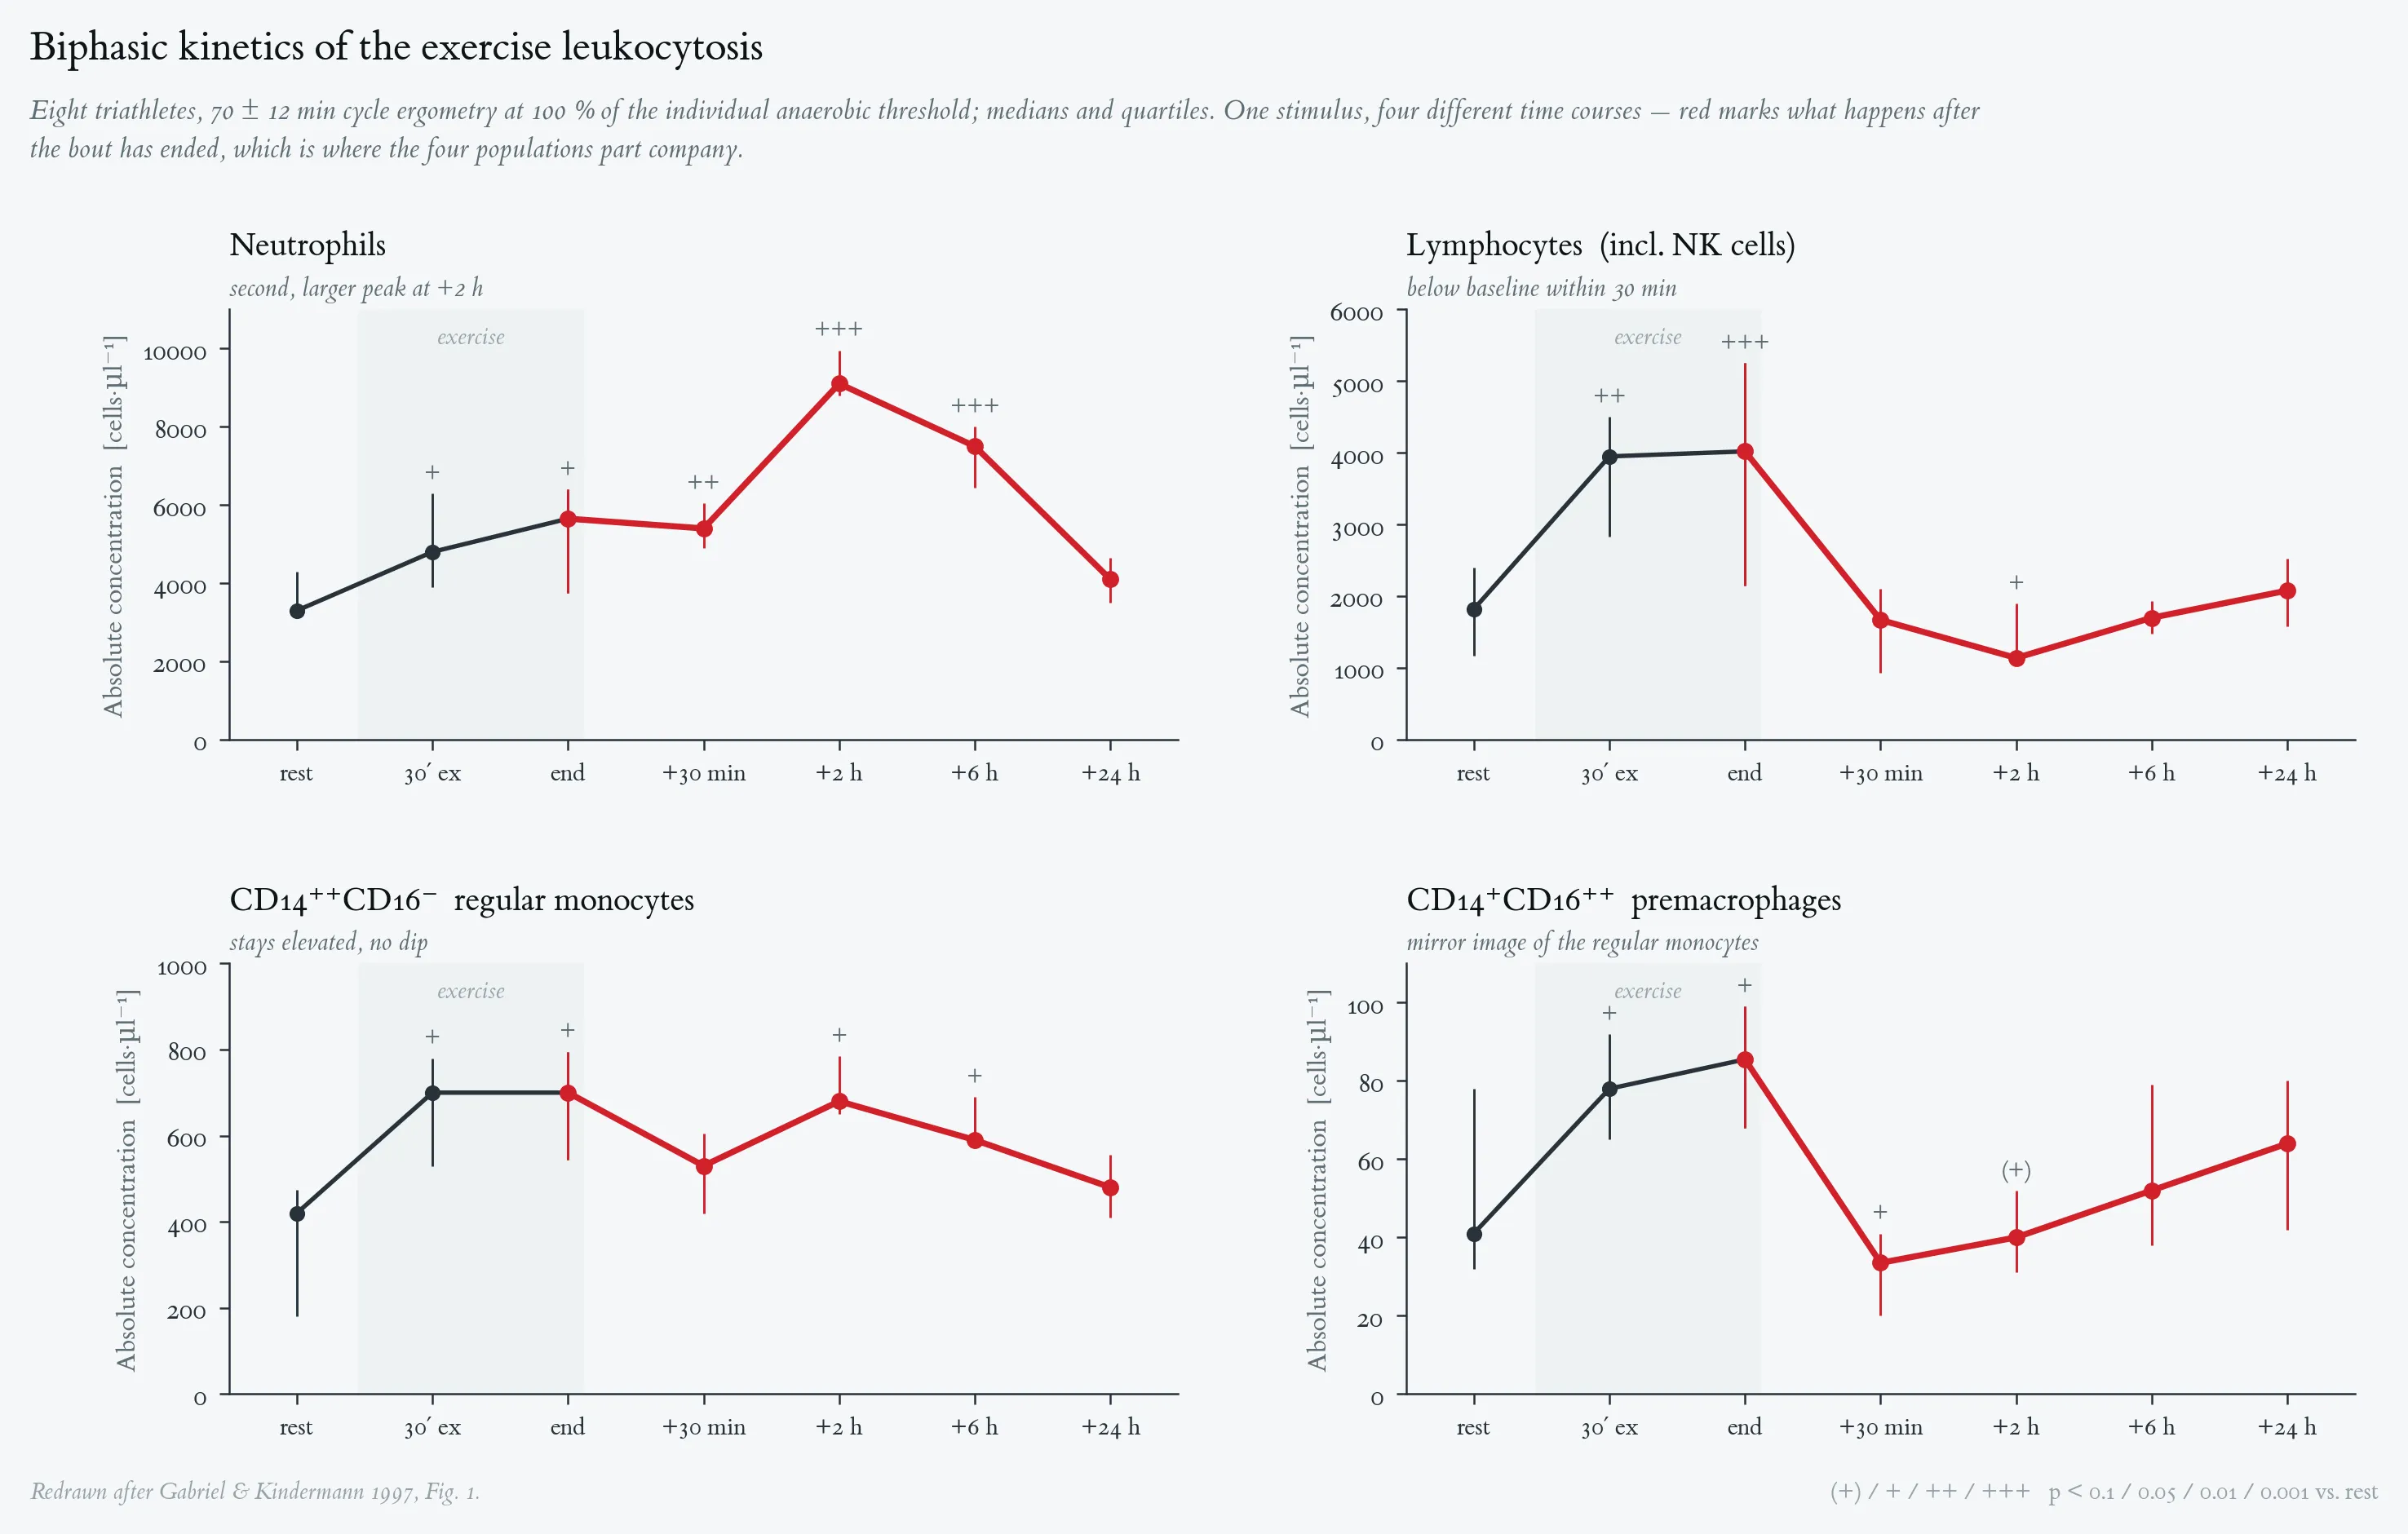
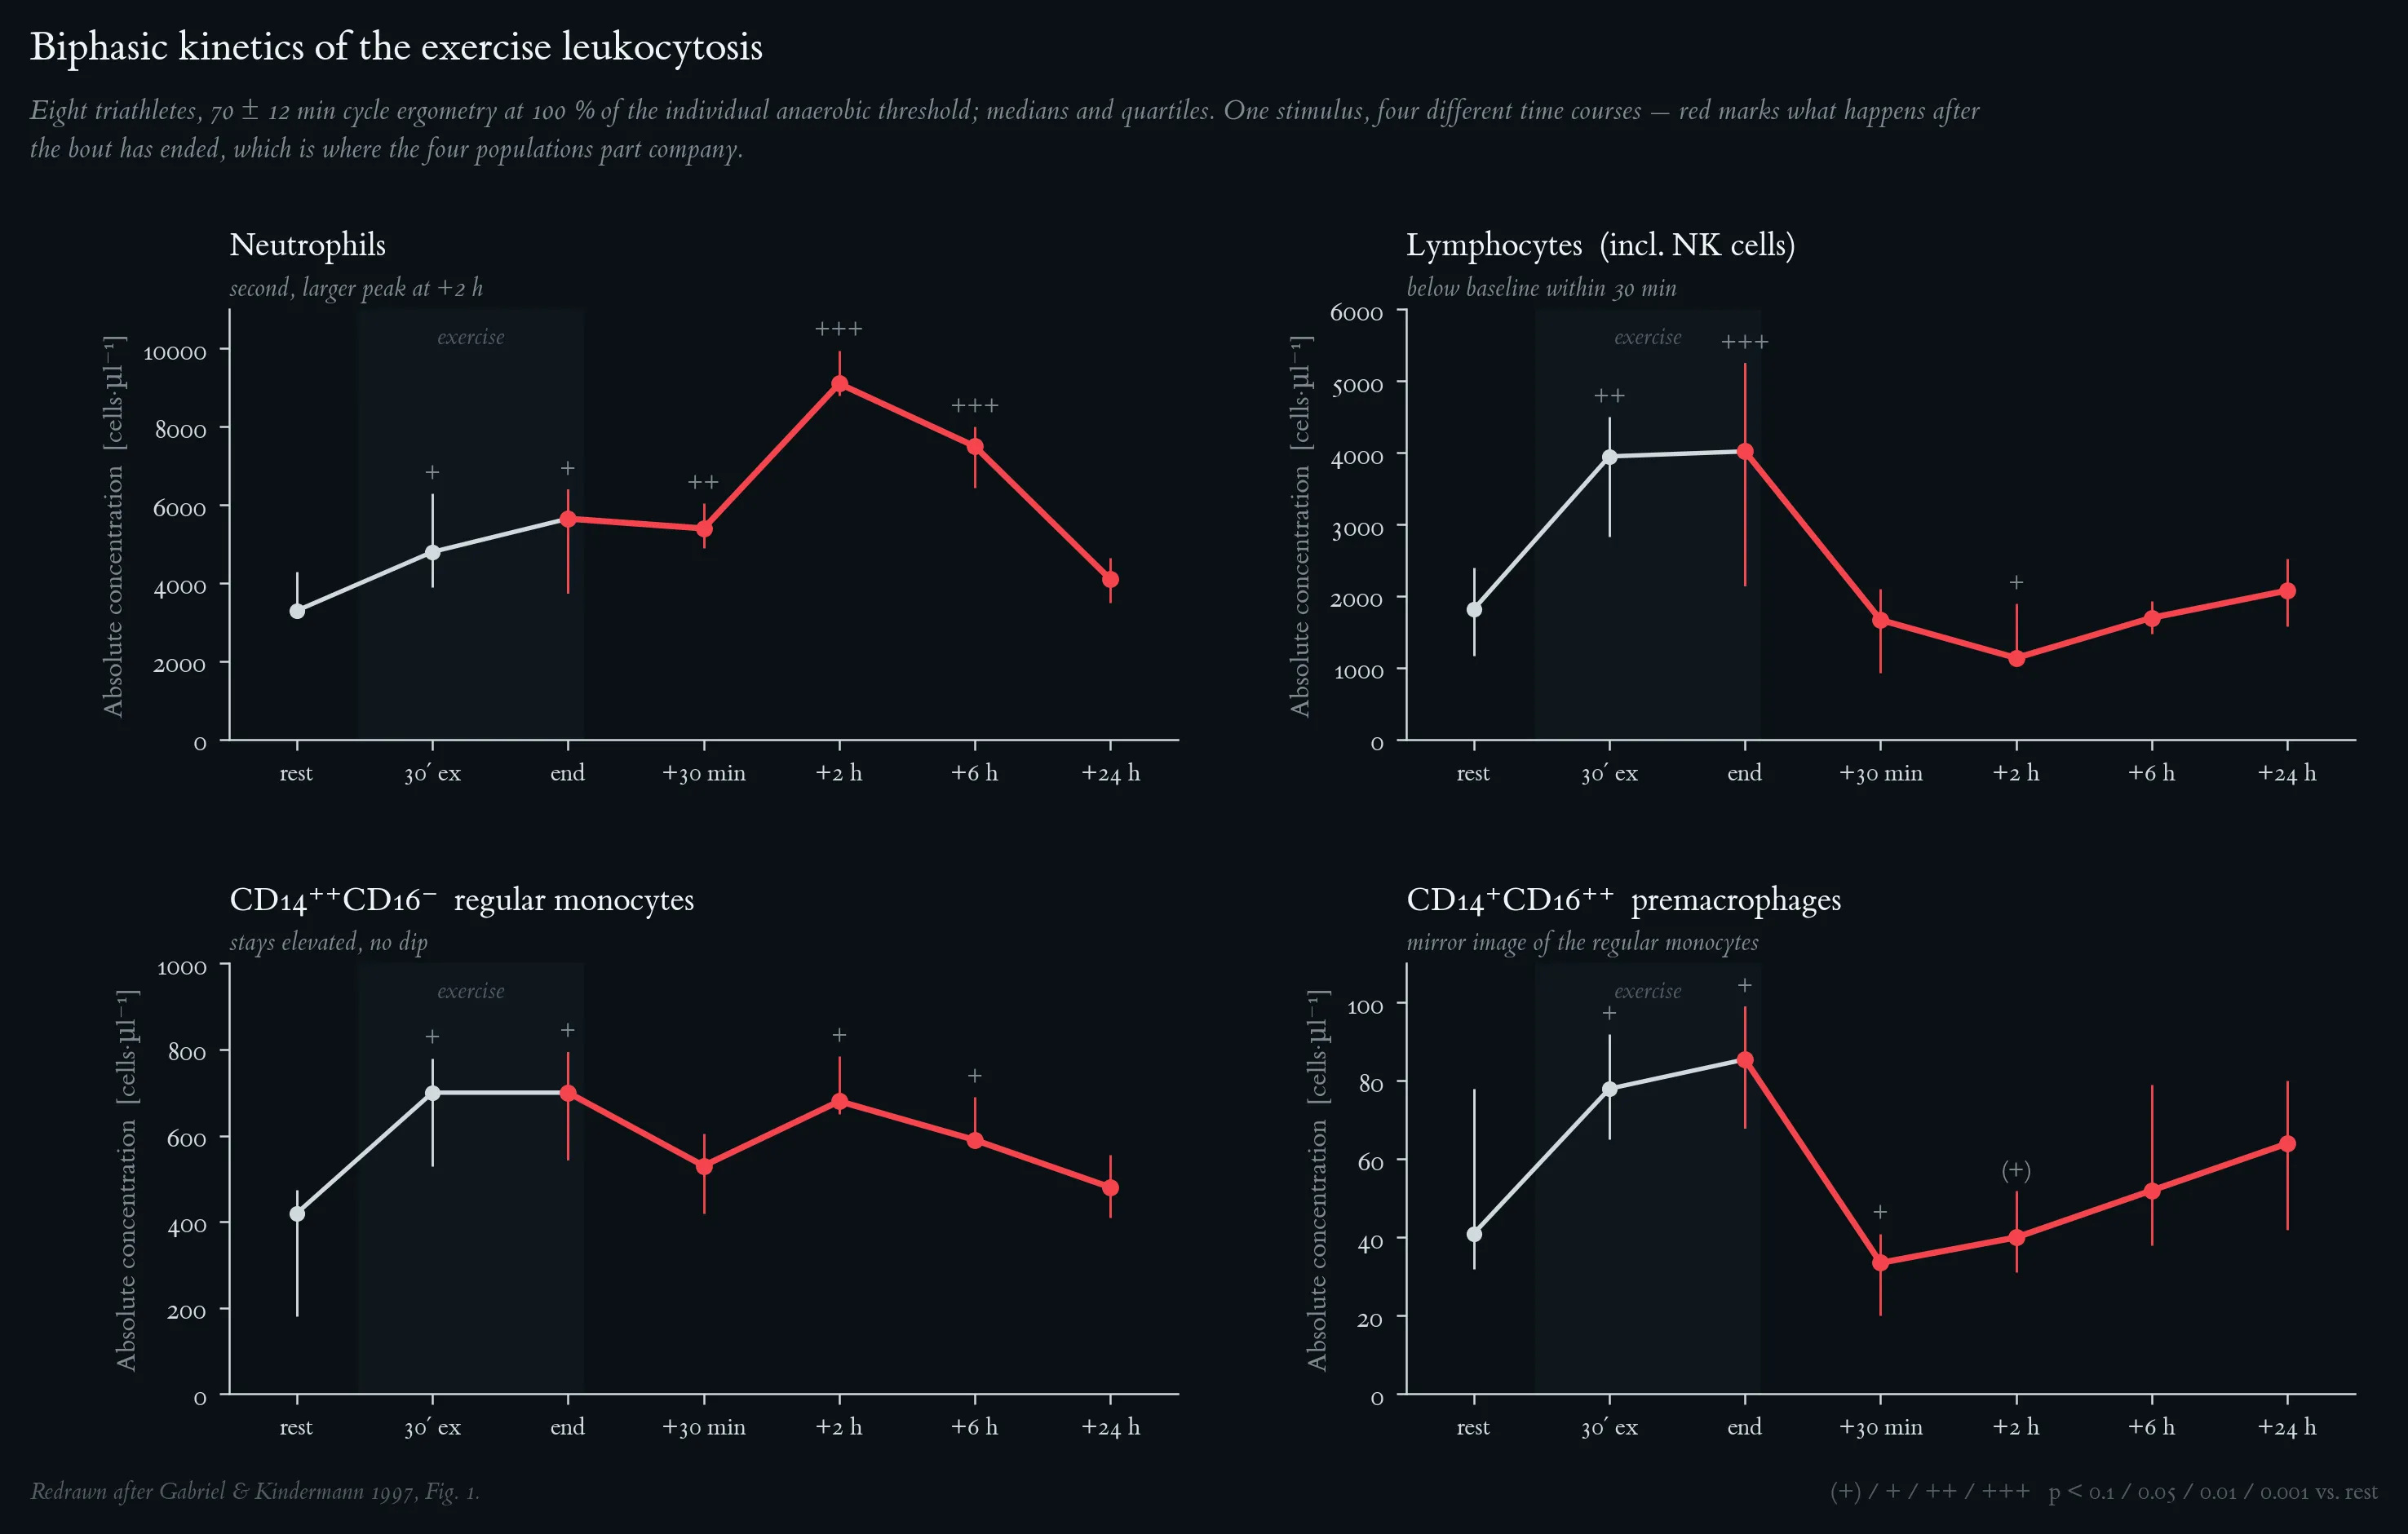
Absolute blood concentrations of four leukocyte populations before, during and after a single endurance bout. (A) neutrophils, (B) total lymphocytes including NK cells, (C) CD14⁺⁺CD16⁻ regular monocytes, (D) CD14⁺CD16⁺⁺ mature monocytes (premacrophages). Eight regional-class triathletes (26 ± 2 yr; V̇O₂max 60 ± 3 mL·min⁻¹·kg⁻¹) cycled for 70 ± 12 min at 100 % of the individual anaerobic threshold. Sampling: at rest, after 30 min of exercise, during the last 2 min of exercise (End), then 30 min, 2 h, 6 h and 24 h post-exercise; the shaded band marks the exercise period and the axis break precedes the 24-h sample. Medians and quartiles; (+)/+/++/+++ p < 0.1 / 0.05 / 0.01 / 0.001 vs. before exercise. Note the opposite post-exercise trajectories of neutrophils (delayed second rise peaking at 2 h) and lymphocytes (fall below baseline within 30 min), and the divergence of the two monocyte subsets. Redrawn after Gabriel & Kindermann 1997, Fig. 1.
Absolute leukocyte concentration before and after a 60-s all-out cycle-ergometer test. Eight healthy male athletes (29 ± 4 yr, 74 ± 5 kg, 178 ± 7 cm) performed a single 60-s maximal test (489 ± 34 W; peak lactate 14.1 mmol·l⁻¹, reached in the 6th minute post-exercise). Blood was sampled before (pre), within the first minute after (0), and 2, 4, 8, 16, 32 and 48 min after the end of the test; the shaded band marks the test. Values are corrected for plasma-volume shifts. Means and SD (upper bar only); *** p < 0.001 vs. pre (analysis of variance, Newman-Keuls post-hoc test). Leukocytes peak at 8 min post (≈ +57 %) and have returned to baseline by 32 min — a time course far too fast for de novo production, and therefore indicative of reversible mobilisation from the marginal pool. Redrawn after Gabriel et al. 2003, Fig. 2.
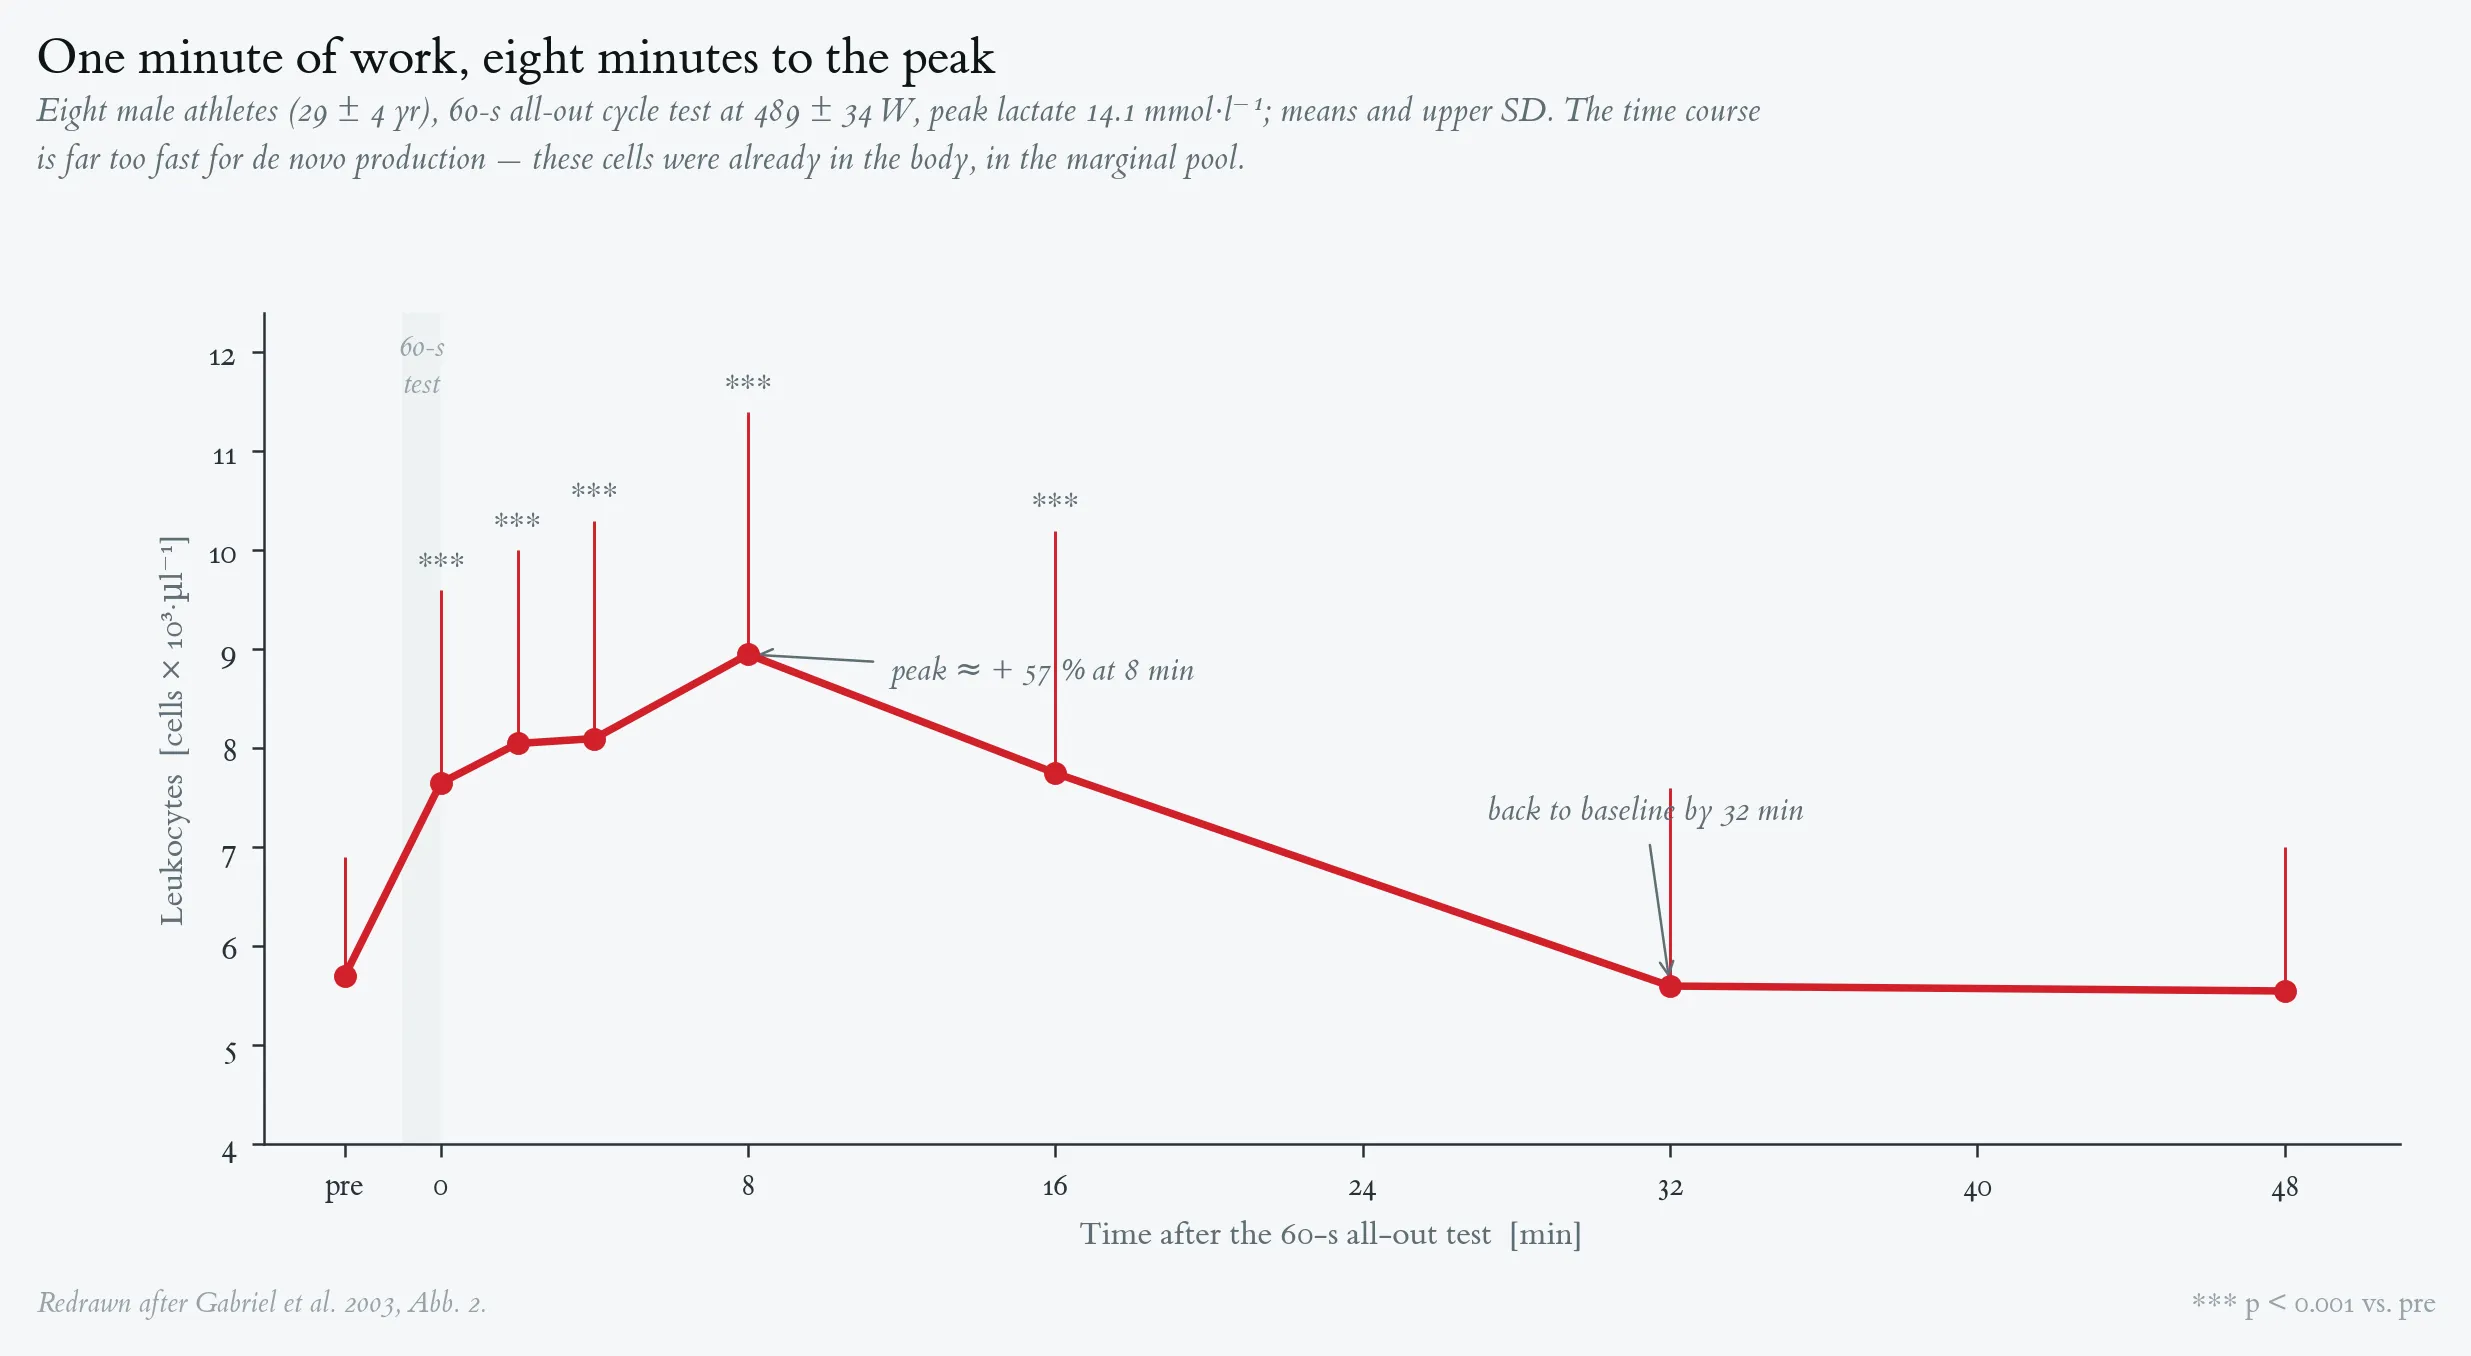
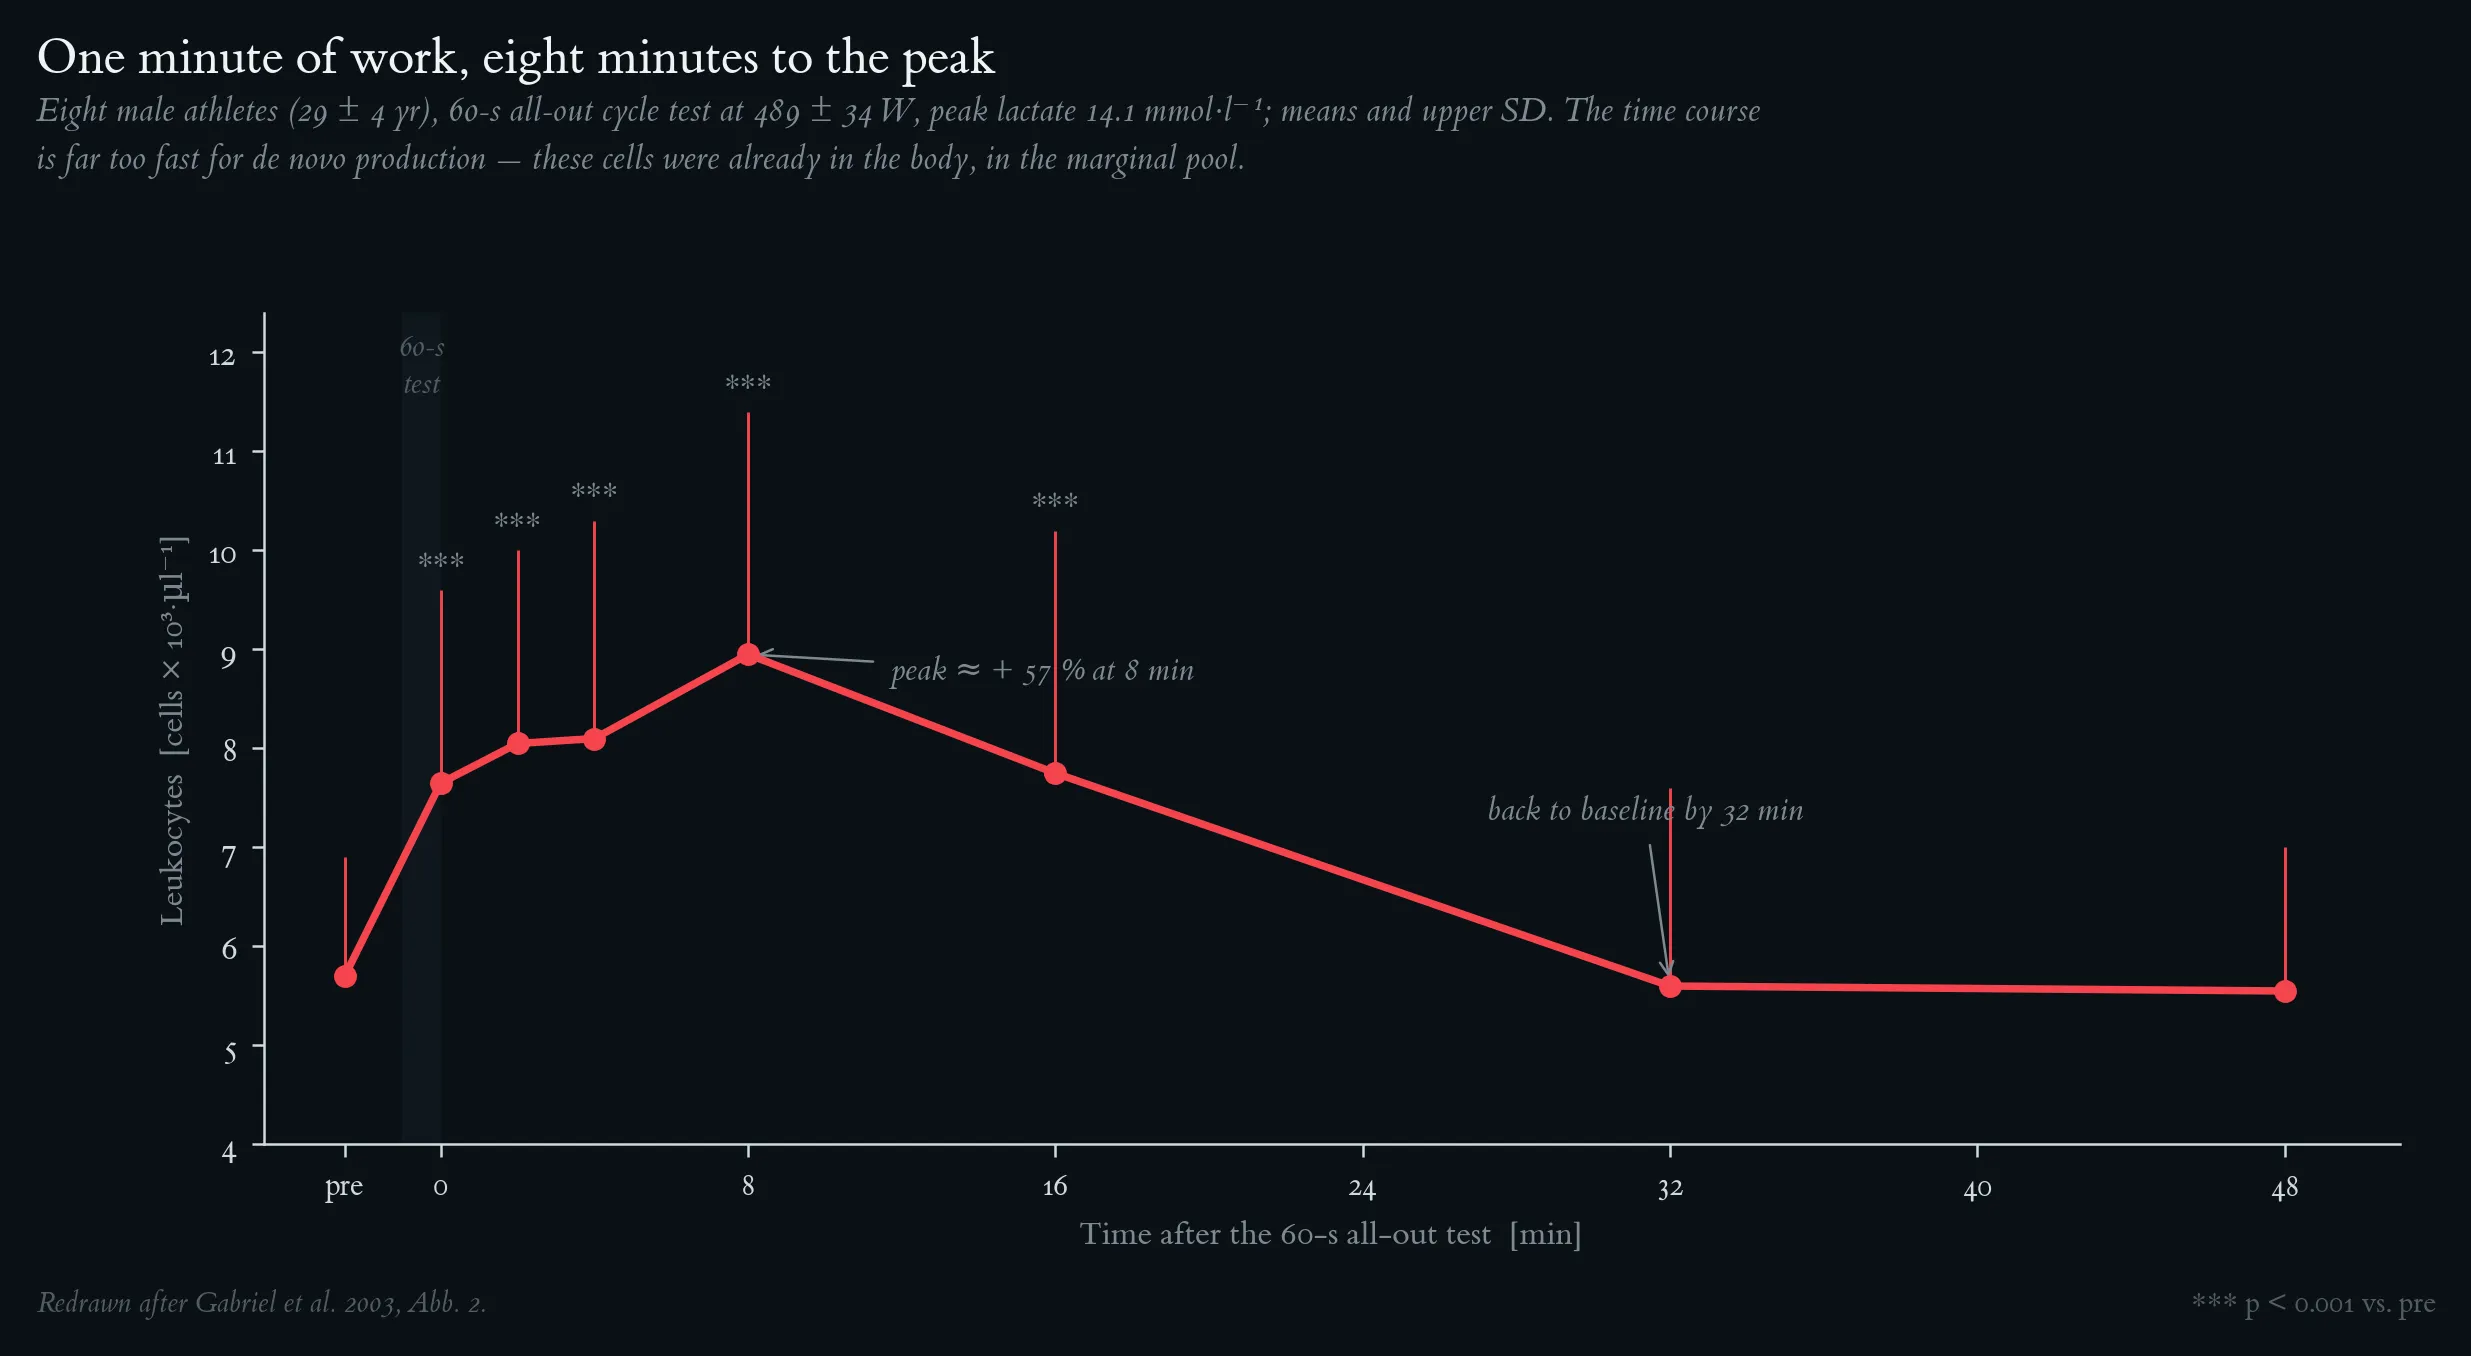
Absolute leukocyte concentration before and after a 60-s all-out cycle-ergometer test. Eight healthy male athletes (29 ± 4 yr, 74 ± 5 kg, 178 ± 7 cm) performed a single 60-s maximal test (489 ± 34 W; peak lactate 14.1 mmol·l⁻¹, reached in the 6th minute post-exercise). Blood was sampled before (pre), within the first minute after (0), and 2, 4, 8, 16, 32 and 48 min after the end of the test; the shaded band marks the test. Values are corrected for plasma-volume shifts. Means and SD (upper bar only); *** p < 0.001 vs. pre (analysis of variance, Newman-Keuls post-hoc test). Leukocytes peak at 8 min post (≈ +57 %) and have returned to baseline by 32 min — a time course far too fast for de novo production, and therefore indicative of reversible mobilisation from the marginal pool. Redrawn after Gabriel et al. 2003, Fig. 2.
The immediate leukocytosis resolved by subpopulation. (A) CD3⁻CD16⁺ NK cells, (B) CD3⁺CD4⁻ T cytotoxic/suppressor cells, (C) neutrophils, (D) CD3⁺CD4⁺ T helper/inducer cells and CD19⁺ B cells. Subjects, protocol, sampling scheme, plasma-volume correction and statistics as in Figure 2; dashed vertical lines mark the peak of each wave. Early wave (red): NK cells rise +411 % immediately after the test and peak at 2 min post (+521 %) — the largest increase of any subpopulation; T cytotoxic/suppressor cells belong to this wave but rise more slowly (+70 % already at 1 min, maximum +95 % at 8 min). Late wave (blue, green): neutrophils (+26 %), T helper/inducer cells (+43 %) and B cells (+70 %) peak at 8–16 min post. All populations have returned to pre-exercise values within 32 min. Redrawn after Gabriel et al. 2003, Fig. 3.
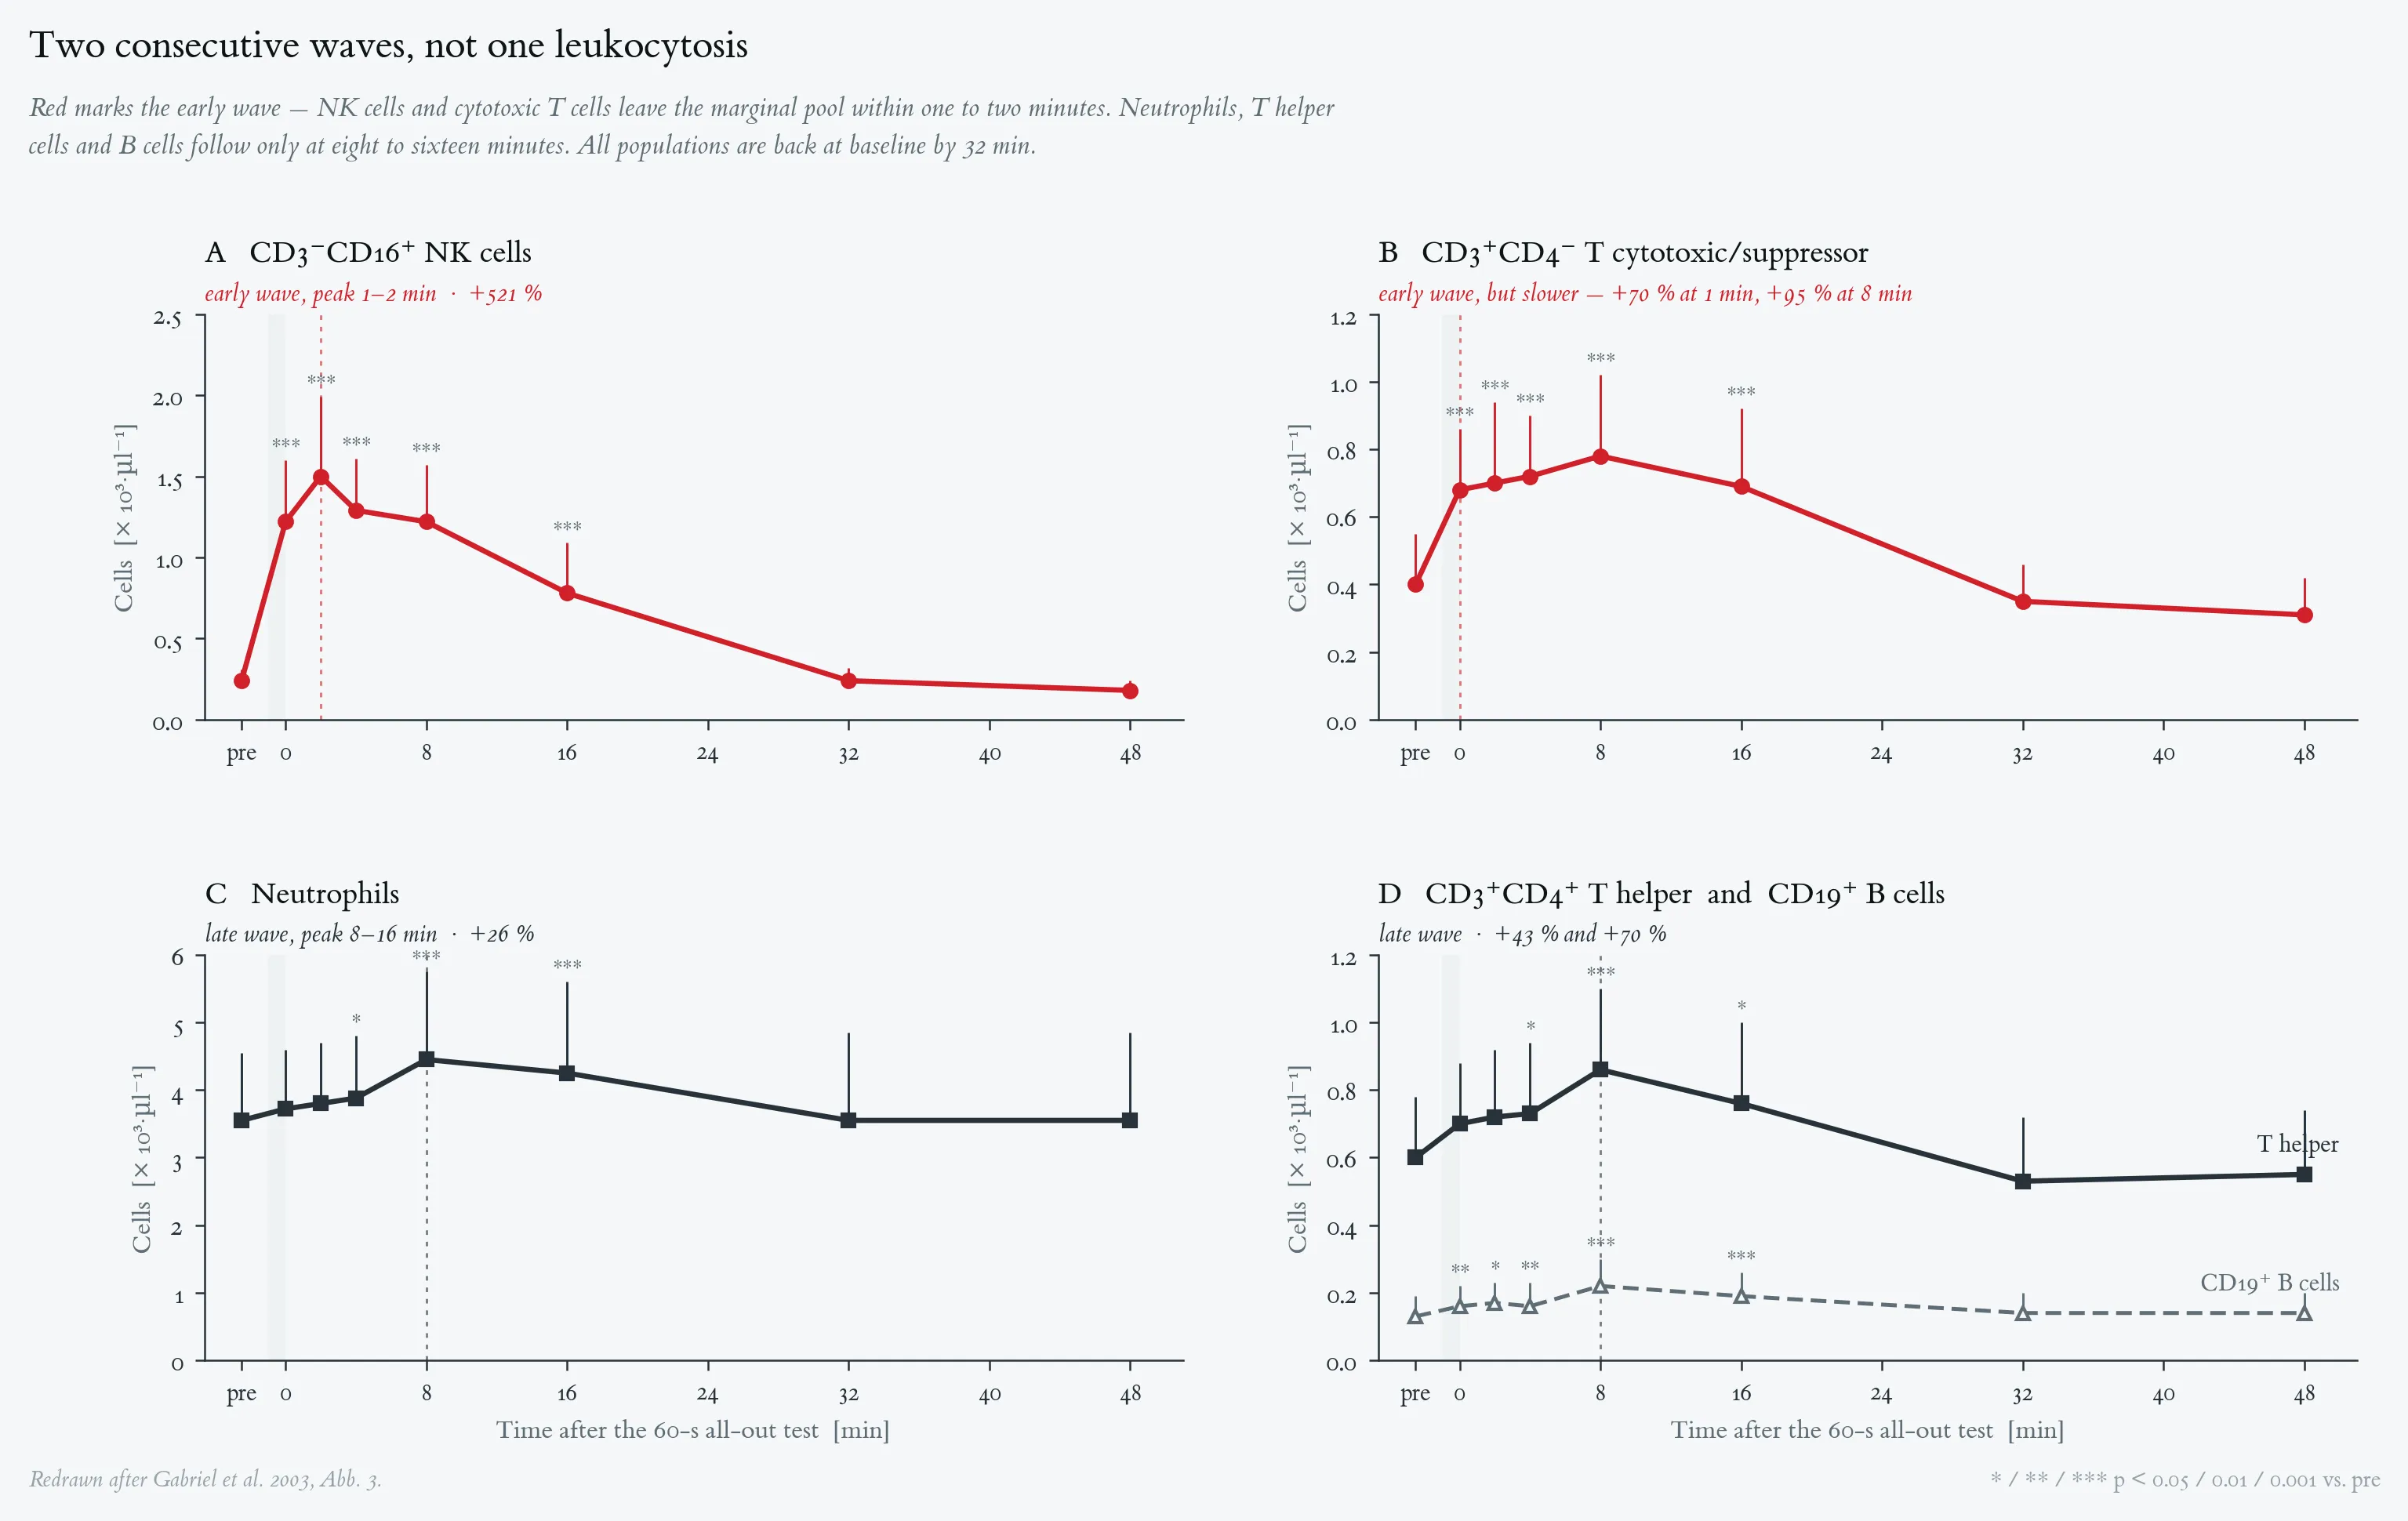
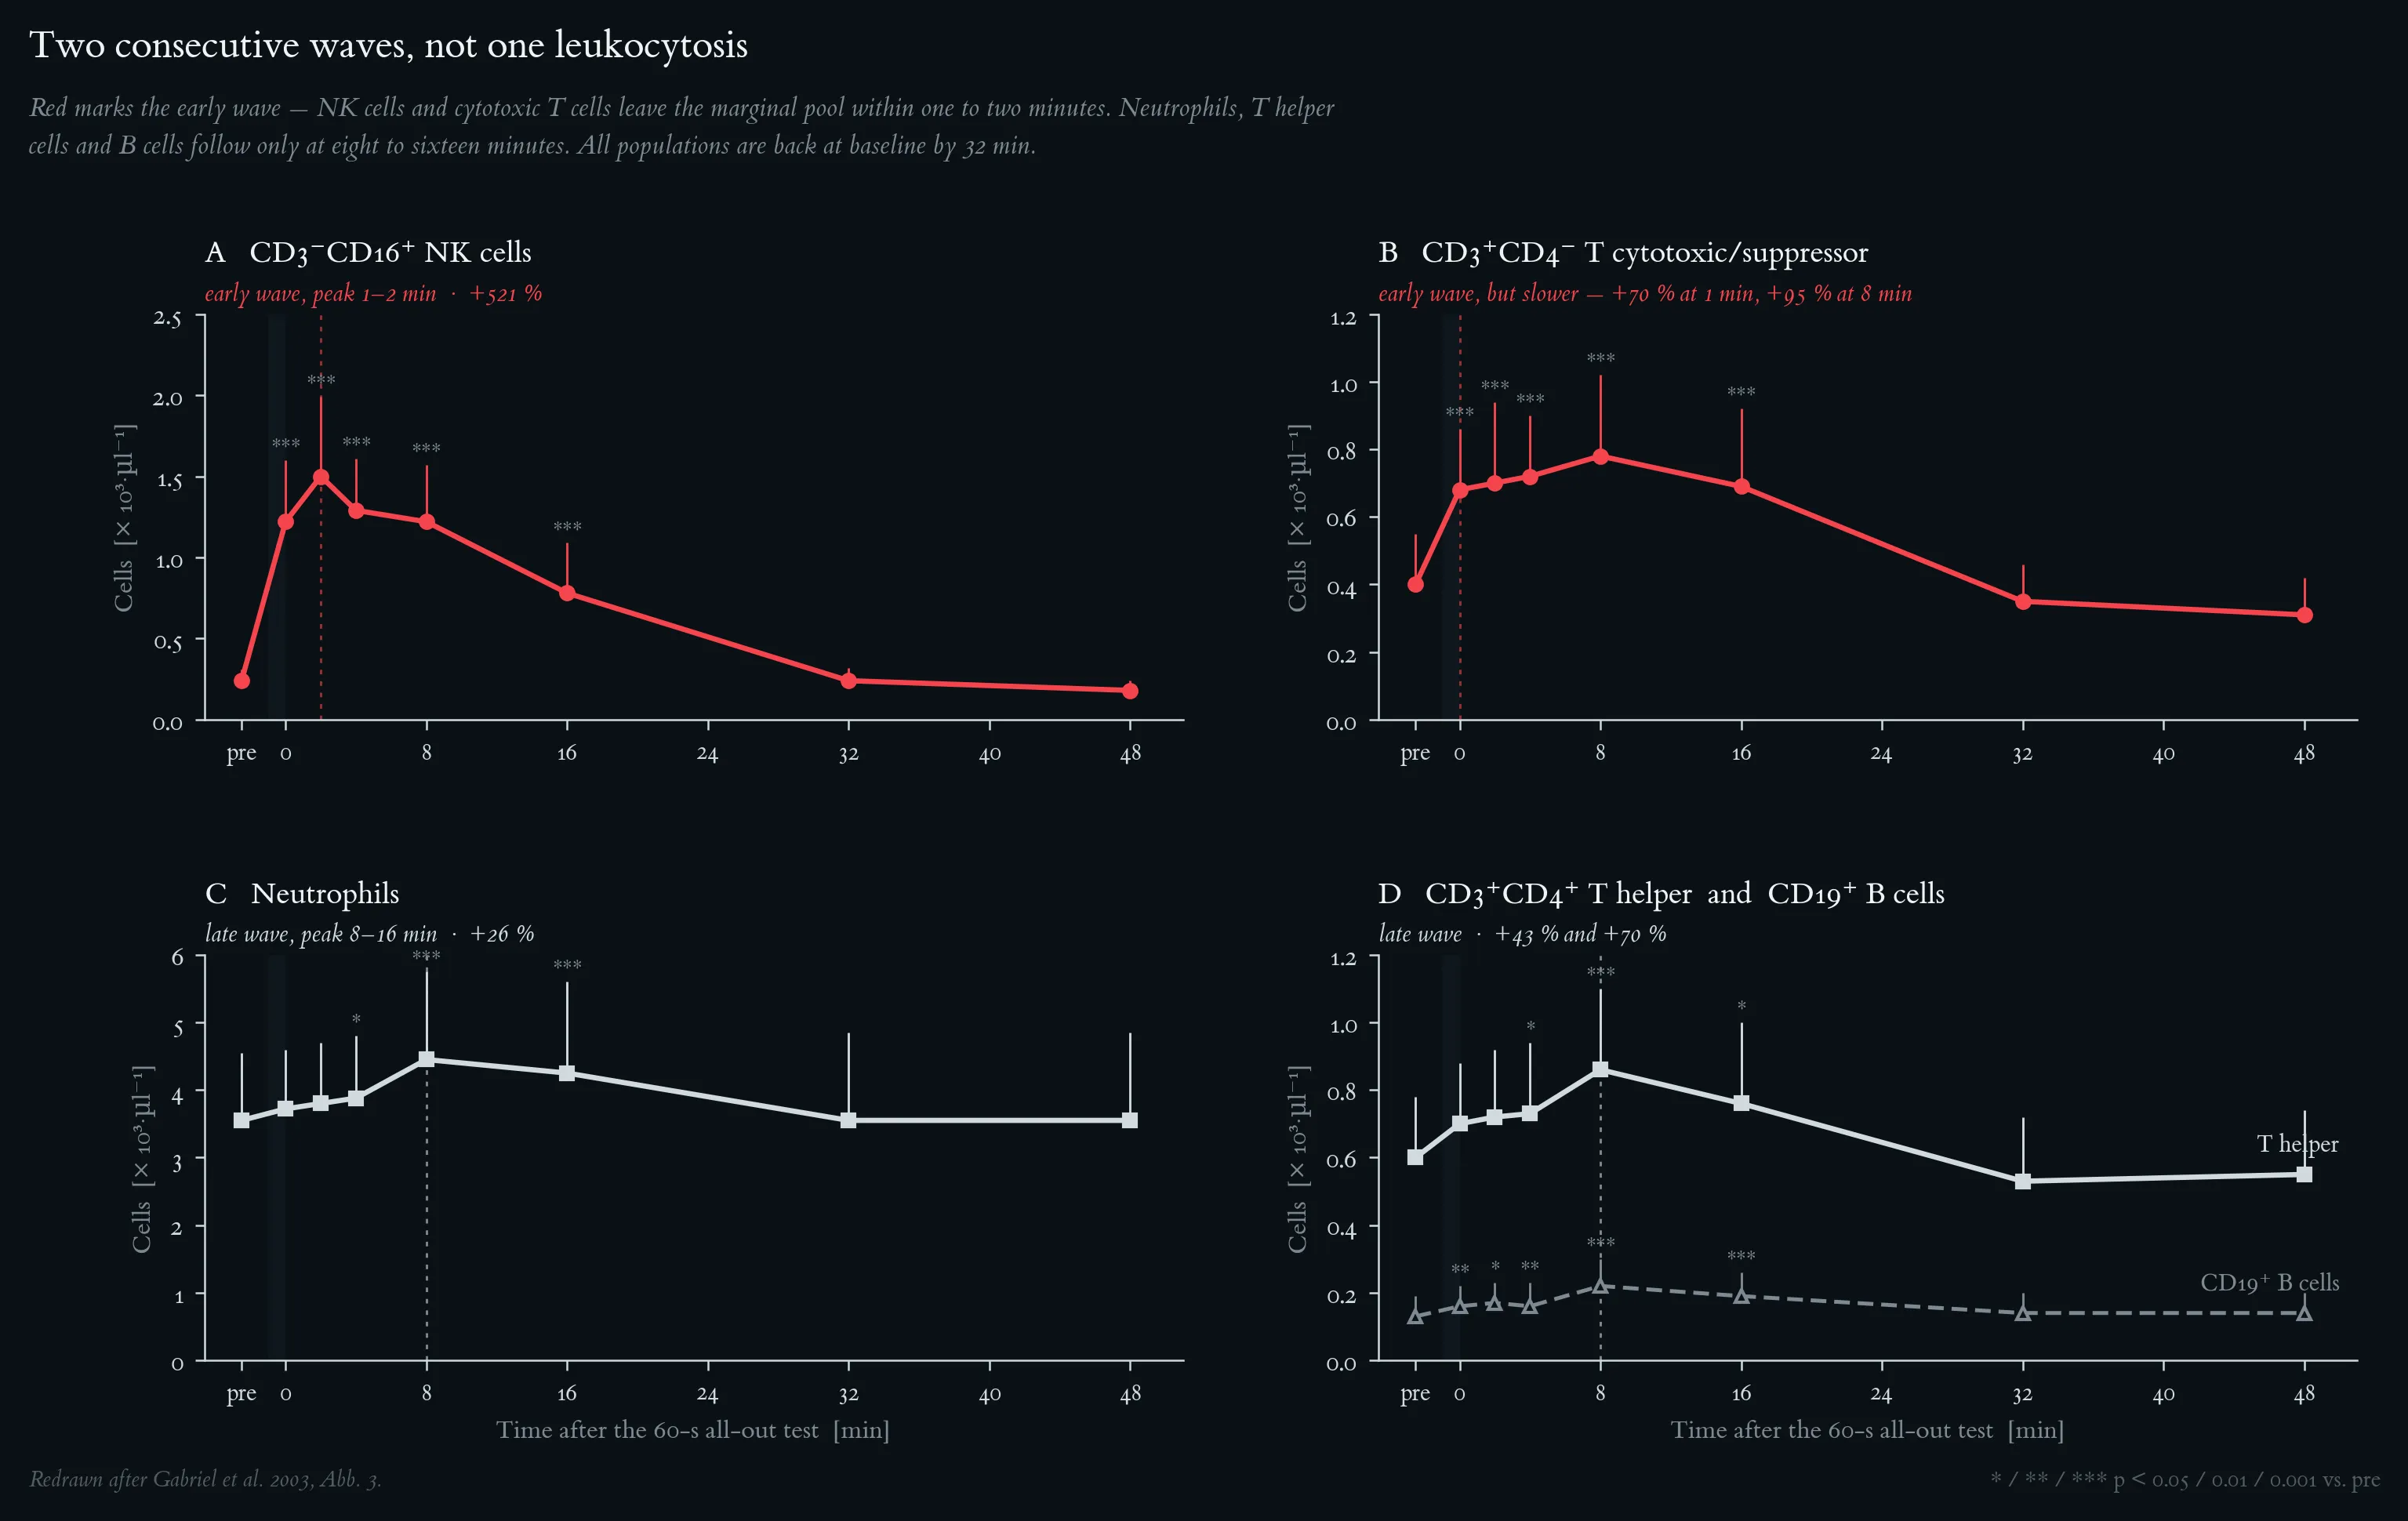
The immediate leukocytosis resolved by subpopulation. (A) CD3⁻CD16⁺ NK cells, (B) CD3⁺CD4⁻ T cytotoxic/suppressor cells, (C) neutrophils, (D) CD3⁺CD4⁺ T helper/inducer cells and CD19⁺ B cells. Subjects, protocol, sampling scheme, plasma-volume correction and statistics as in Figure 2; dashed vertical lines mark the peak of each wave. Early wave (red): NK cells rise +411 % immediately after the test and peak at 2 min post (+521 %) — the largest increase of any subpopulation; T cytotoxic/suppressor cells belong to this wave but rise more slowly (+70 % already at 1 min, maximum +95 % at 8 min). Late wave (blue, green): neutrophils (+26 %), T helper/inducer cells (+43 %) and B cells (+70 %) peak at 8–16 min post. All populations have returned to pre-exercise values within 32 min. Redrawn after Gabriel et al. 2003, Fig. 3.
Divergent mobilisation of the two monocyte subpopulations after a 60-s all-out test. Filled symbols: CD14⁺CD16⁻ regular monocytes; open symbols: CD14⁺CD16⁺ mature monocytes (premacrophages). Subjects, protocol, sampling and statistics as in Figure 2; error bars are drawn in one direction per series for legibility. Regular monocytes rise modestly (+33 %) immediately after the test and are back at baseline by 4 min. Premacrophages rise later and disproportionately, peaking at 8 min post at roughly 4.7 times the resting value (+372 %); at that point they make up ≈ 50 % of all circulating monocytes, against 10–15 % at rest. The premacrophage therefore resides preferentially in the marginal pool, which can be read as a standing reserve of activated cells poised to migrate into tissue. Redrawn after Gabriel et al. 2003, Fig. 4.
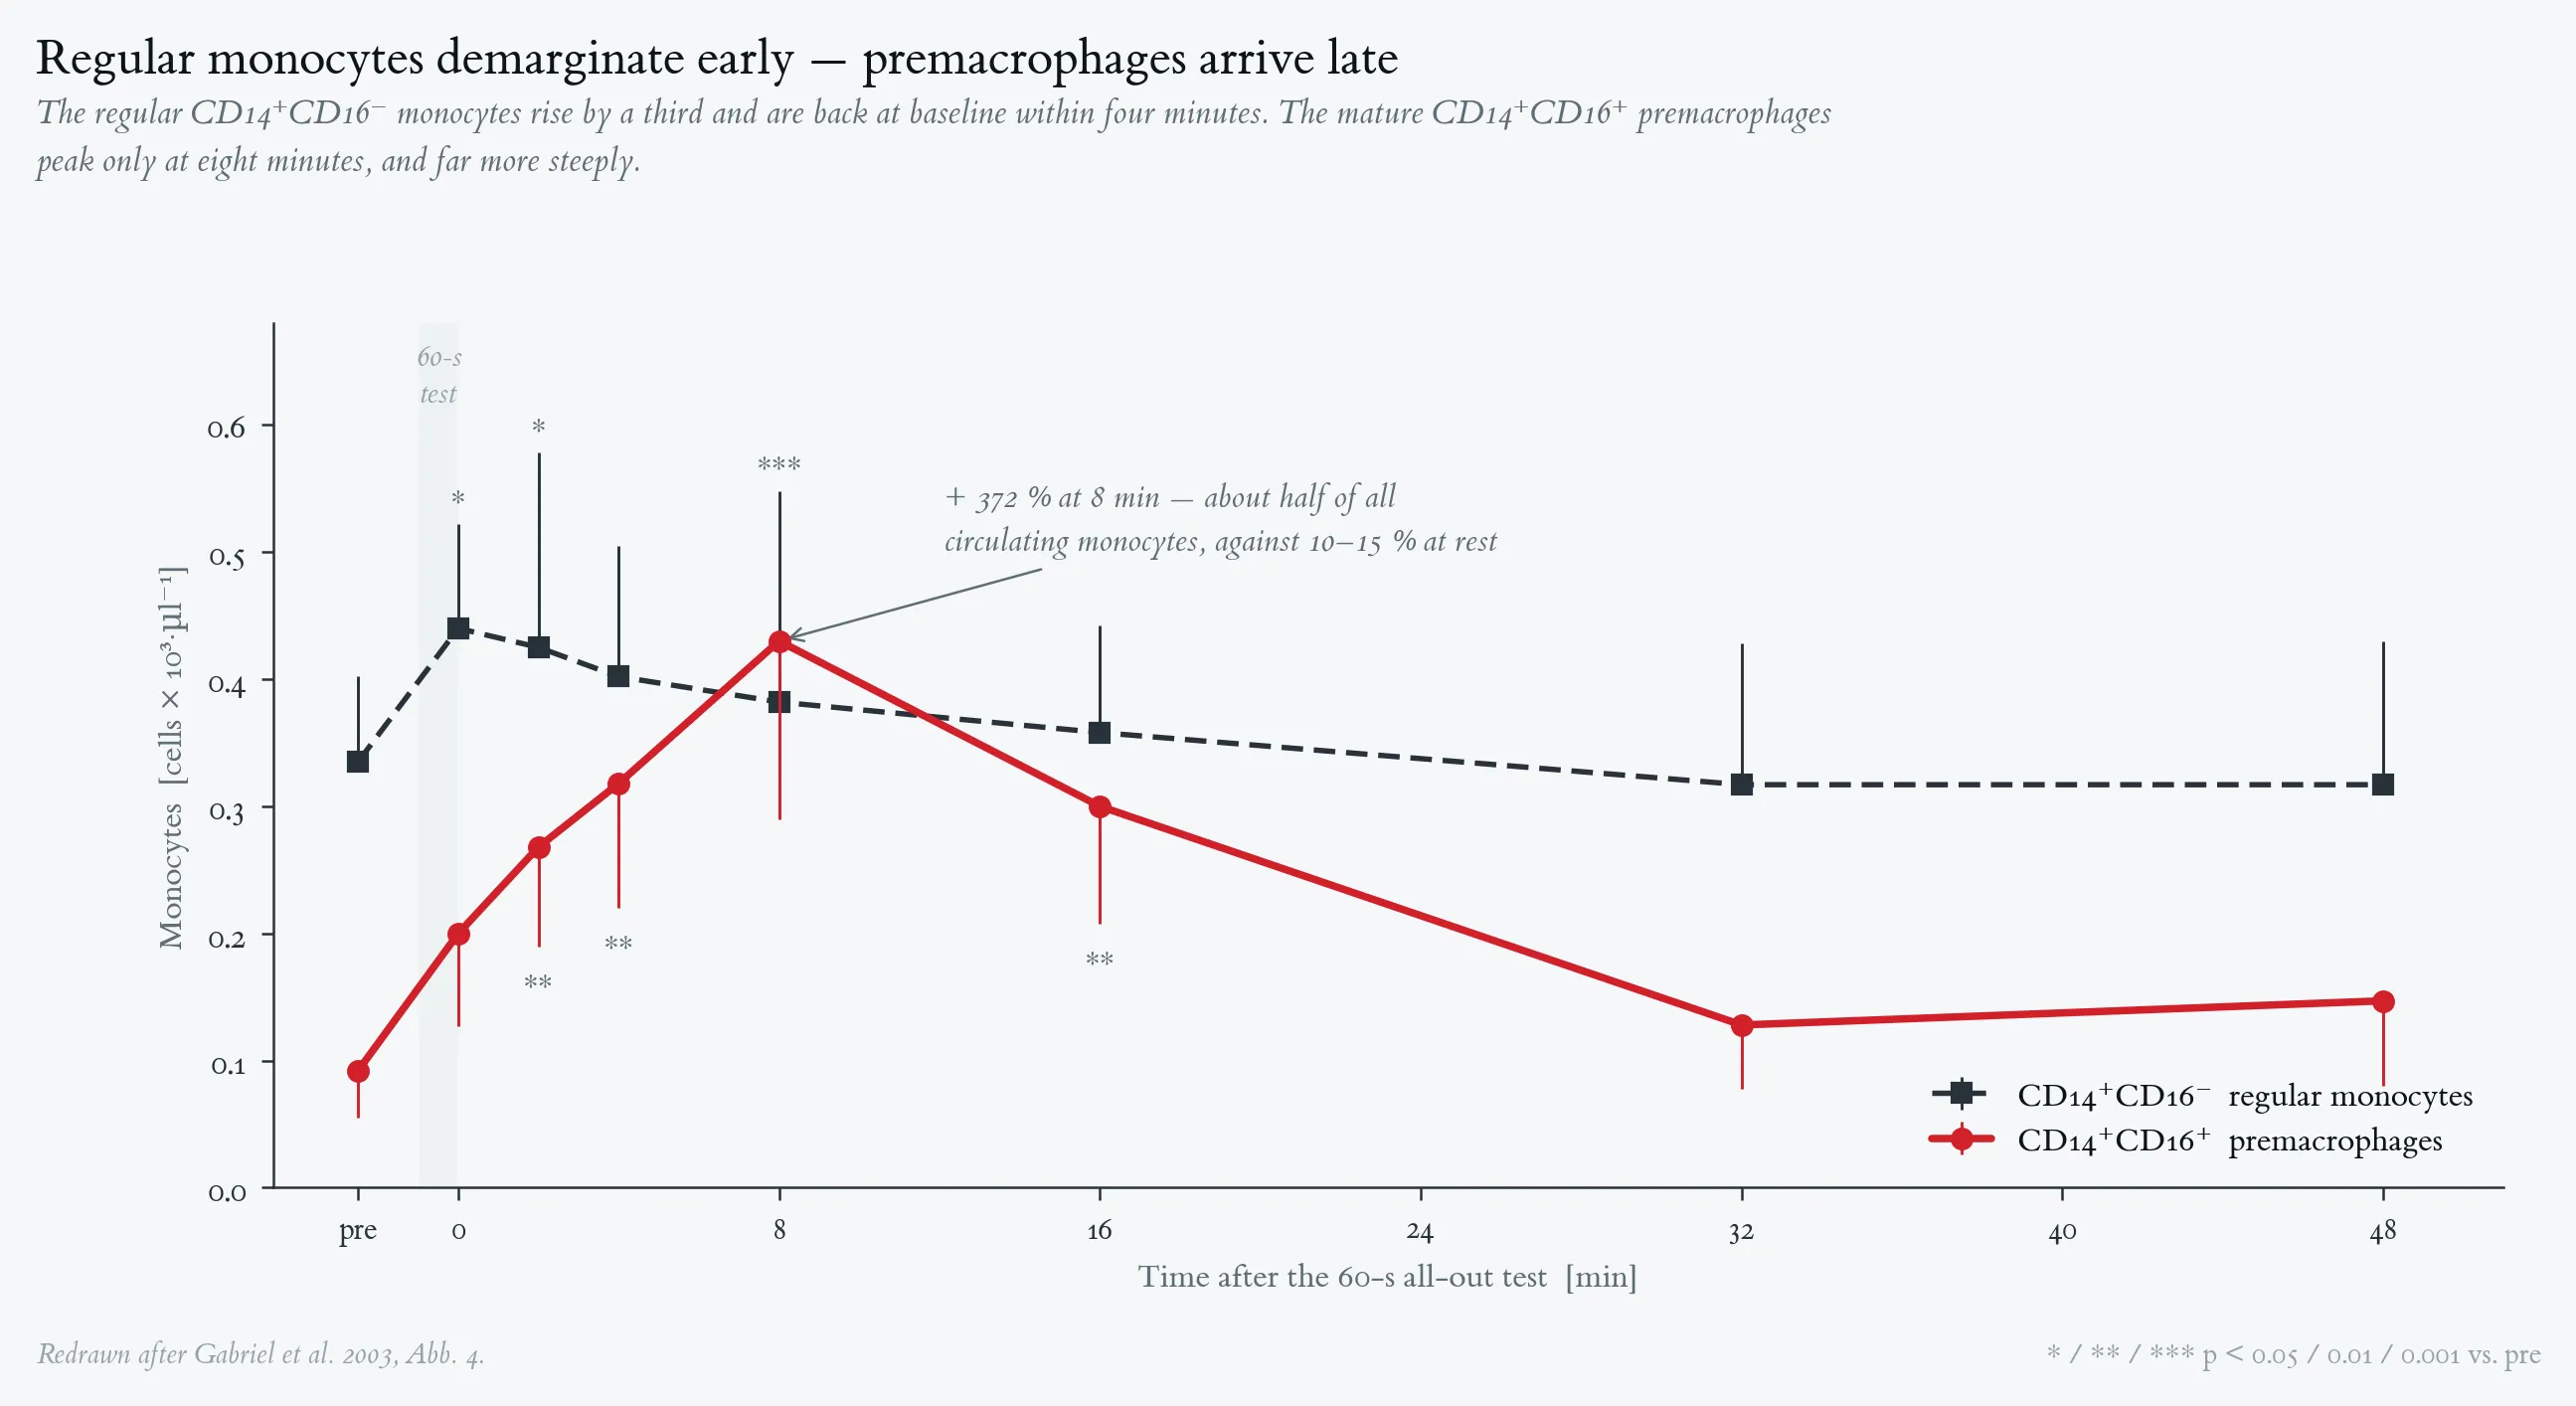
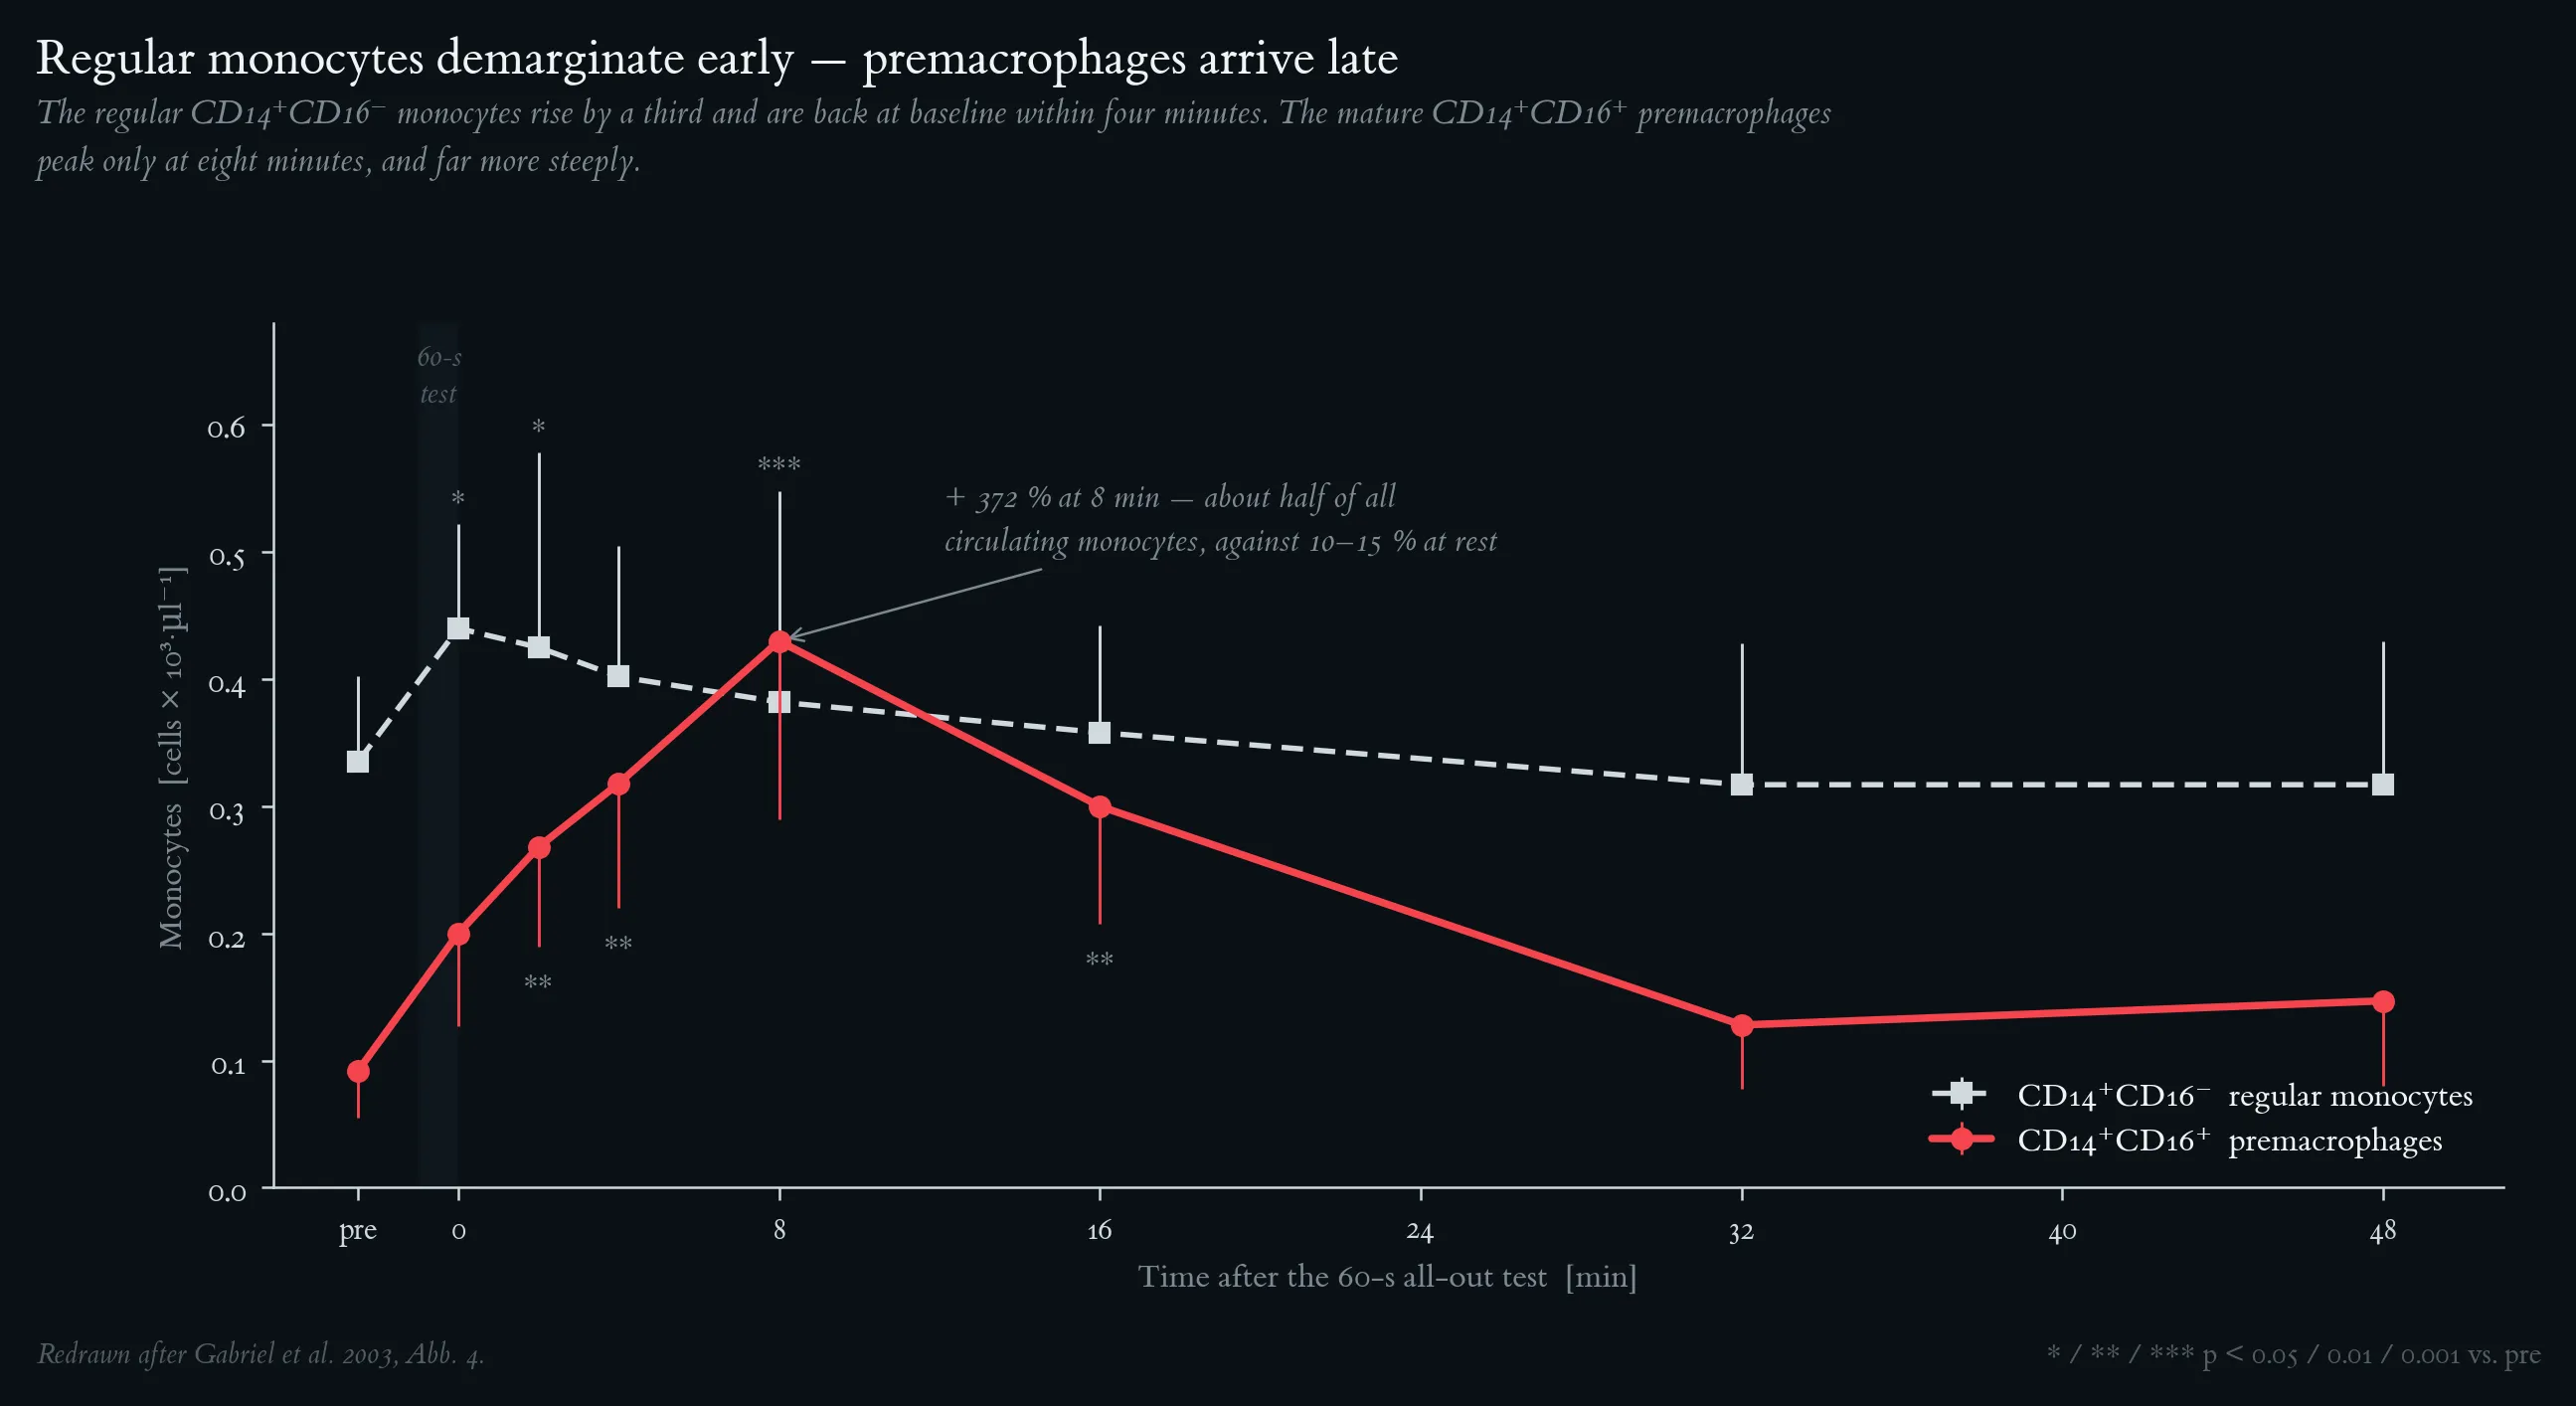
Divergent mobilisation of the two monocyte subpopulations after a 60-s all-out test. Filled symbols: CD14⁺CD16⁻ regular monocytes; open symbols: CD14⁺CD16⁺ mature monocytes (premacrophages). Subjects, protocol, sampling and statistics as in Figure 2; error bars are drawn in one direction per series for legibility. Regular monocytes rise modestly (+33 %) immediately after the test and are back at baseline by 4 min. Premacrophages rise later and disproportionately, peaking at 8 min post at roughly 4.7 times the resting value (+372 %); at that point they make up ≈ 50 % of all circulating monocytes, against 10–15 % at rest. The premacrophage therefore resides preferentially in the marginal pool, which can be read as a standing reserve of activated cells poised to migrate into tissue. Redrawn after Gabriel et al. 2003, Fig. 4.
Schematic of cell-surface receptor expression along the monocyte–macrophage maturation axis. Cells mature from the promonocyte (bone marrow) through the regular monocyte (CD14⁺CD16⁻) and the premacrophage (CD14⁺CD16⁺) in blood to the tissue macrophage. LPS-R (CD14), FcγR1 (CD64) and CR3 (CD11b) are progressively downregulated; LFA-1 (CD11a/CD18), LCA (CD45), HLA-DR and FcγR3 (CD16) are progressively upregulated; wedge width indicates relative expression. Dashed circles mark the compartments not accessible to peripheral-blood sampling. The high LFA-1 density of the premacrophage accounts both for its residence in the marginal pool and for its rapid re-adhesion during recovery, and CD16 (FcγR3) is the marker that defines it. Redrawn after Gabriel & Kindermann 1997, Fig. 11.
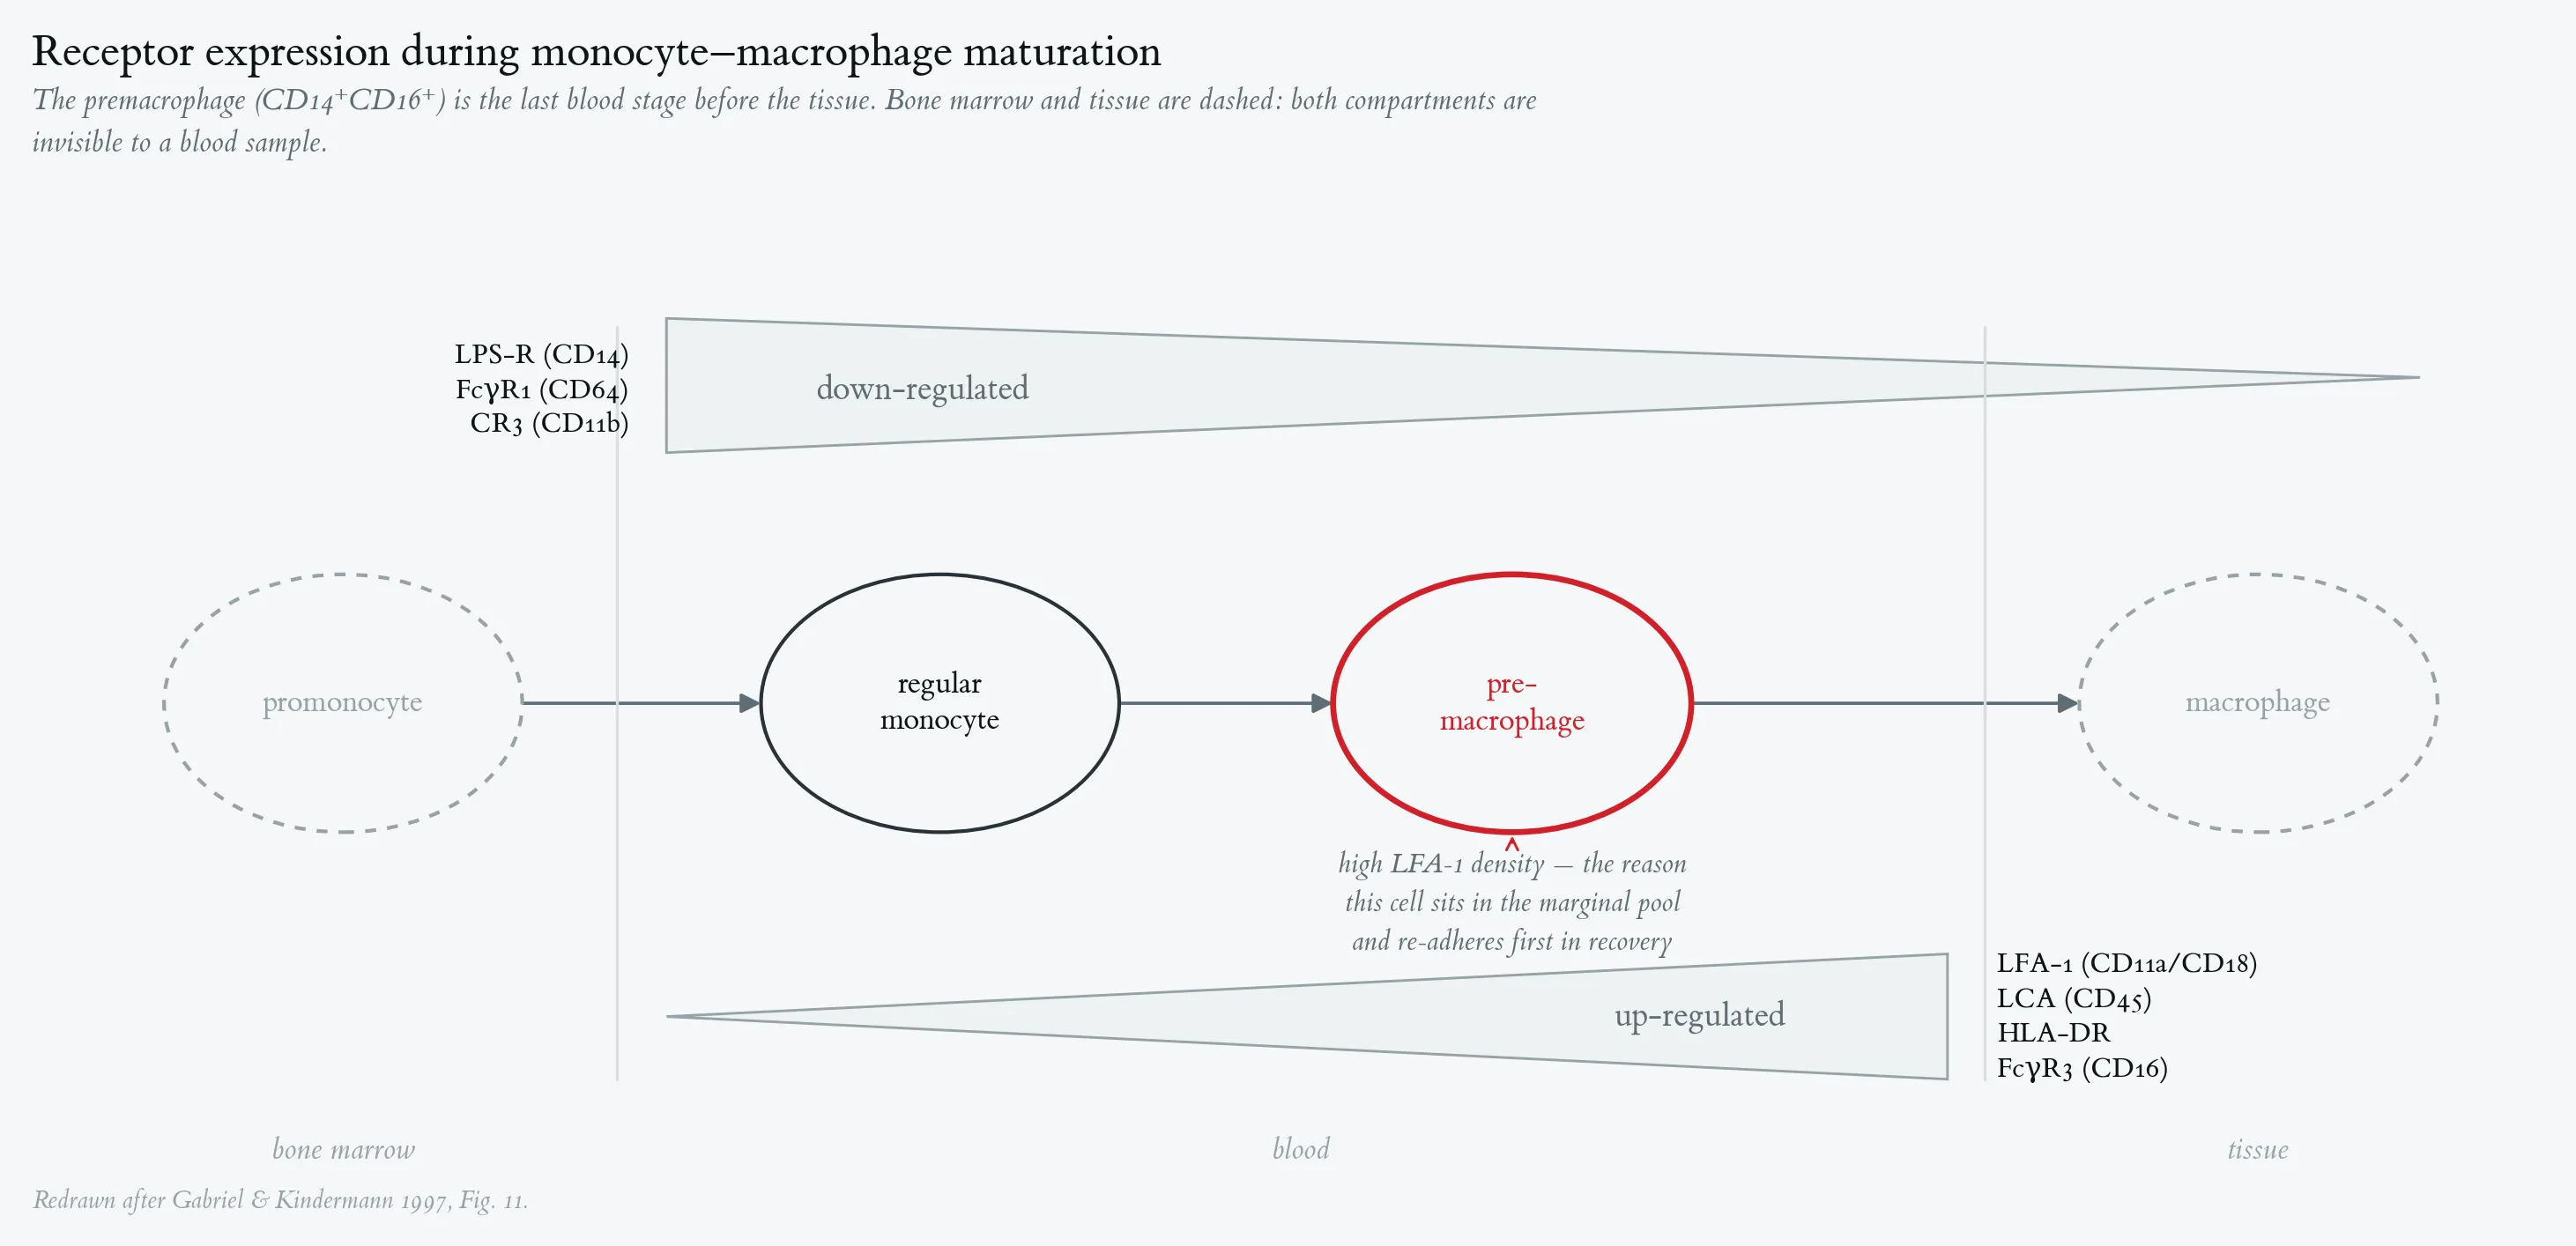
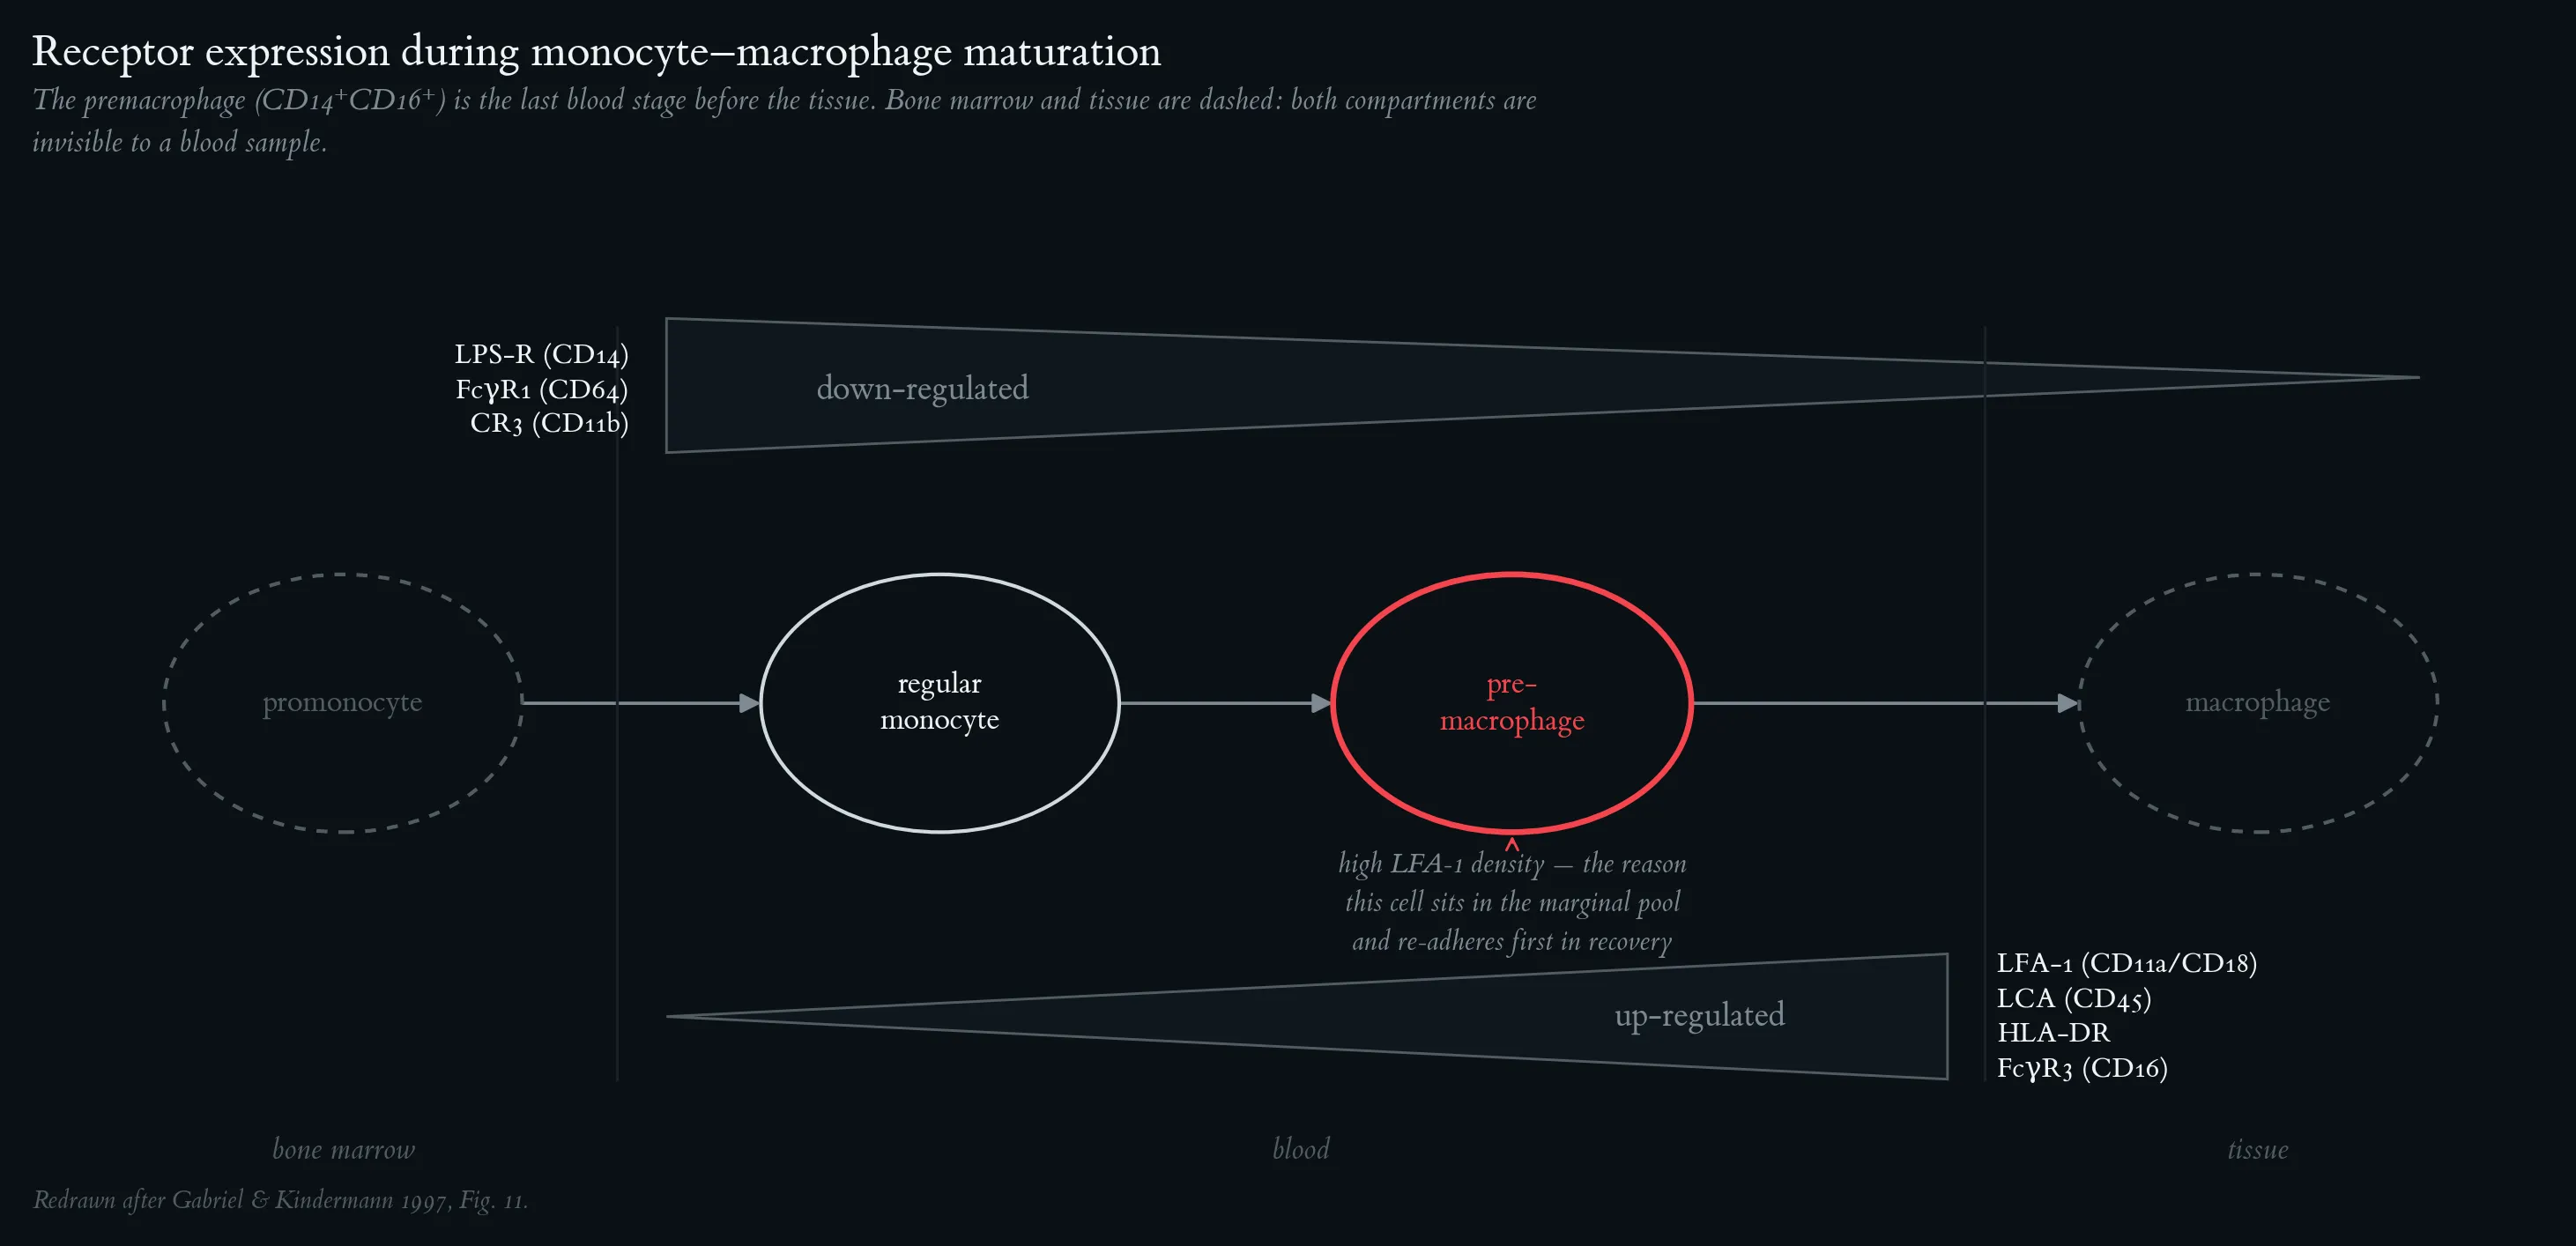
Schematic of cell-surface receptor expression along the monocyte–macrophage maturation axis. Cells mature from the promonocyte (bone marrow) through the regular monocyte (CD14⁺CD16⁻) and the premacrophage (CD14⁺CD16⁺) in blood to the tissue macrophage. LPS-R (CD14), FcγR1 (CD64) and CR3 (CD11b) are progressively downregulated; LFA-1 (CD11a/CD18), LCA (CD45), HLA-DR and FcγR3 (CD16) are progressively upregulated; wedge width indicates relative expression. Dashed circles mark the compartments not accessible to peripheral-blood sampling. The high LFA-1 density of the premacrophage accounts both for its residence in the marginal pool and for its rapid re-adhesion during recovery, and CD16 (FcγR3) is the marker that defines it. Redrawn after Gabriel & Kindermann 1997, Fig. 11.
Neutrophil count, oxidative burst and phagocytotic activity after exercise and during bacterial infection. (A) neutrophil cell counts; (B) fMLP-stimulated (0.1 µM) oxidative burst, measured as the percentage of rhodamine-123-positive neutrophils; (C) phagocytotic activity, measured as intracellular FITC-conjugated E. coli fluorescence. Open bars: 8 athletes cycling 60 min at 100 % of the individual anaerobic threshold, sampled before, 2 h and 1 day post-exercise. Filled bars: 8 patients (18–32 yr) with bacterial upper-respiratory-tract infection — sinusitis, angina tonsillaris, tonsillitis — sampled before and 2 and 10 days after symptom onset. Means and SD; † p < 0.01 vs. the corresponding value before exercise or before infection (two-tailed t-test for dependent variables). Exercise and infection produce comparable neutrocytosis (A) but opposite functional profiles: burst is unchanged or reduced after exercise and strongly primed in infection (B), and phagocytosis is unchanged after exercise but grossly increased in infection (C). Redrawn after Gabriel & Kindermann 1997, Fig. 10.
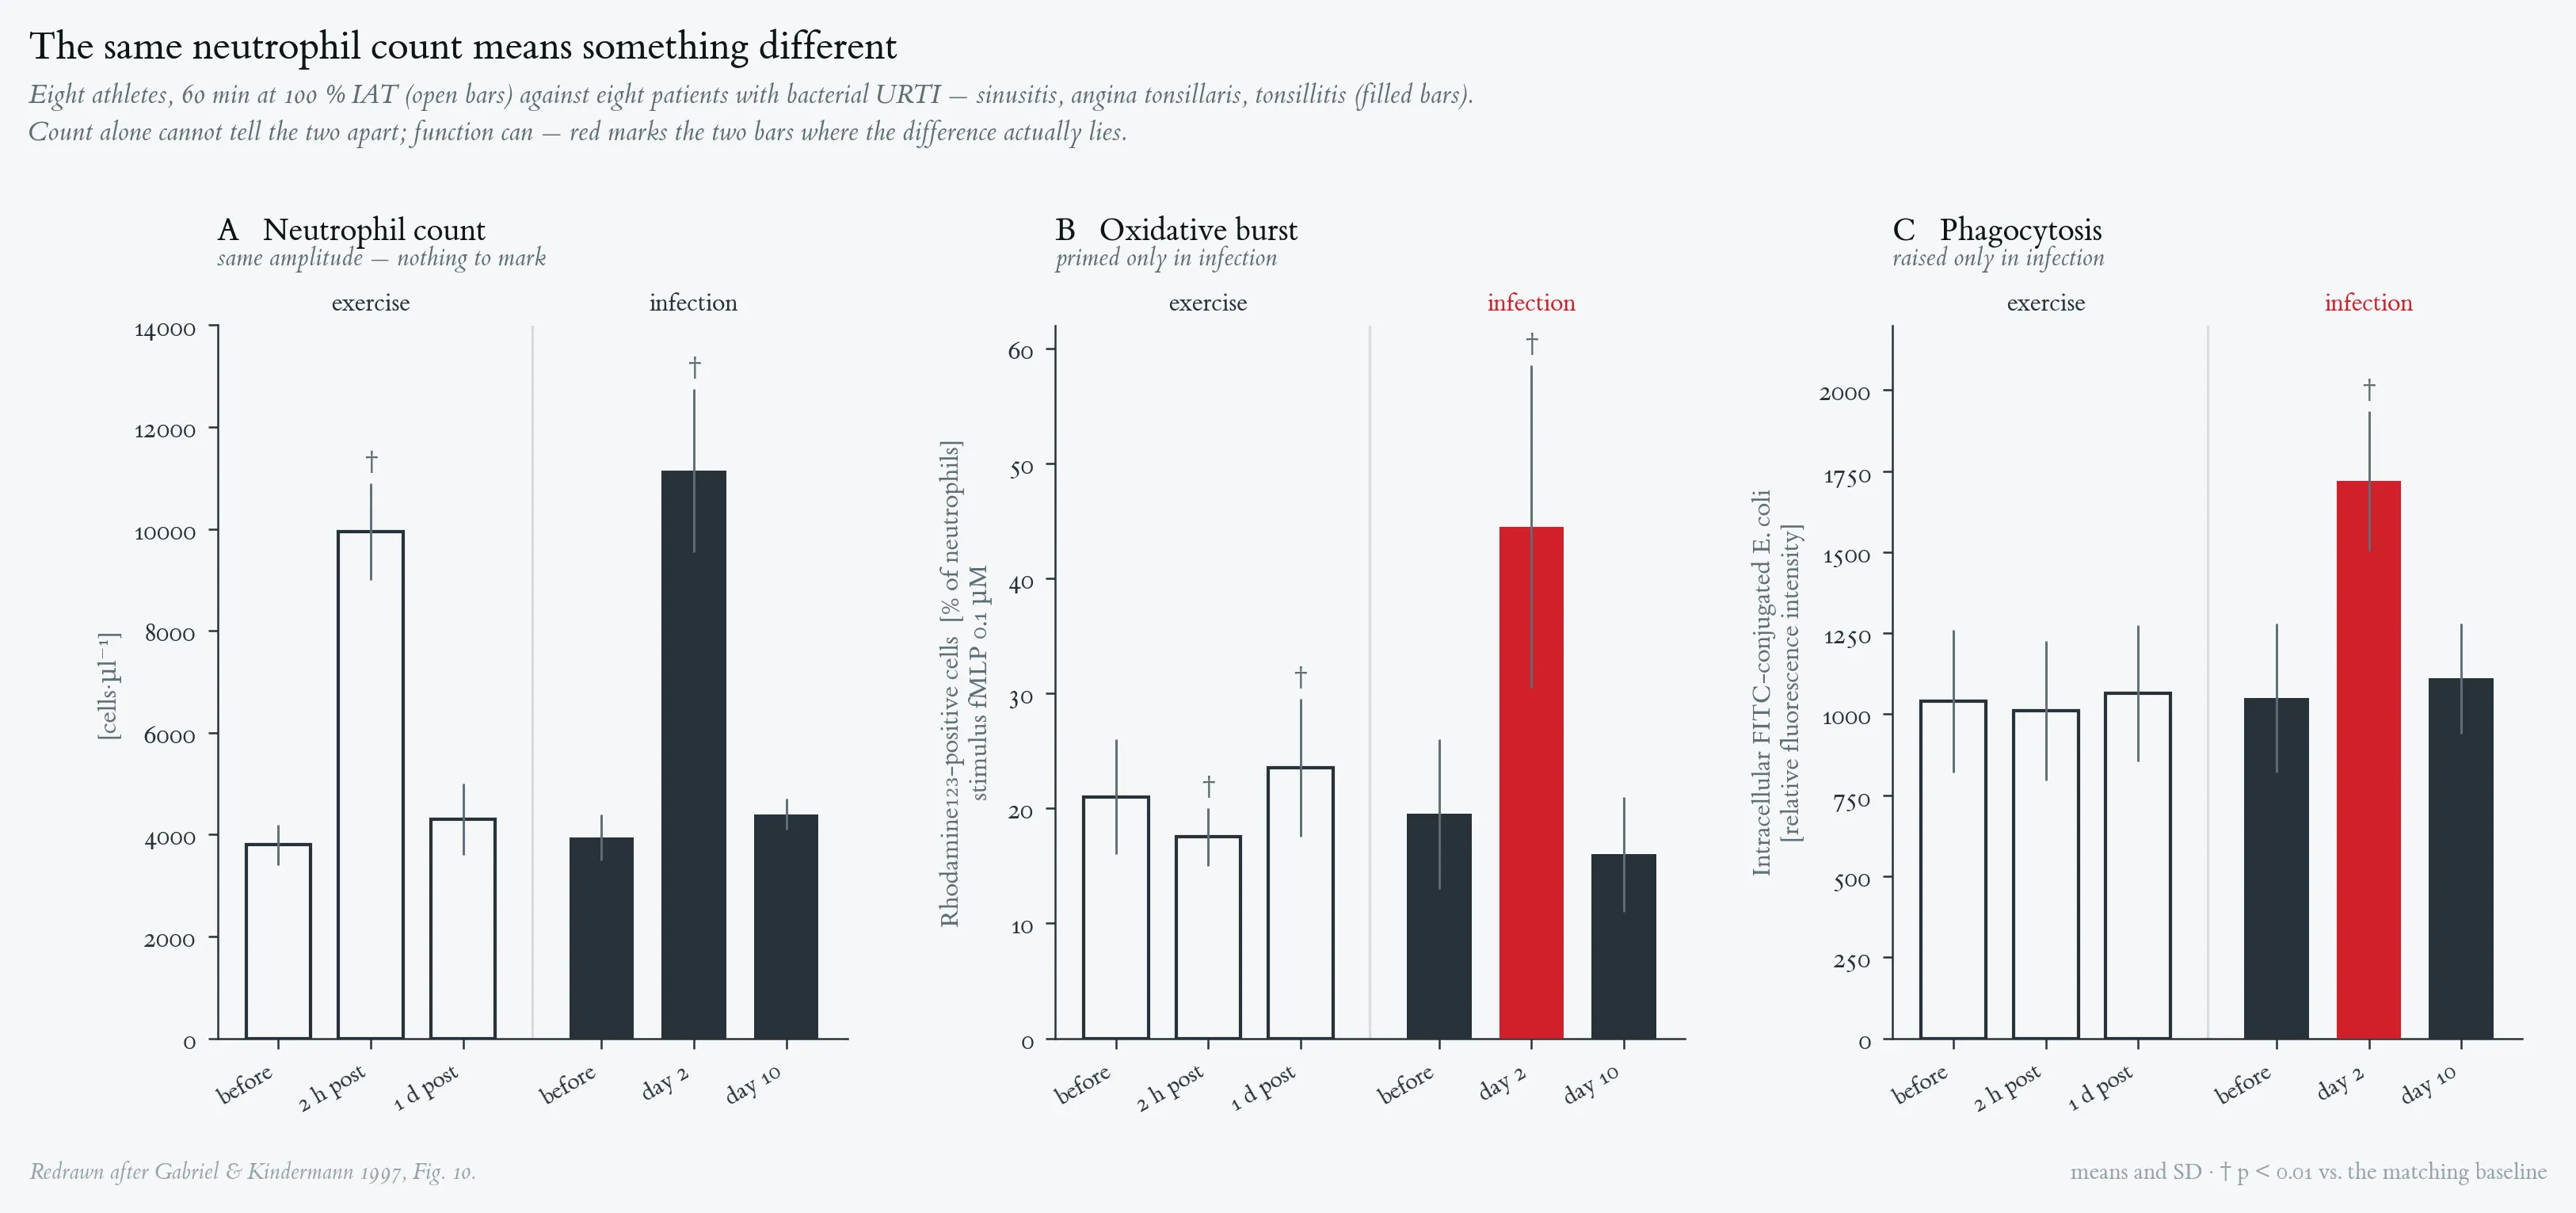
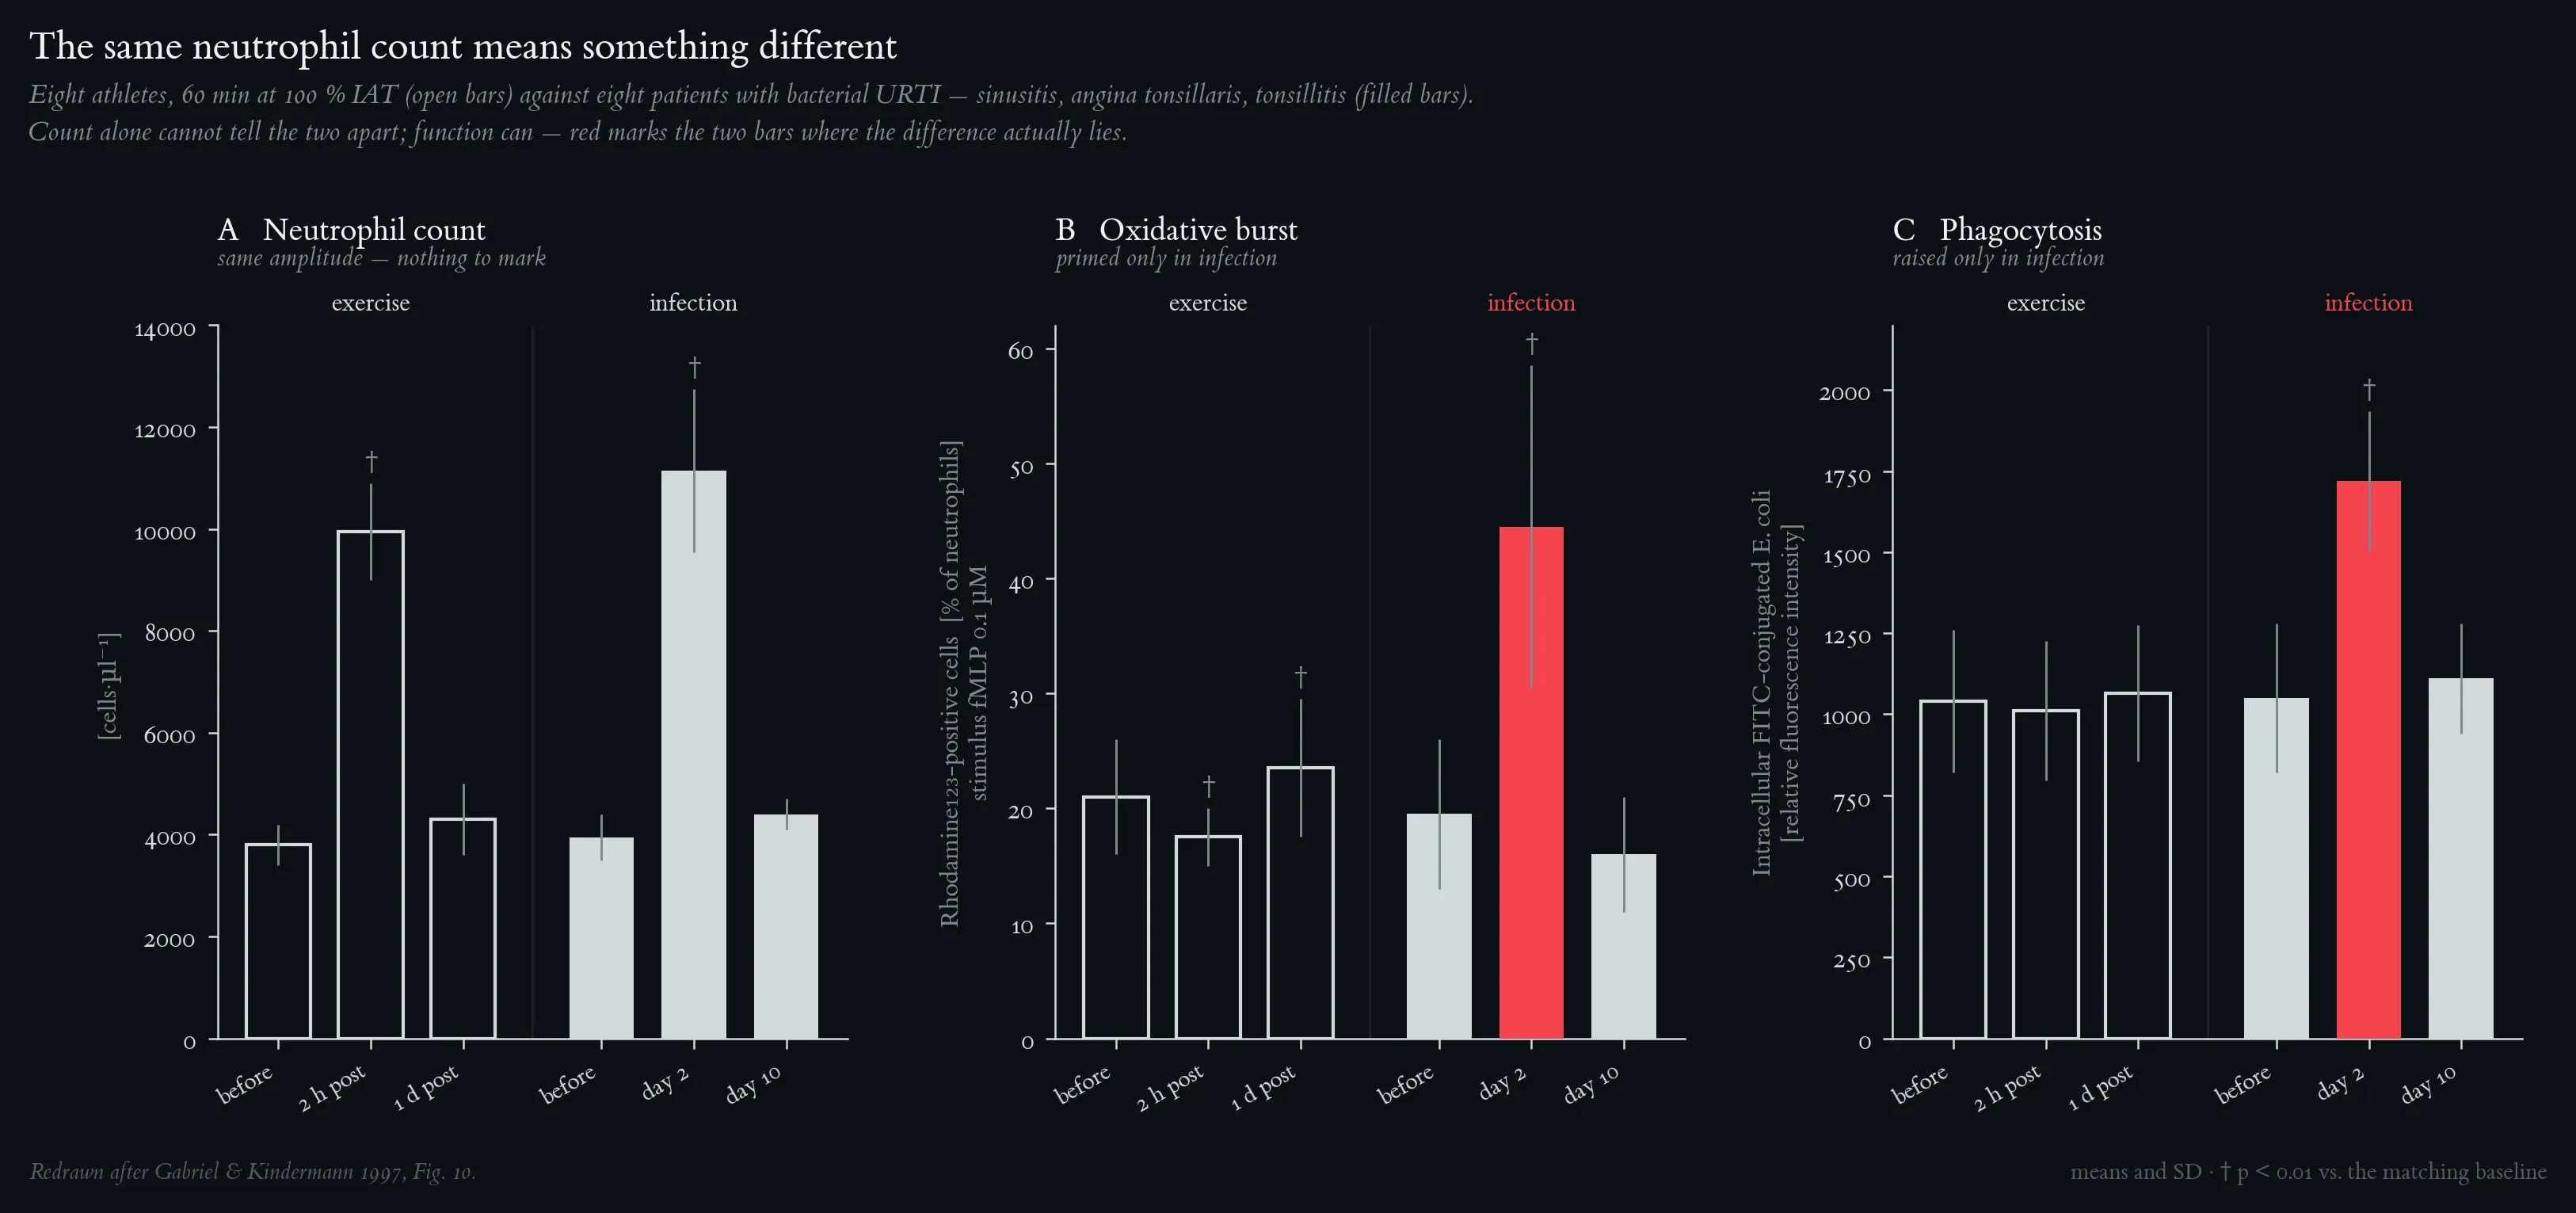
Neutrophil count, oxidative burst and phagocytotic activity after exercise and during bacterial infection. (A) neutrophil cell counts; (B) fMLP-stimulated (0.1 µM) oxidative burst, measured as the percentage of rhodamine-123-positive neutrophils; (C) phagocytotic activity, measured as intracellular FITC-conjugated E. coli fluorescence. Open bars: 8 athletes cycling 60 min at 100 % of the individual anaerobic threshold, sampled before, 2 h and 1 day post-exercise. Filled bars: 8 patients (18–32 yr) with bacterial upper-respiratory-tract infection — sinusitis, angina tonsillaris, tonsillitis — sampled before and 2 and 10 days after symptom onset. Means and SD; † p < 0.01 vs. the corresponding value before exercise or before infection (two-tailed t-test for dependent variables). Exercise and infection produce comparable neutrocytosis (A) but opposite functional profiles: burst is unchanged or reduced after exercise and strongly primed in infection (B), and phagocytosis is unchanged after exercise but grossly increased in infection (C). Redrawn after Gabriel & Kindermann 1997, Fig. 10.
NK-cell counts (CD3⁻CD16/CD56⁺) before, during and after a standardised stress test, in normal status versus overtraining. Fifteen endurance athletes (12 cyclists, 3 triathletes; V̇O₂max 61.2 ± 7.5 mL·min⁻¹·kg⁻¹) were examined approximately every 3–5 months over 19 ± 3 months, yielding 85 examinations: 70 in normal status (NS, open bars) and 15 with a diagnosed overtraining syndrome (OT, filled bars). Blood was drawn before, at the 10th minute of, at the end of, and 60 min after a stress test at 110 % of the maximum lactate steady state. Means and SD; ++ p < 0.01 vs. before exercise within group; no between-group difference reached significance at any time point (significance level 2.5 %). Both the amplitude and the shape of NK-cell mobilisation are fully preserved during overtraining. Redrawn after Gabriel et al. 1998, Fig. 3.
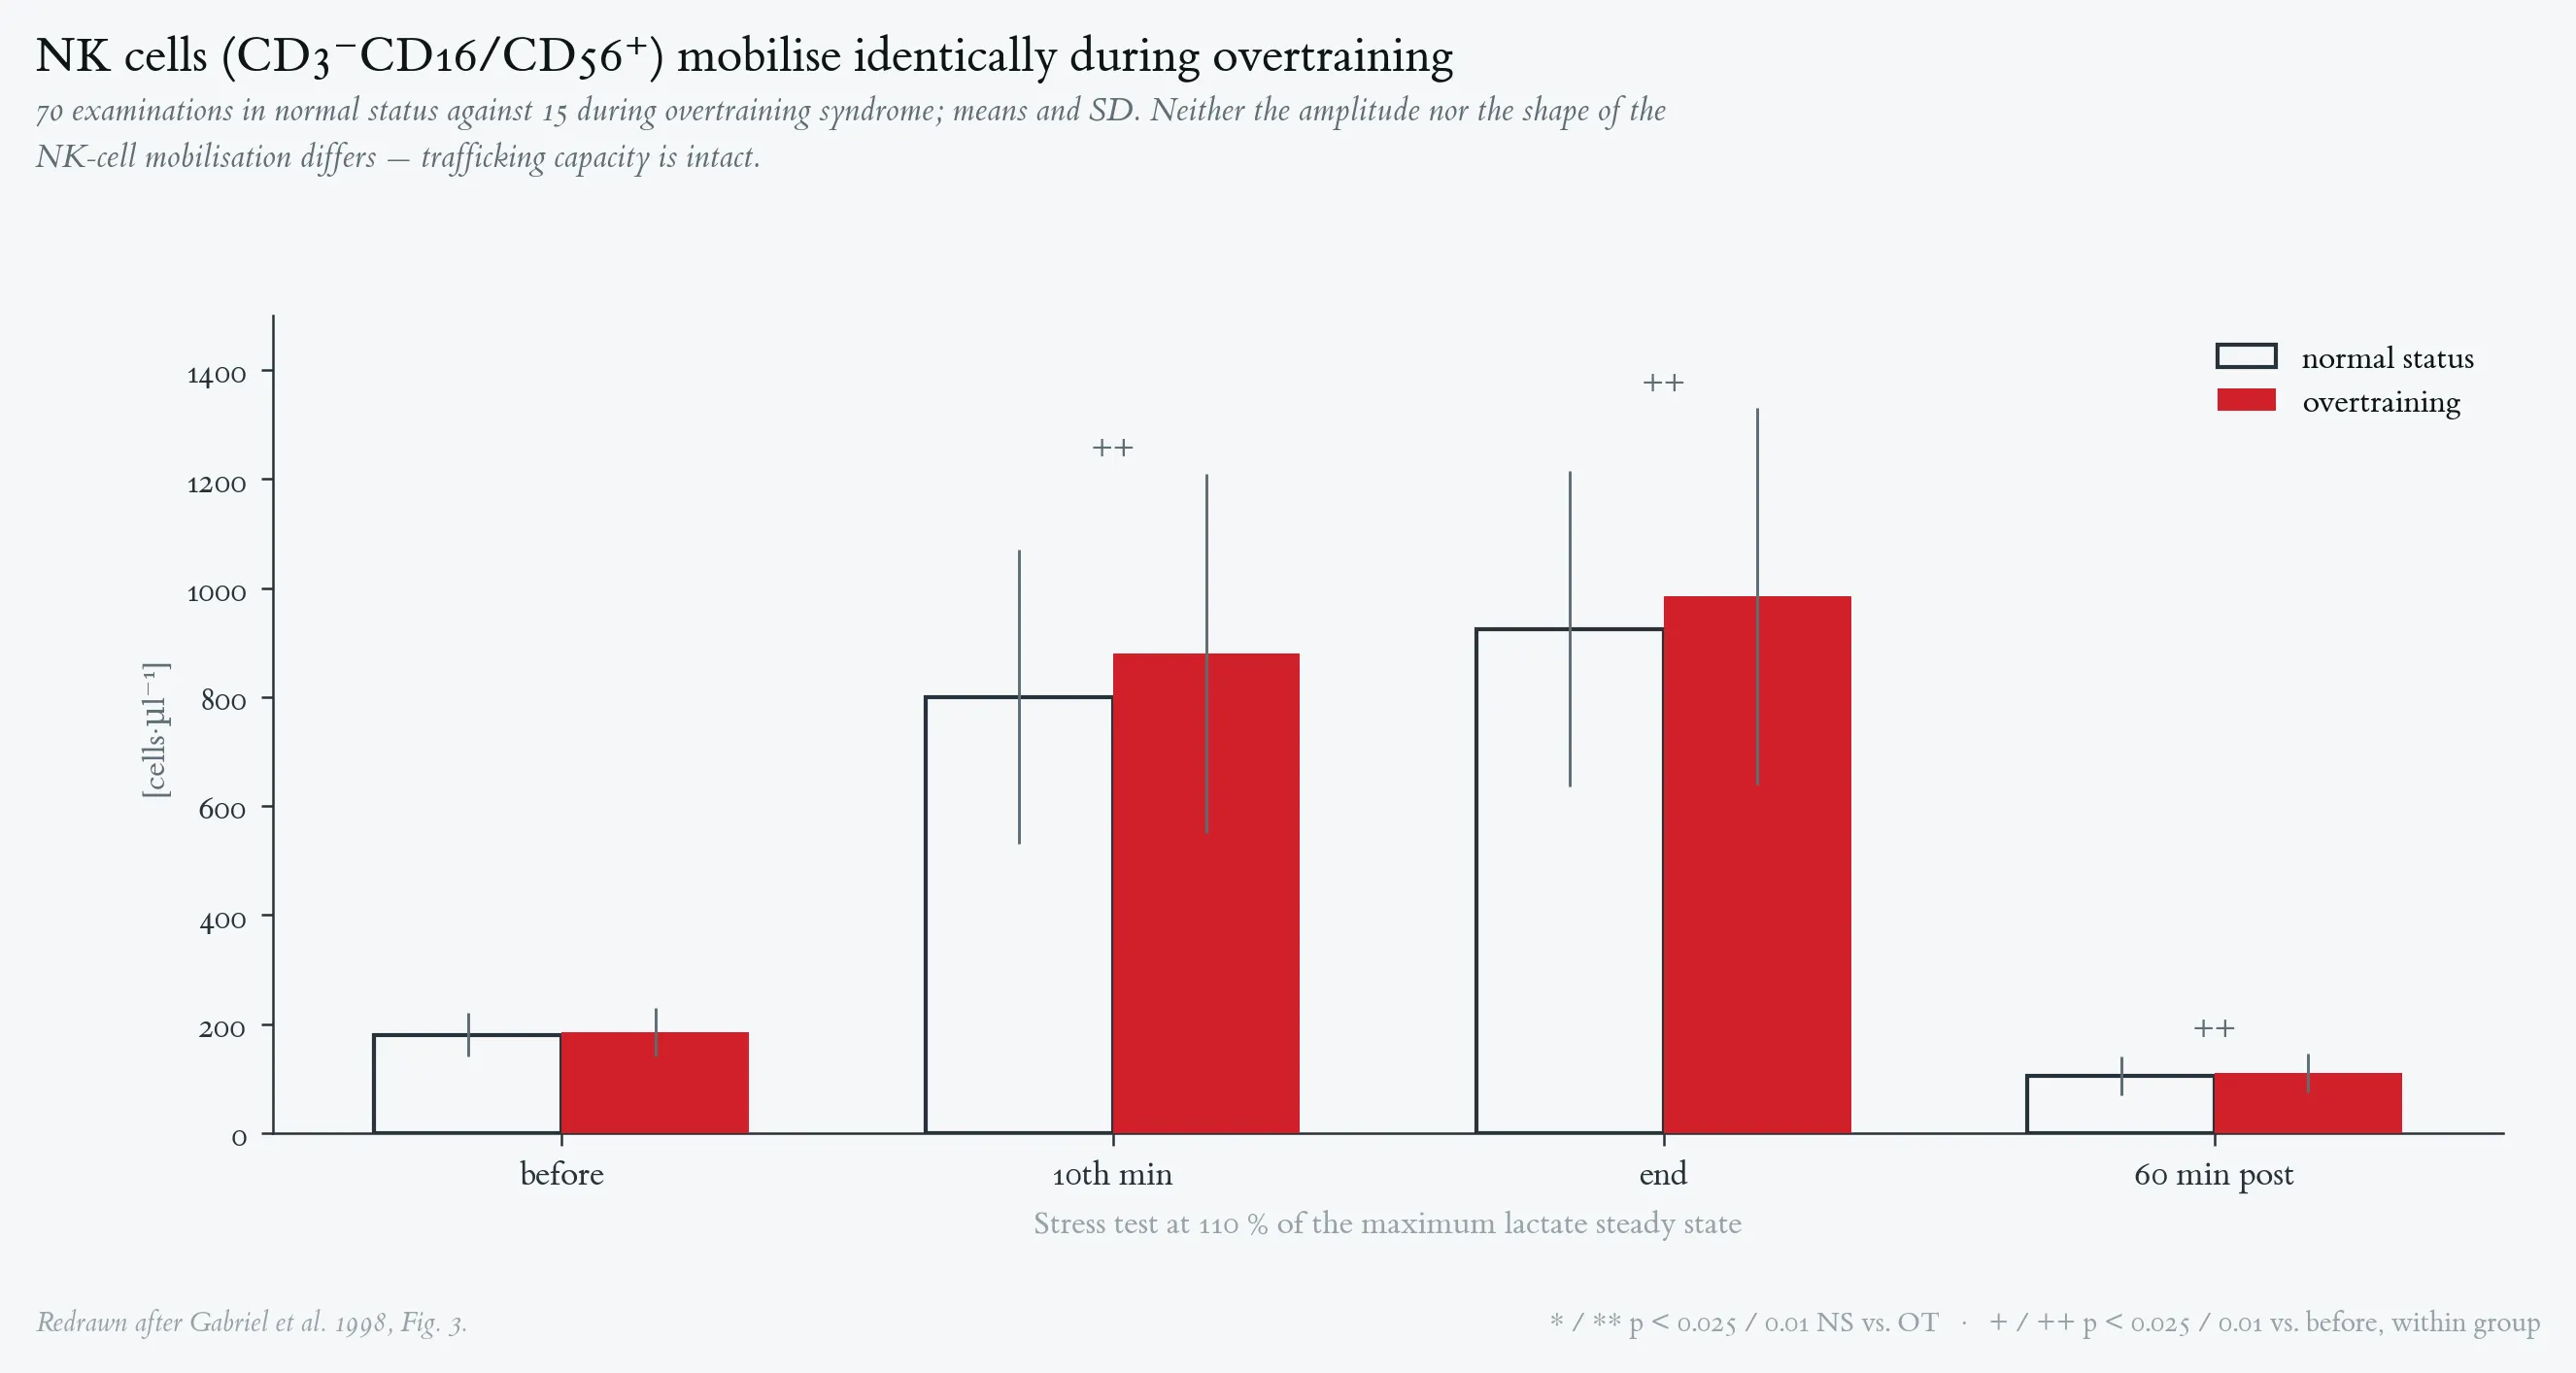
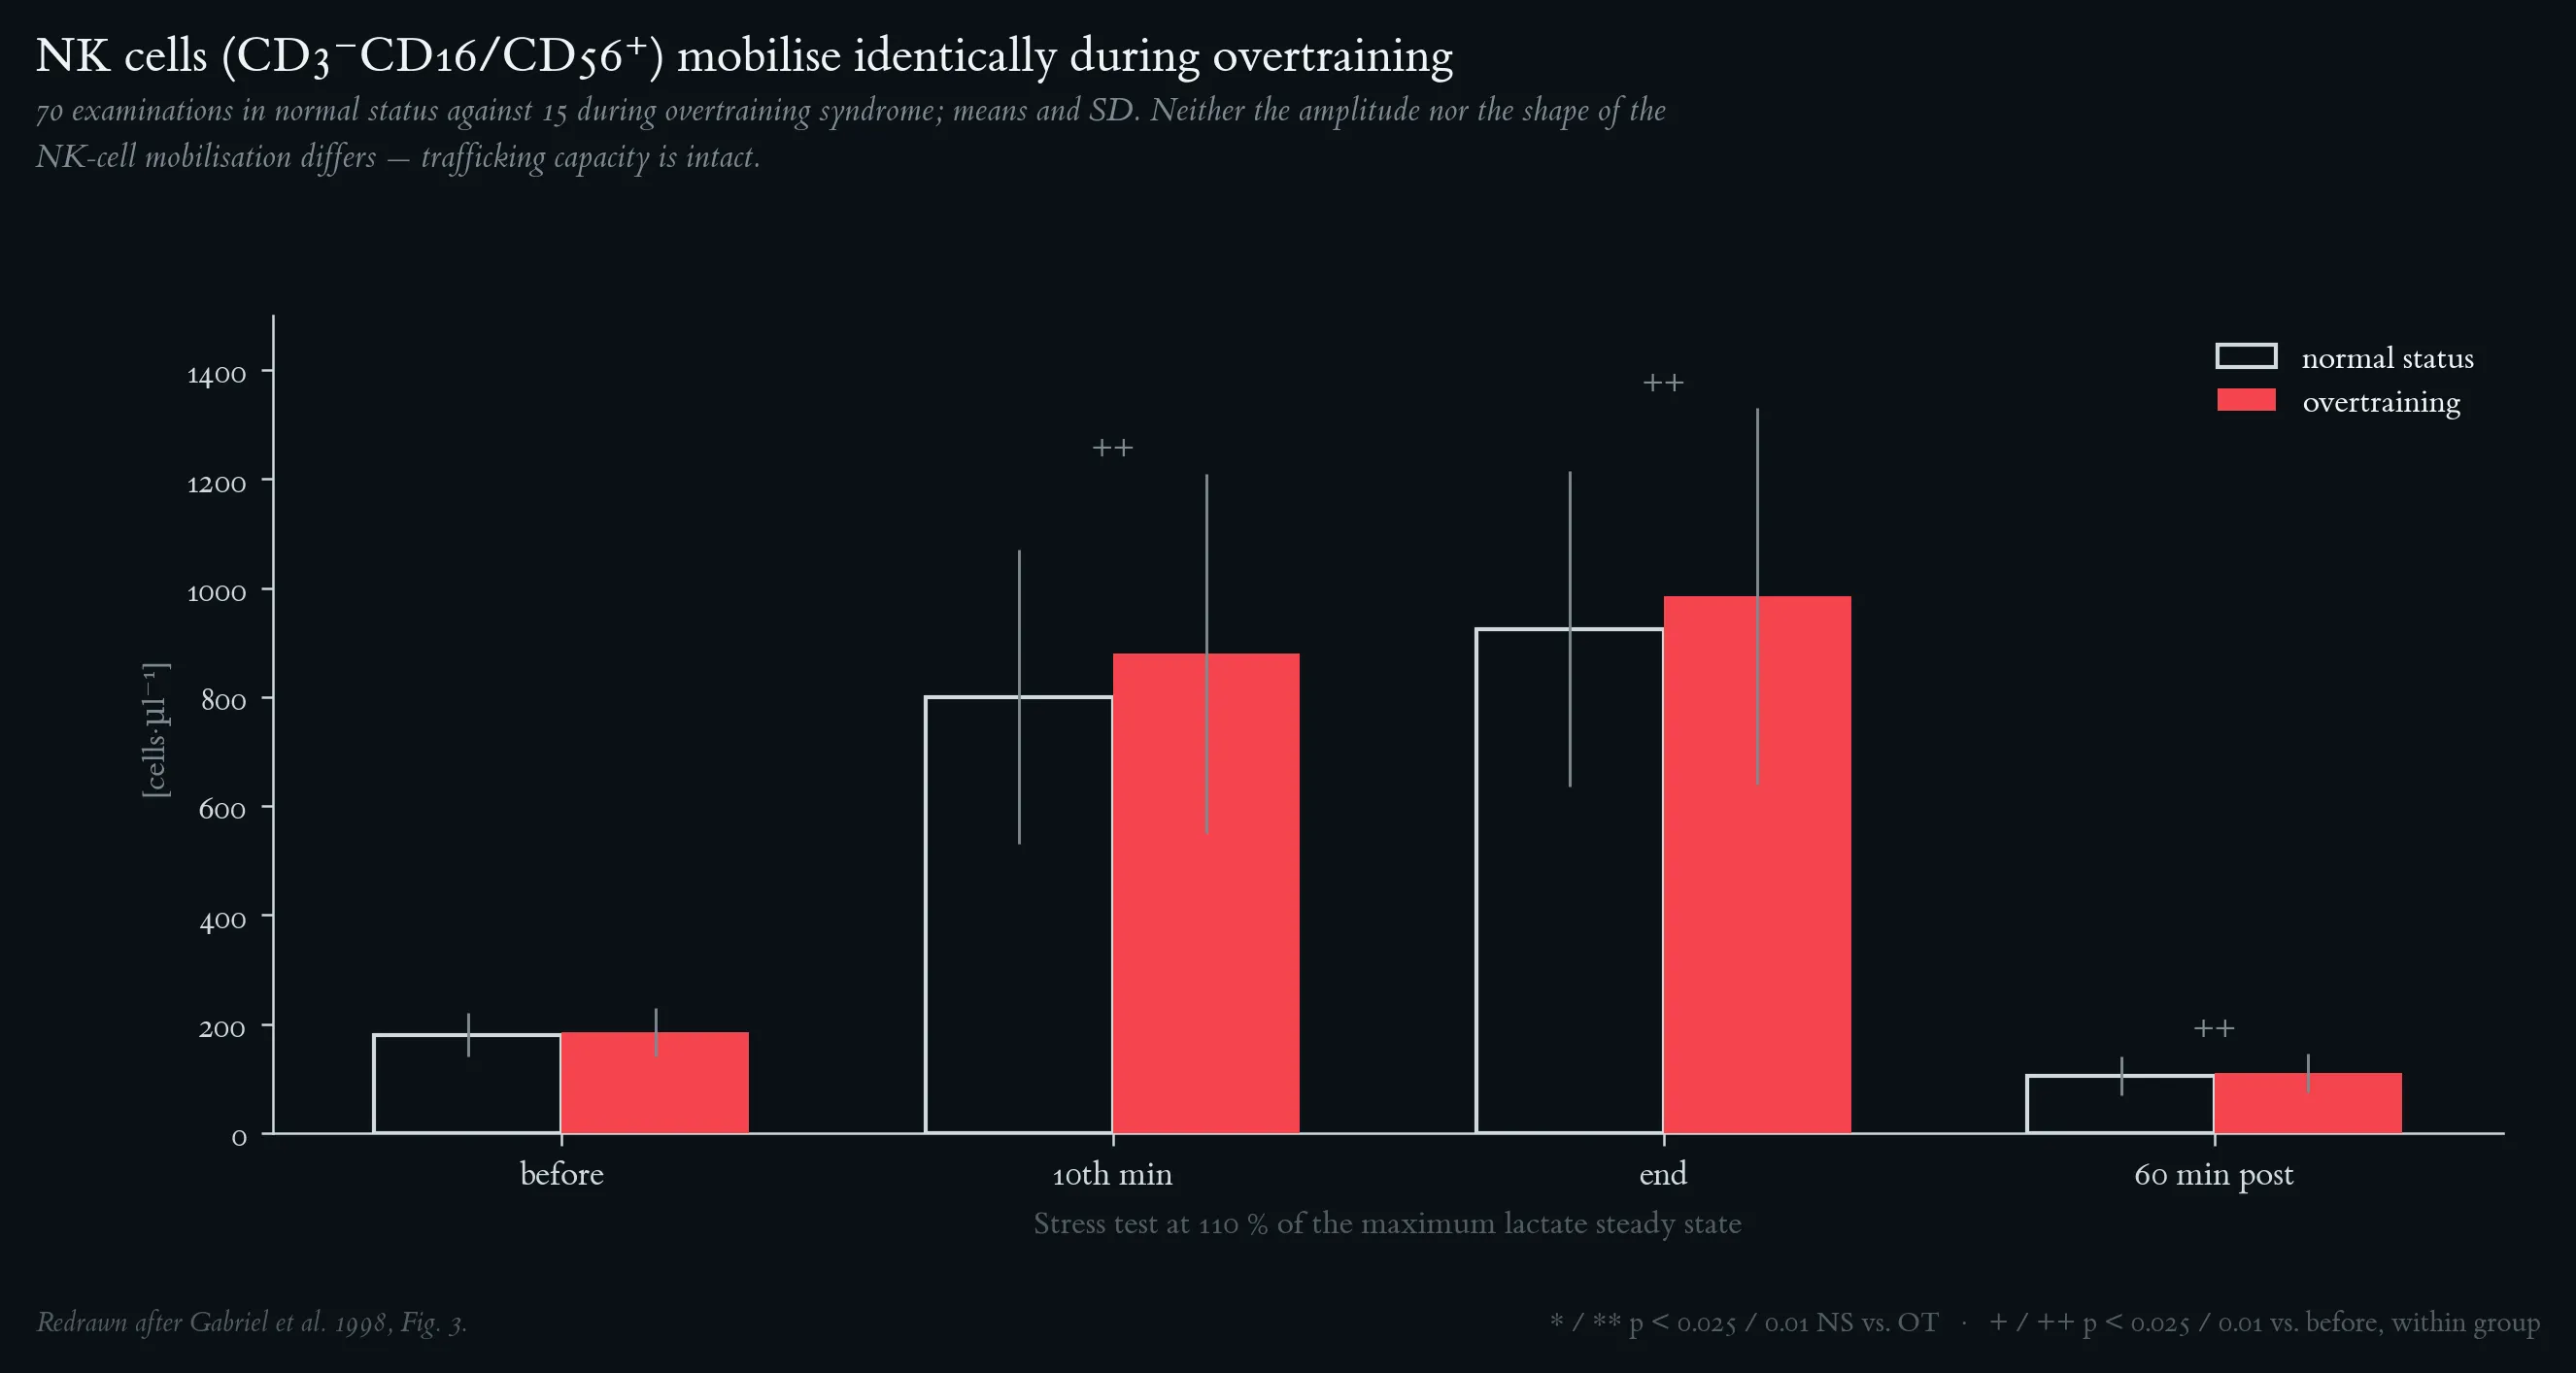
NK-cell counts (CD3⁻CD16/CD56⁺) before, during and after a standardised stress test, in normal status versus overtraining. Fifteen endurance athletes (12 cyclists, 3 triathletes; V̇O₂max 61.2 ± 7.5 mL·min⁻¹·kg⁻¹) were examined approximately every 3–5 months over 19 ± 3 months, yielding 85 examinations: 70 in normal status (NS, open bars) and 15 with a diagnosed overtraining syndrome (OT, filled bars). Blood was drawn before, at the 10th minute of, at the end of, and 60 min after a stress test at 110 % of the maximum lactate steady state. Means and SD; ++ p < 0.01 vs. before exercise within group; no between-group difference reached significance at any time point (significance level 2.5 %). Both the amplitude and the shape of NK-cell mobilisation are fully preserved during overtraining. Redrawn after Gabriel et al. 1998, Fig. 3.
Cytotoxic, non-MHC-restricted T-cell counts (CD3⁺CD16/CD56⁺). Subjects, study design, stress-test protocol and sampling as in Figure 7. Means and SD; * / ** p < 0.025 / 0.01 between NS and OT; + / ++ p < 0.025 / 0.01 vs. before exercise within group. This is the only major cell line whose absolute count was moderately higher during OT — before, at the end of, and 60 min after the test — yet the exercise-induced mobilisation pattern itself is indistinguishable between the two states, i.e. trafficking capacity is unimpaired. Redrawn after Gabriel et al. 1998, Fig. 4.
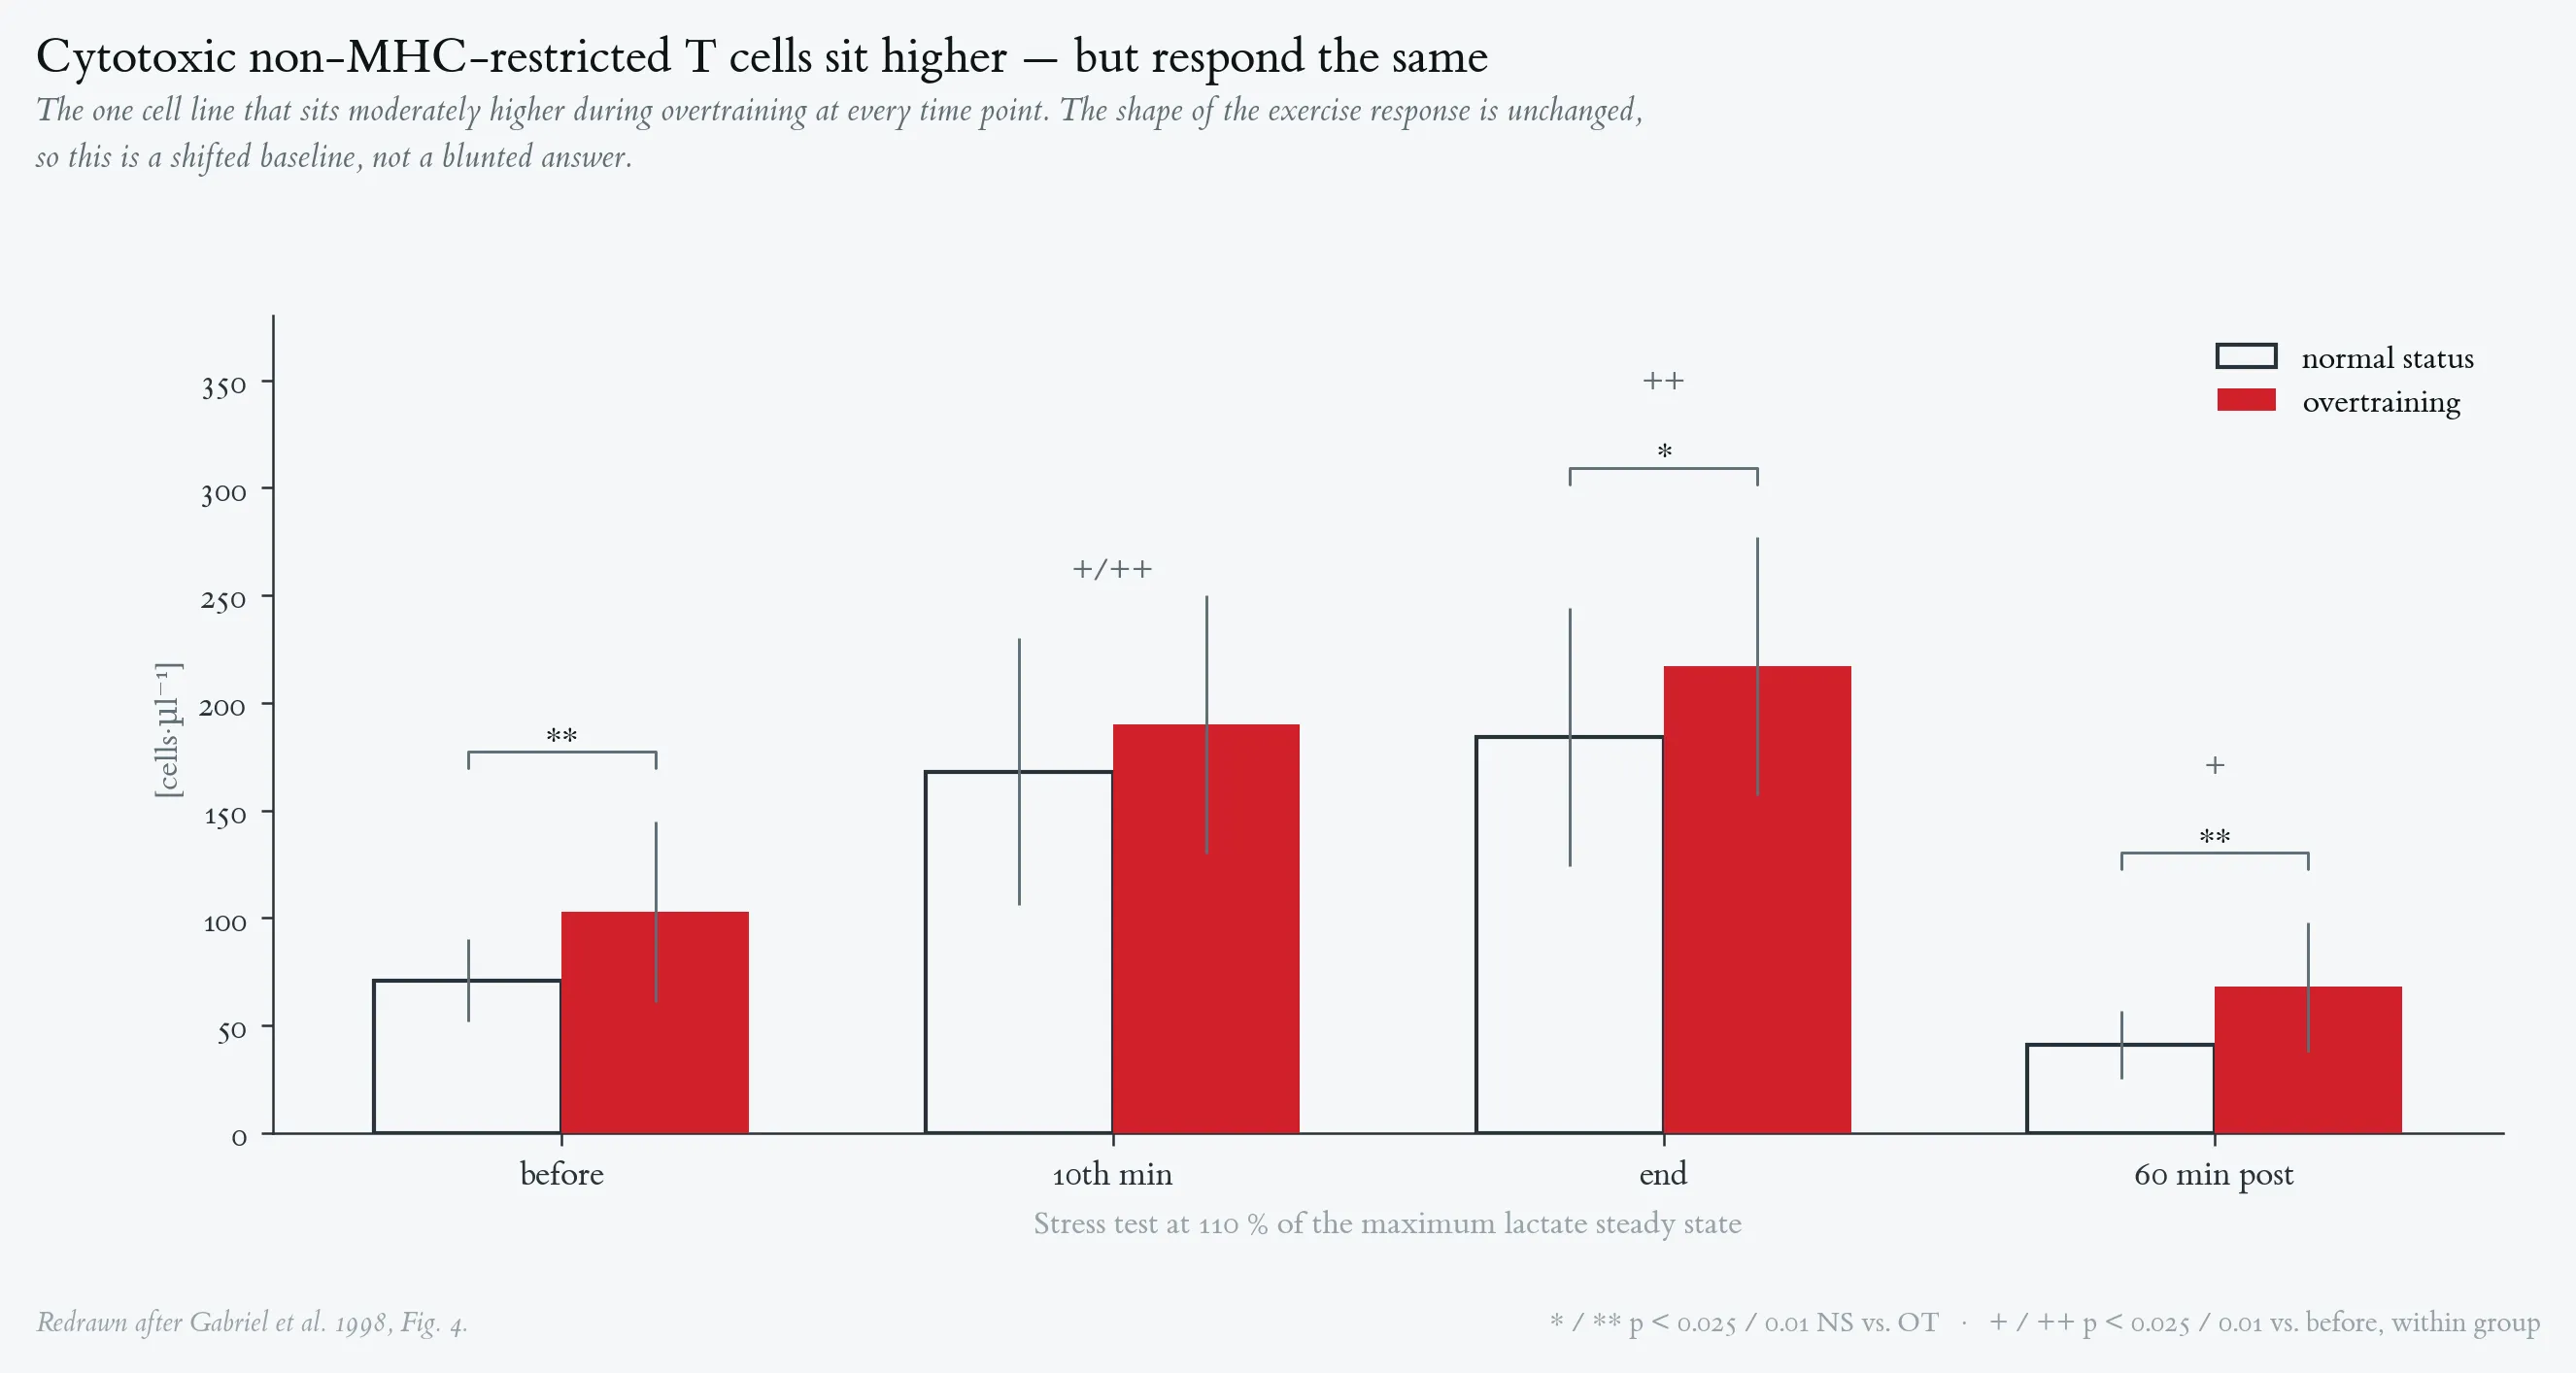
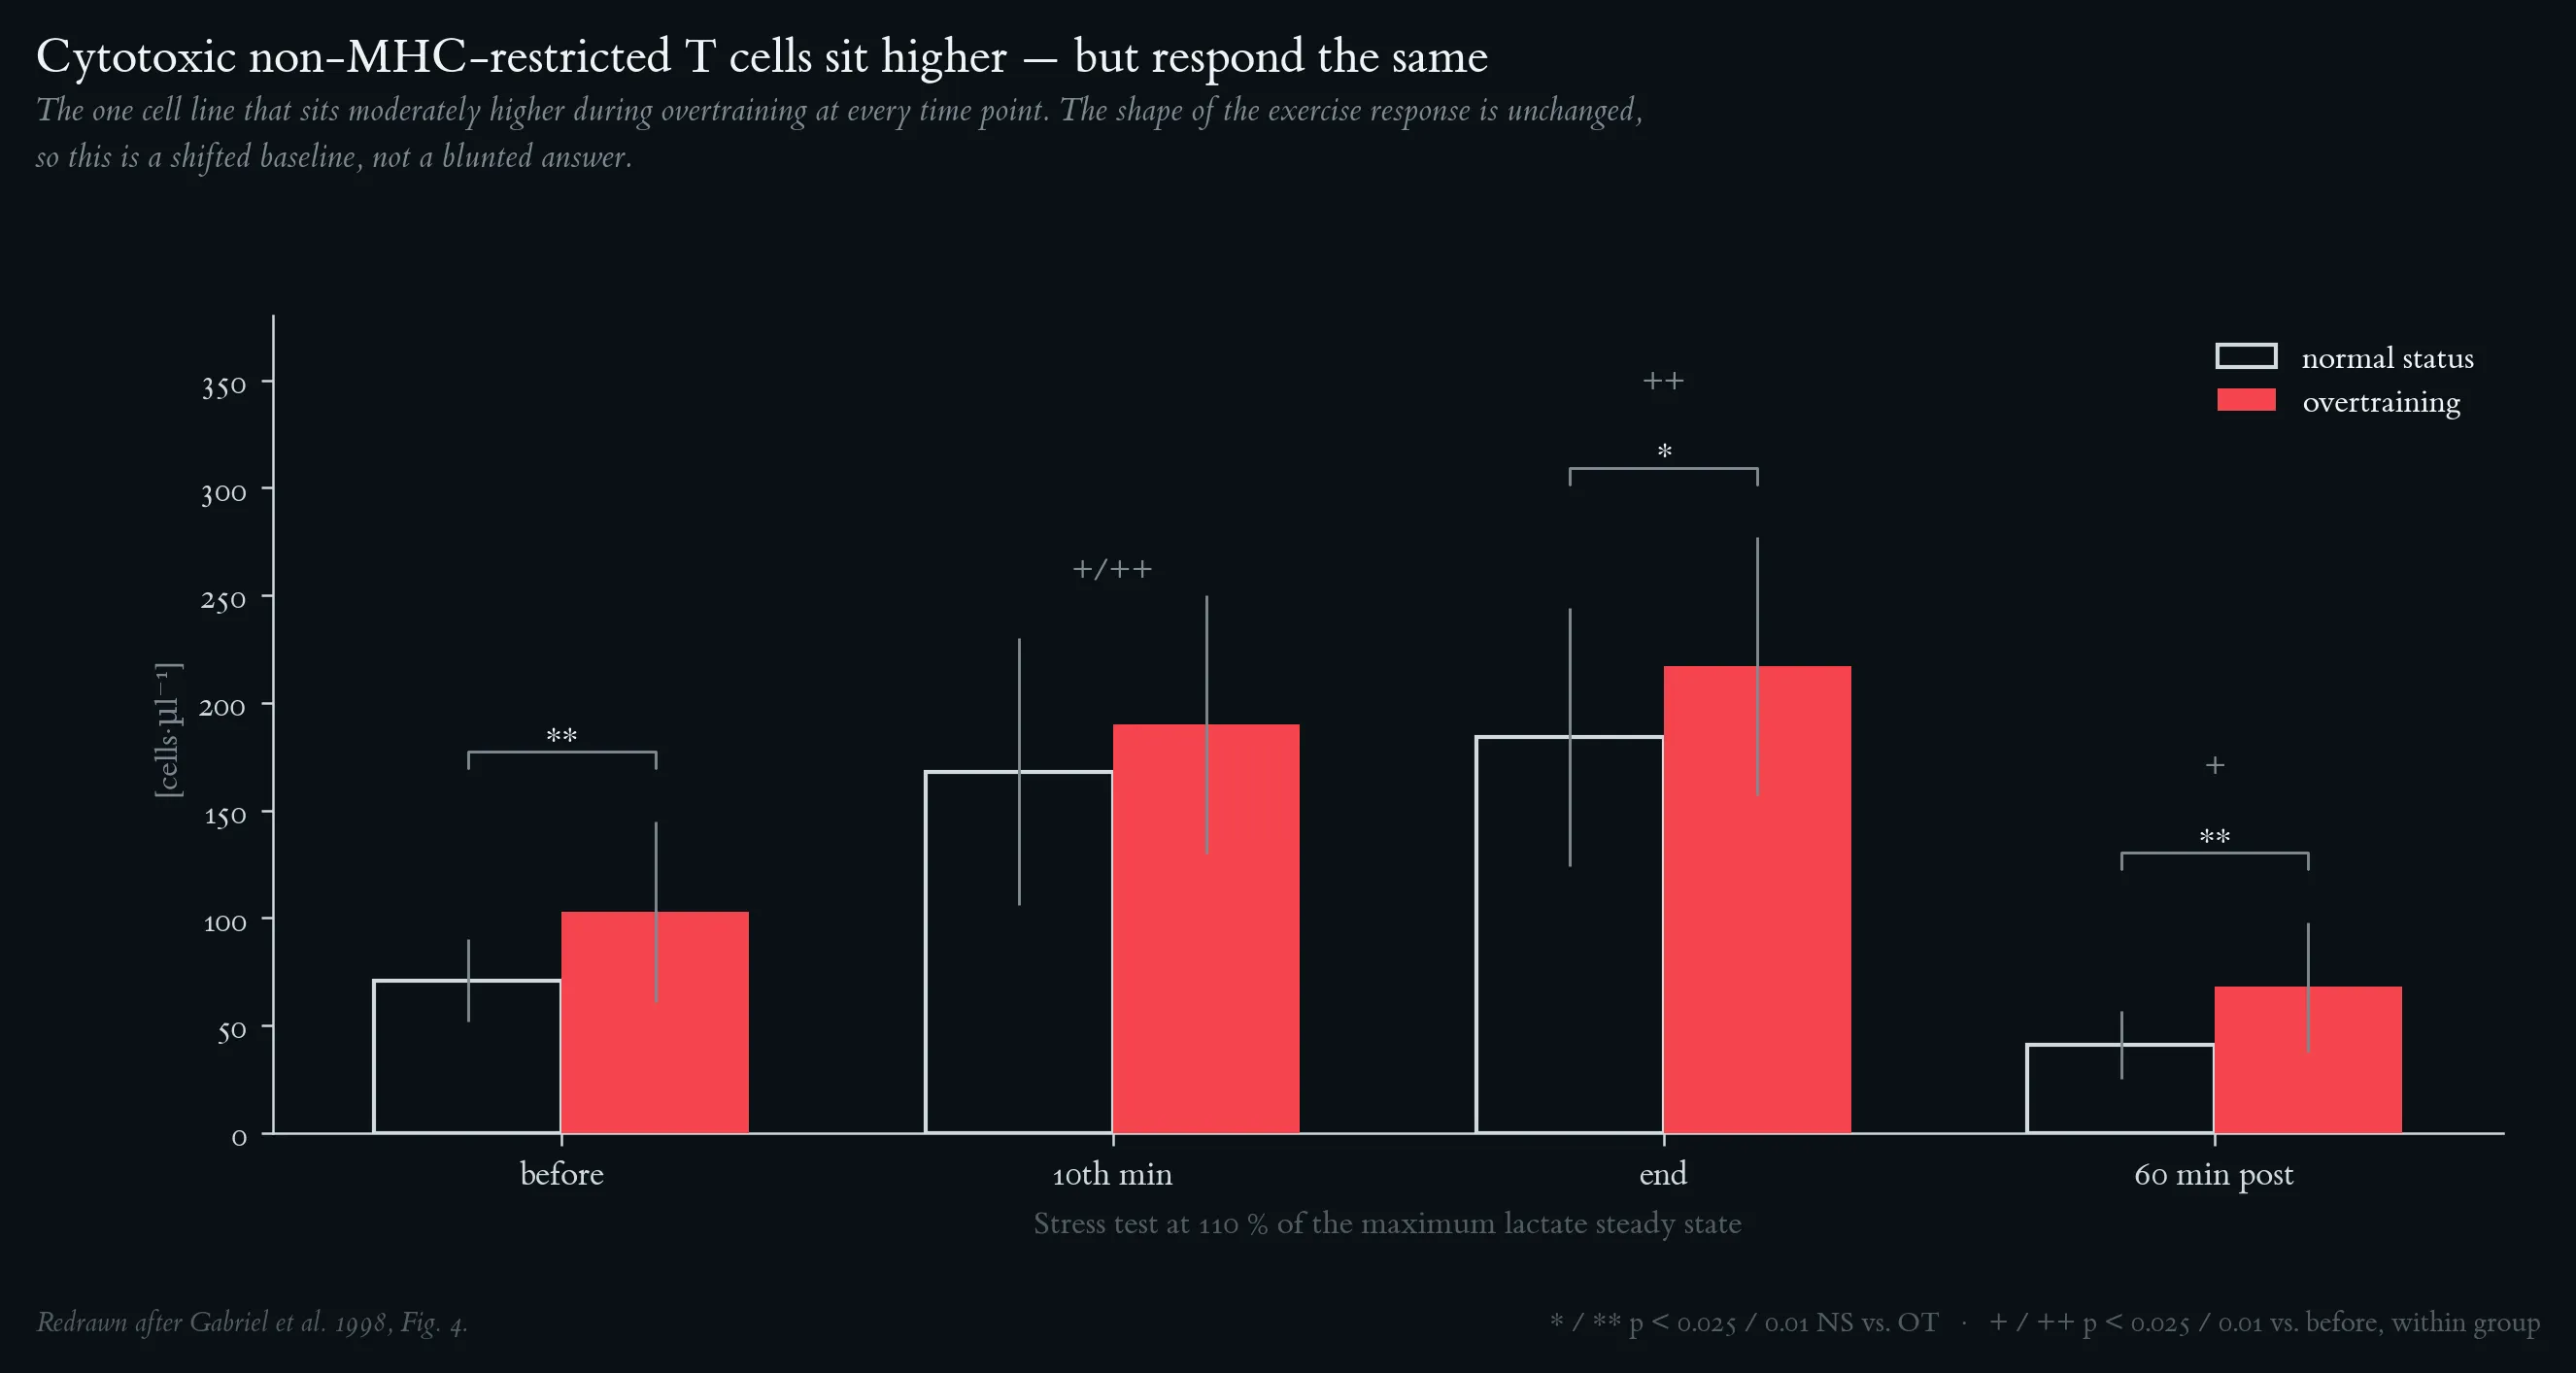
Cytotoxic, non-MHC-restricted T-cell counts (CD3⁺CD16/CD56⁺). Subjects, study design, stress-test protocol and sampling as in Figure 7. Means and SD; * / ** p < 0.025 / 0.01 between NS and OT; + / ++ p < 0.025 / 0.01 vs. before exercise within group. This is the only major cell line whose absolute count was moderately higher during OT — before, at the end of, and 60 min after the test — yet the exercise-induced mobilisation pattern itself is indistinguishable between the two states, i.e. trafficking capacity is unimpaired. Redrawn after Gabriel et al. 1998, Fig. 4.
Cytotoxic and activated T-cell subsets expressed as a percentage of CD3⁺ T cells, normal status versus overtraining. Subjects and study design as in Figure 7. CD3⁺CD16/CD56⁺ cells rose from 7.2 to 10.0 % and CD3⁺HLA-DR⁺ cells from 5.5 ± 2.7 to 7.3 ± 2.4 % of CD3⁺ cells during OT. Means and SD; * / ** p < 0.025 / 0.01 between NS and OT. Together with the higher CD45RO fluorescence intensity on CD4⁺ and CD8⁺ cells — at unchanged absolute CD45RO⁺ counts — this represents a fine upregulation of T-cell activation status rather than the pathological activation seen in, for example, infectious mononucleosis, and was not judged clinically relevant. Redrawn after Gabriel et al. 1998, Fig. 5.
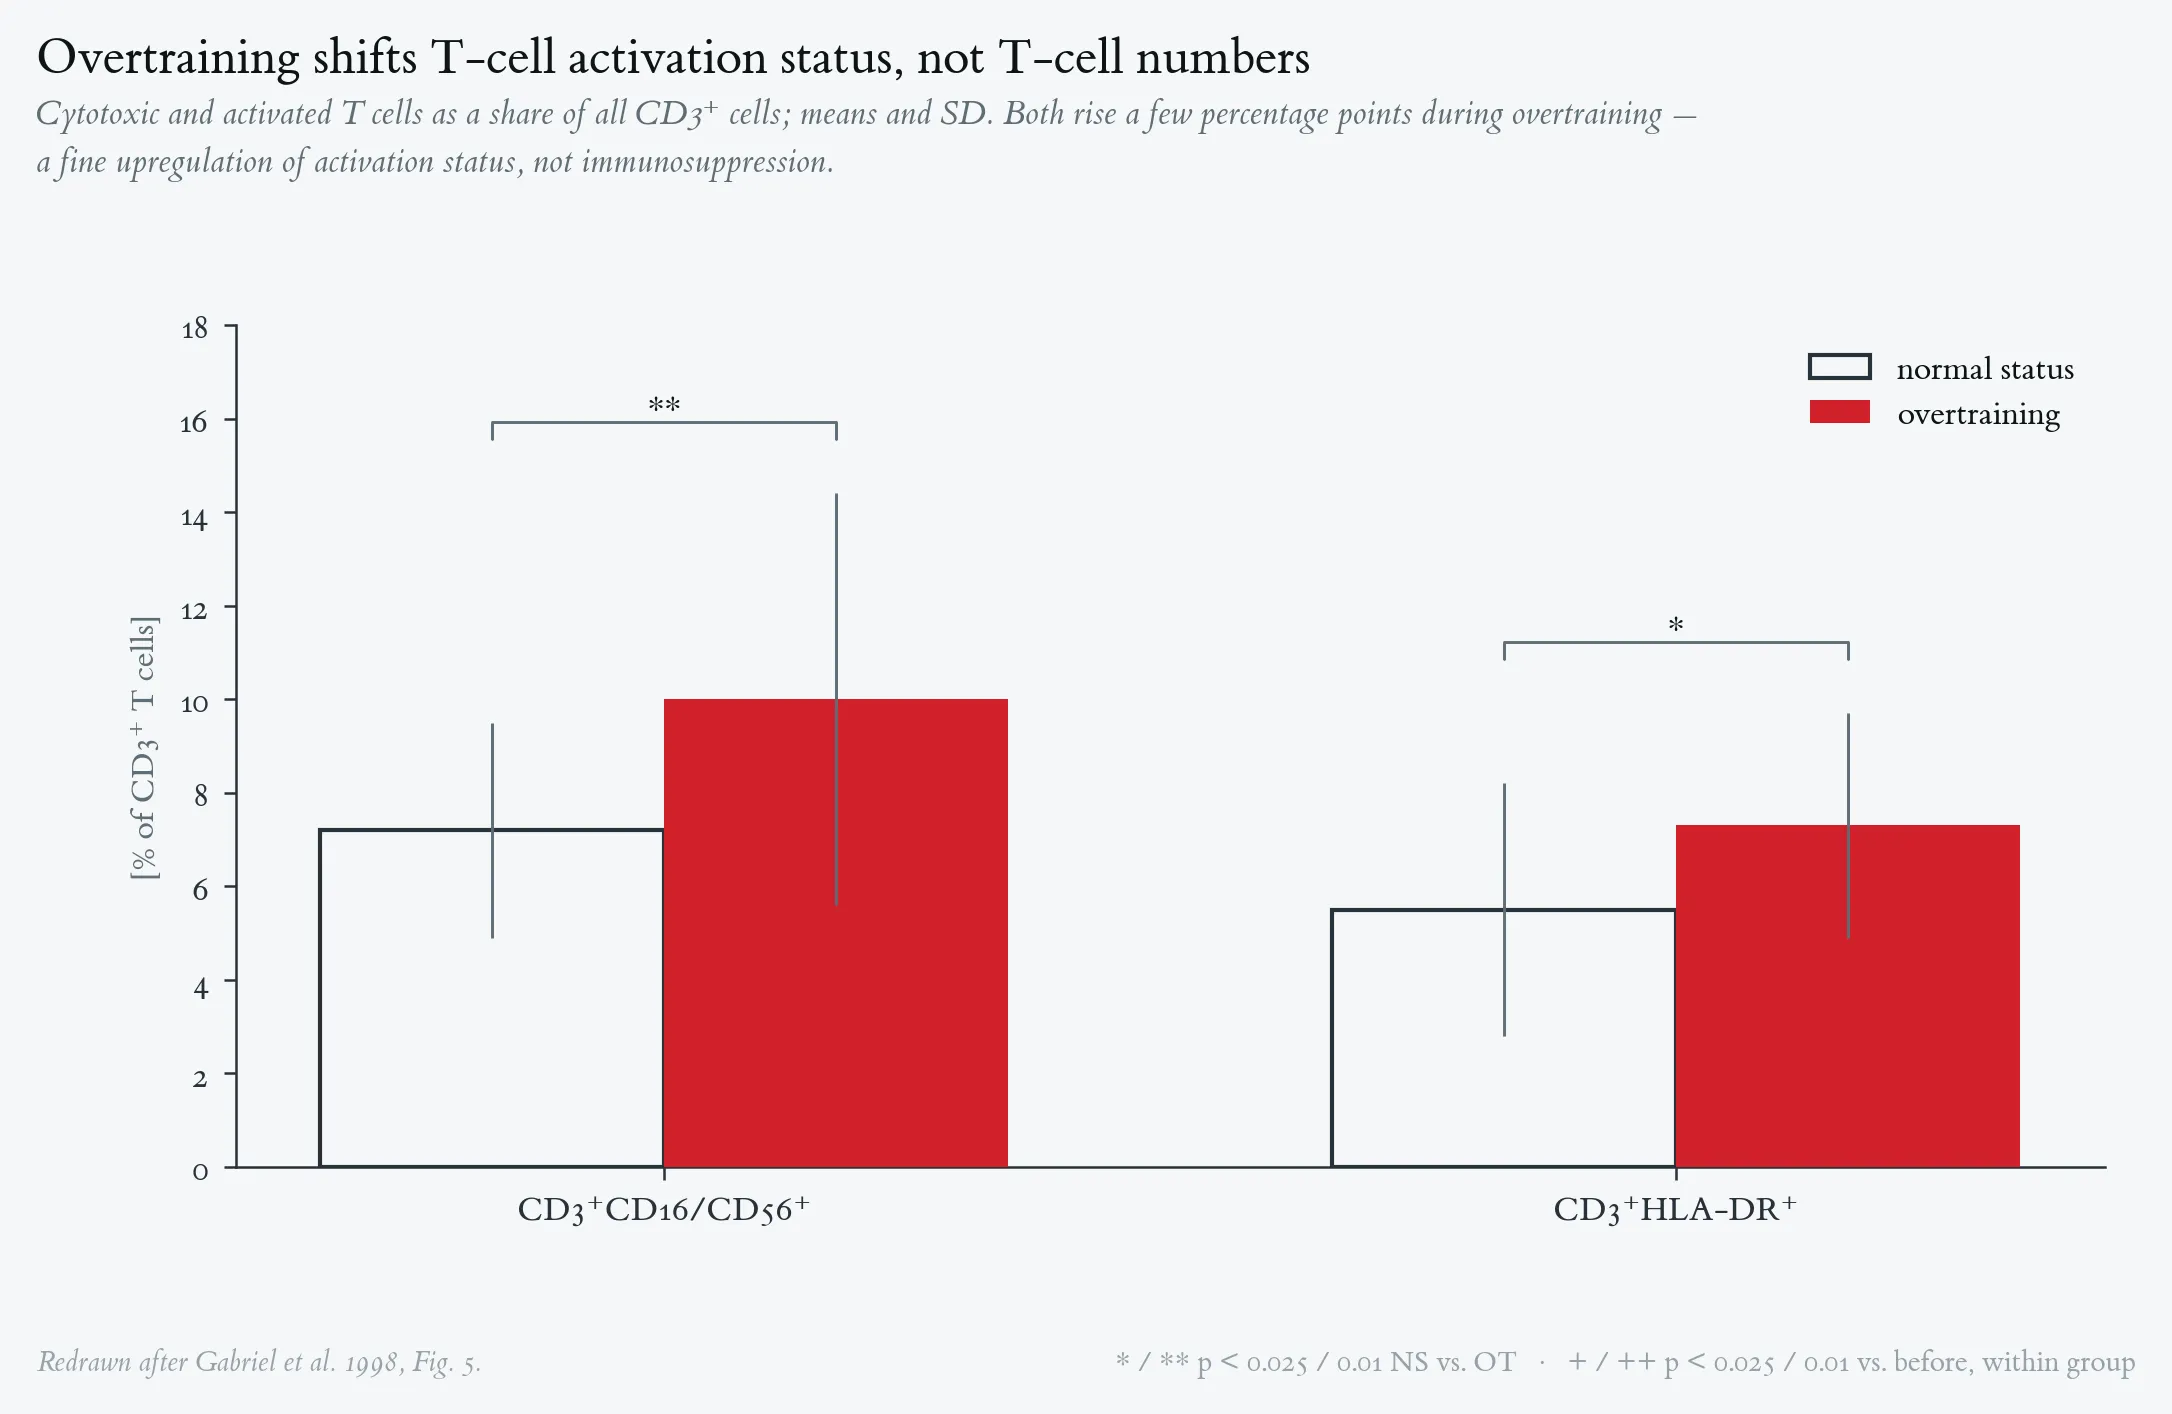
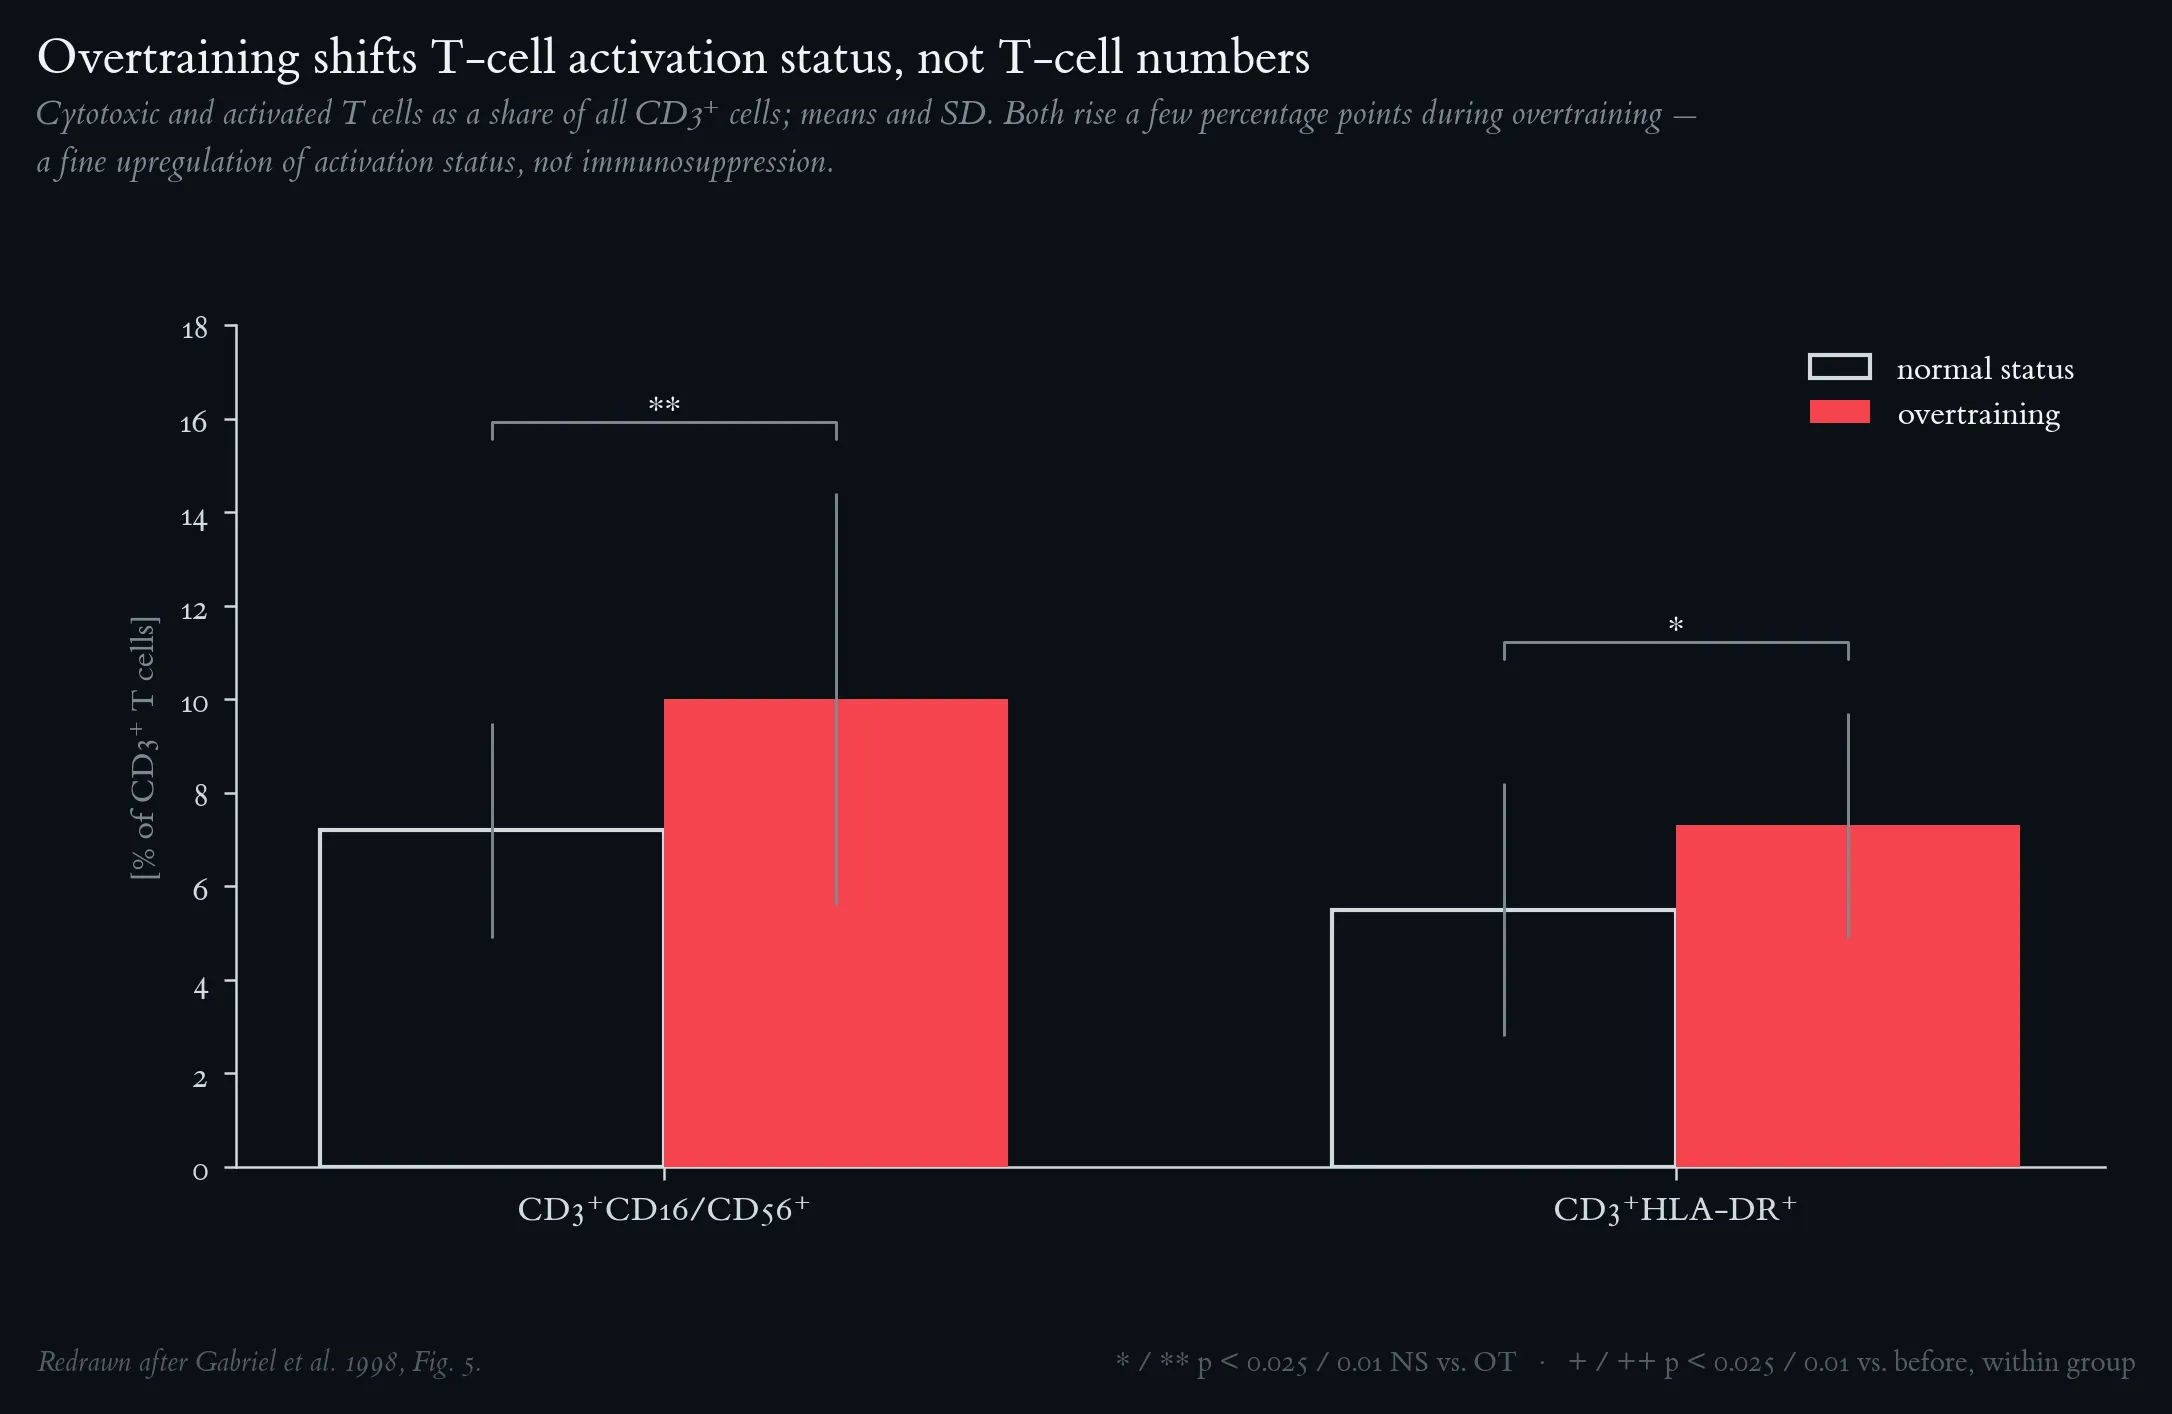
Cytotoxic and activated T-cell subsets expressed as a percentage of CD3⁺ T cells, normal status versus overtraining. Subjects and study design as in Figure 7. CD3⁺CD16/CD56⁺ cells rose from 7.2 to 10.0 % and CD3⁺HLA-DR⁺ cells from 5.5 ± 2.7 to 7.3 ± 2.4 % of CD3⁺ cells during OT. Means and SD; * / ** p < 0.025 / 0.01 between NS and OT. Together with the higher CD45RO fluorescence intensity on CD4⁺ and CD8⁺ cells — at unchanged absolute CD45RO⁺ counts — this represents a fine upregulation of T-cell activation status rather than the pathological activation seen in, for example, infectious mononucleosis, and was not judged clinically relevant. Redrawn after Gabriel et al. 1998, Fig. 5.
Lecture 5: Overtraining Syndrome — Pathological Counterpart of the Lactate Shuttle
On a logarithmic recovery axis the three states stop looking like neighbours: every step down the continuum multiplies the cost by roughly ten, and only OTS has no defined end. The lower band contrasts the two autonomic forms after Israel. Terminology and recovery windows after the ECSS/ACSM consensus statement (Meeusen et al. 2013).
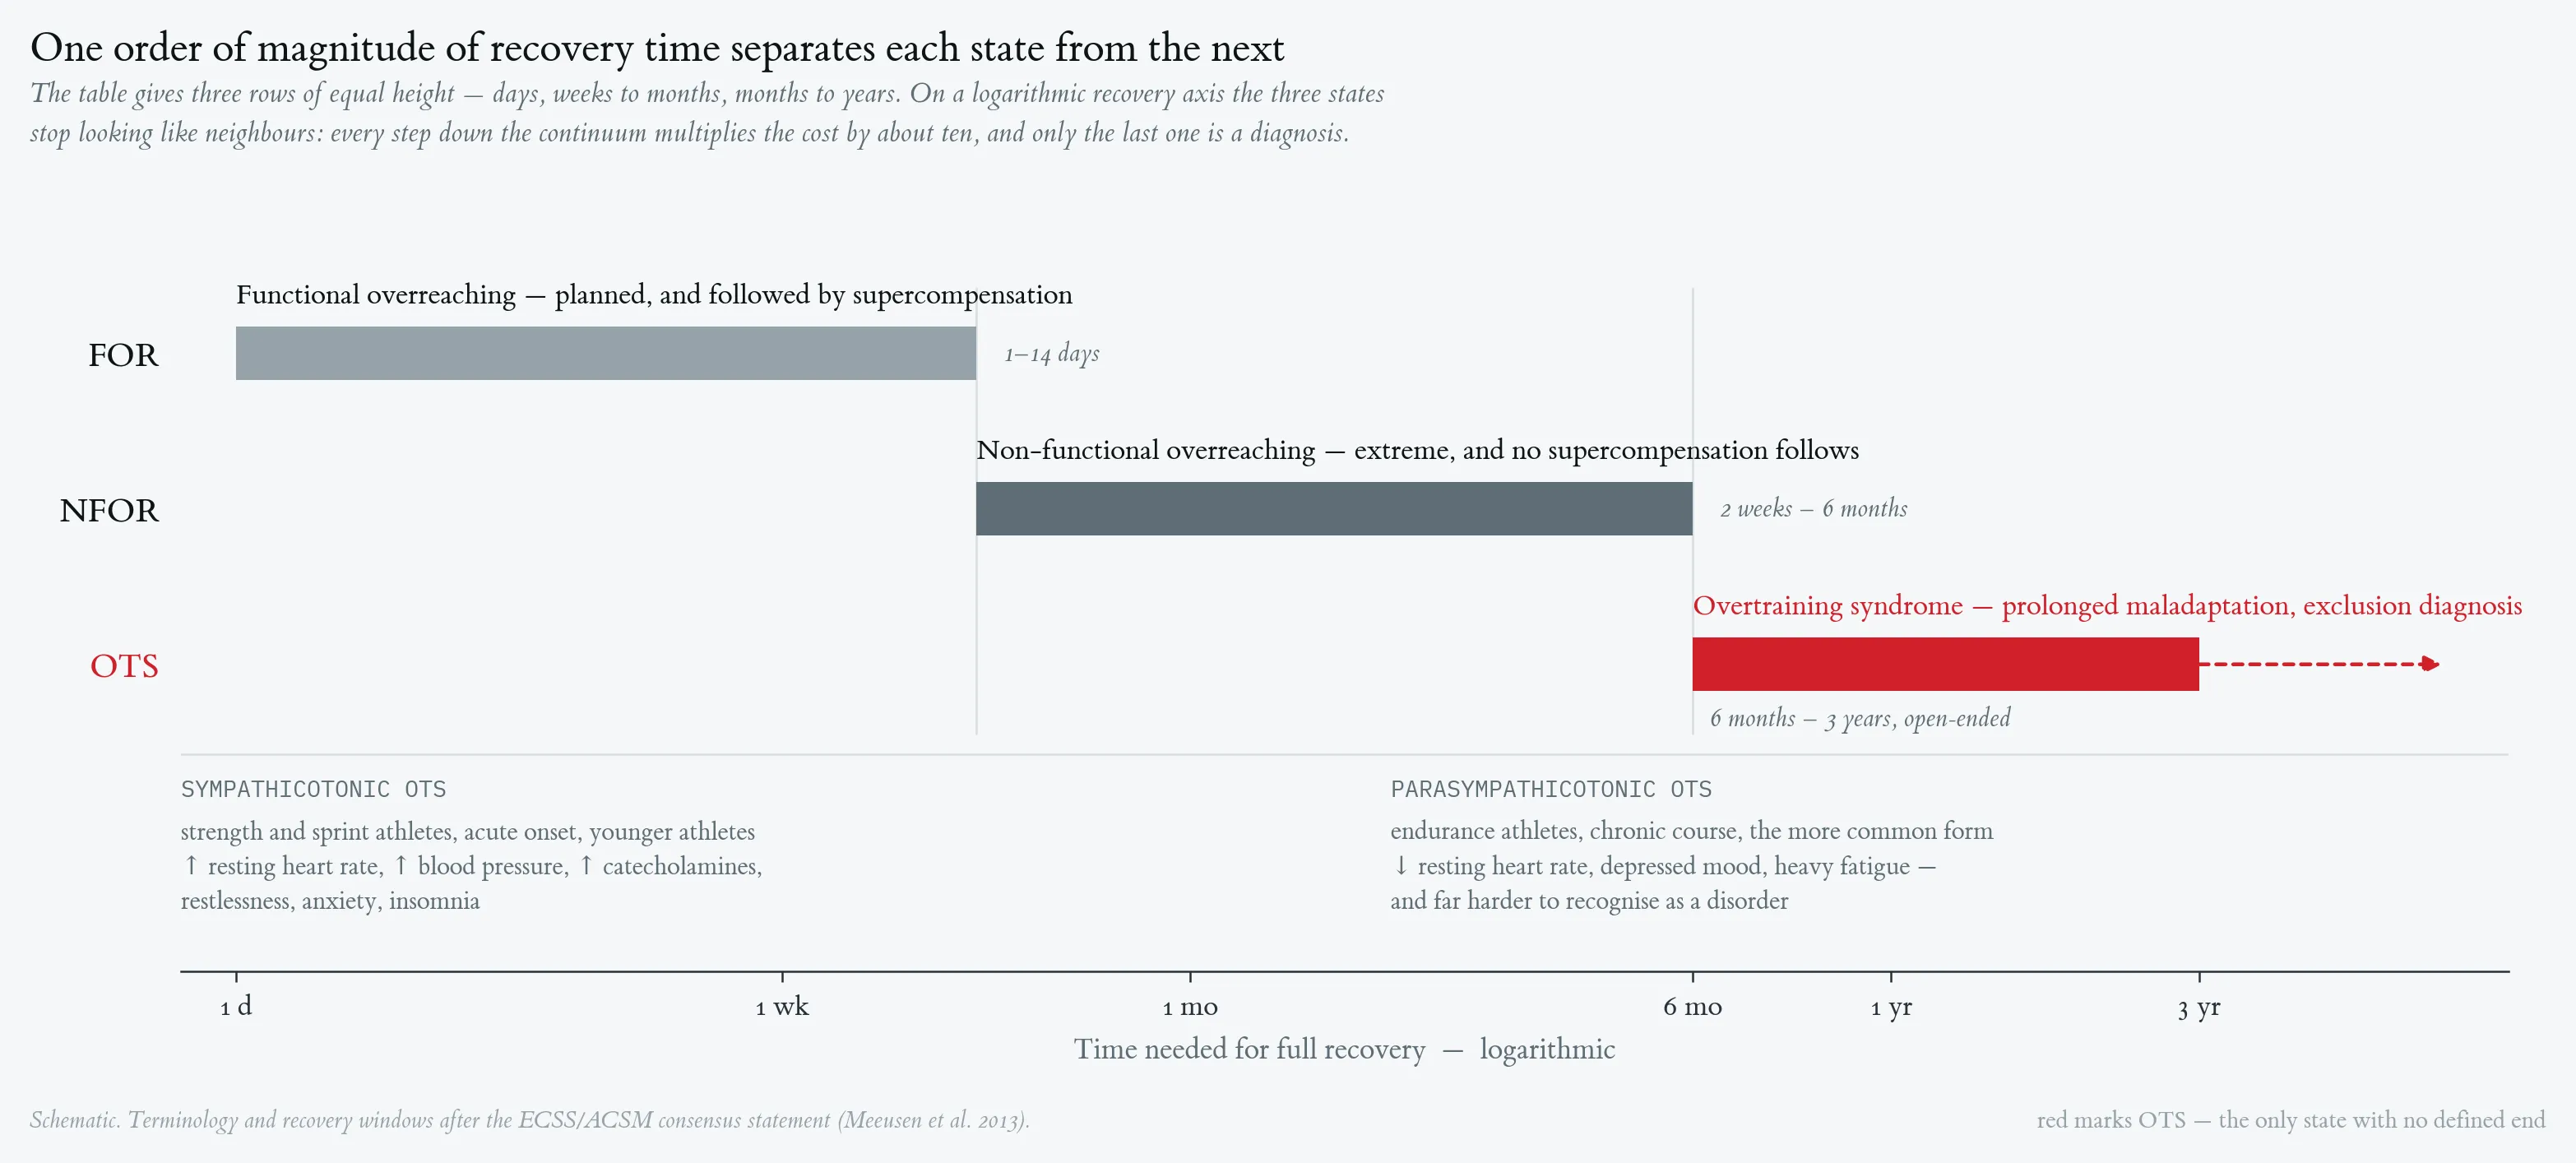
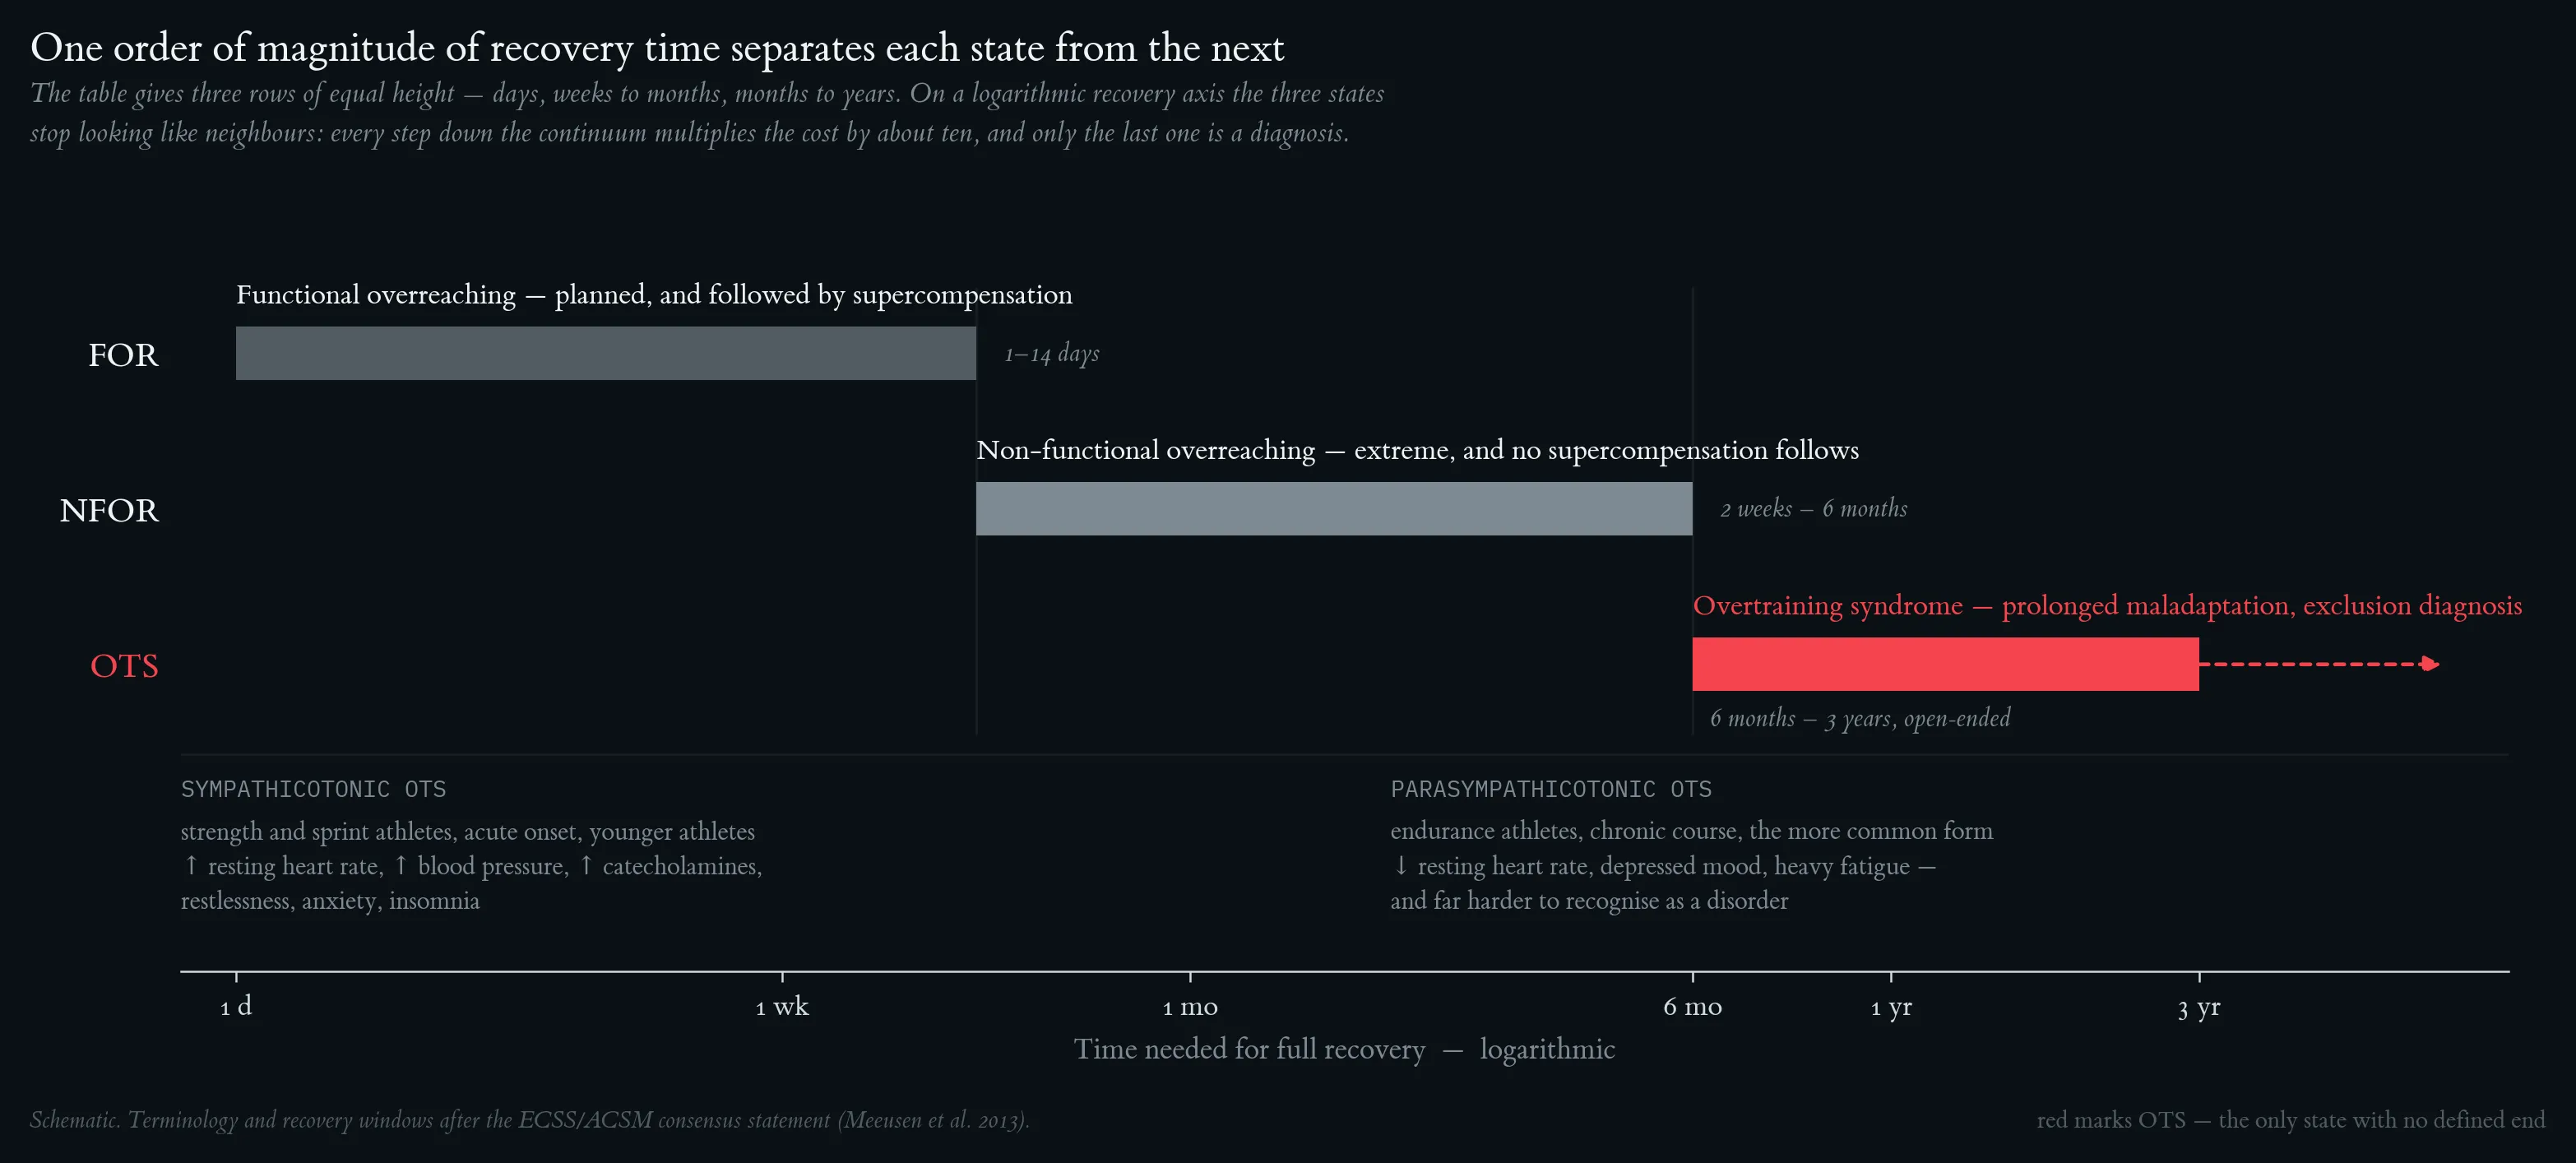
On a logarithmic recovery axis the three states stop looking like neighbours: every step down the continuum multiplies the cost by roughly ten, and only OTS has no defined end. The lower band contrasts the two autonomic forms after Israel. Terminology and recovery windows after the ECSS/ACSM consensus statement (Meeusen et al. 2013).
Both conditions lower maximal lactate, but only one moves the curve. Overtraining reproduces the healthy lactate–power curve under a lower ceiling — the defect is reduced production. ME/CFS and Long COVID shift the whole curve left and up, and 4 mmol·L⁻¹ arrives 44 percentage points earlier — a clearance defect. Schematic curves; discriminating features after Lien et al. (2019), Snell et al. (2013) and Haunhorst et al. (2022).
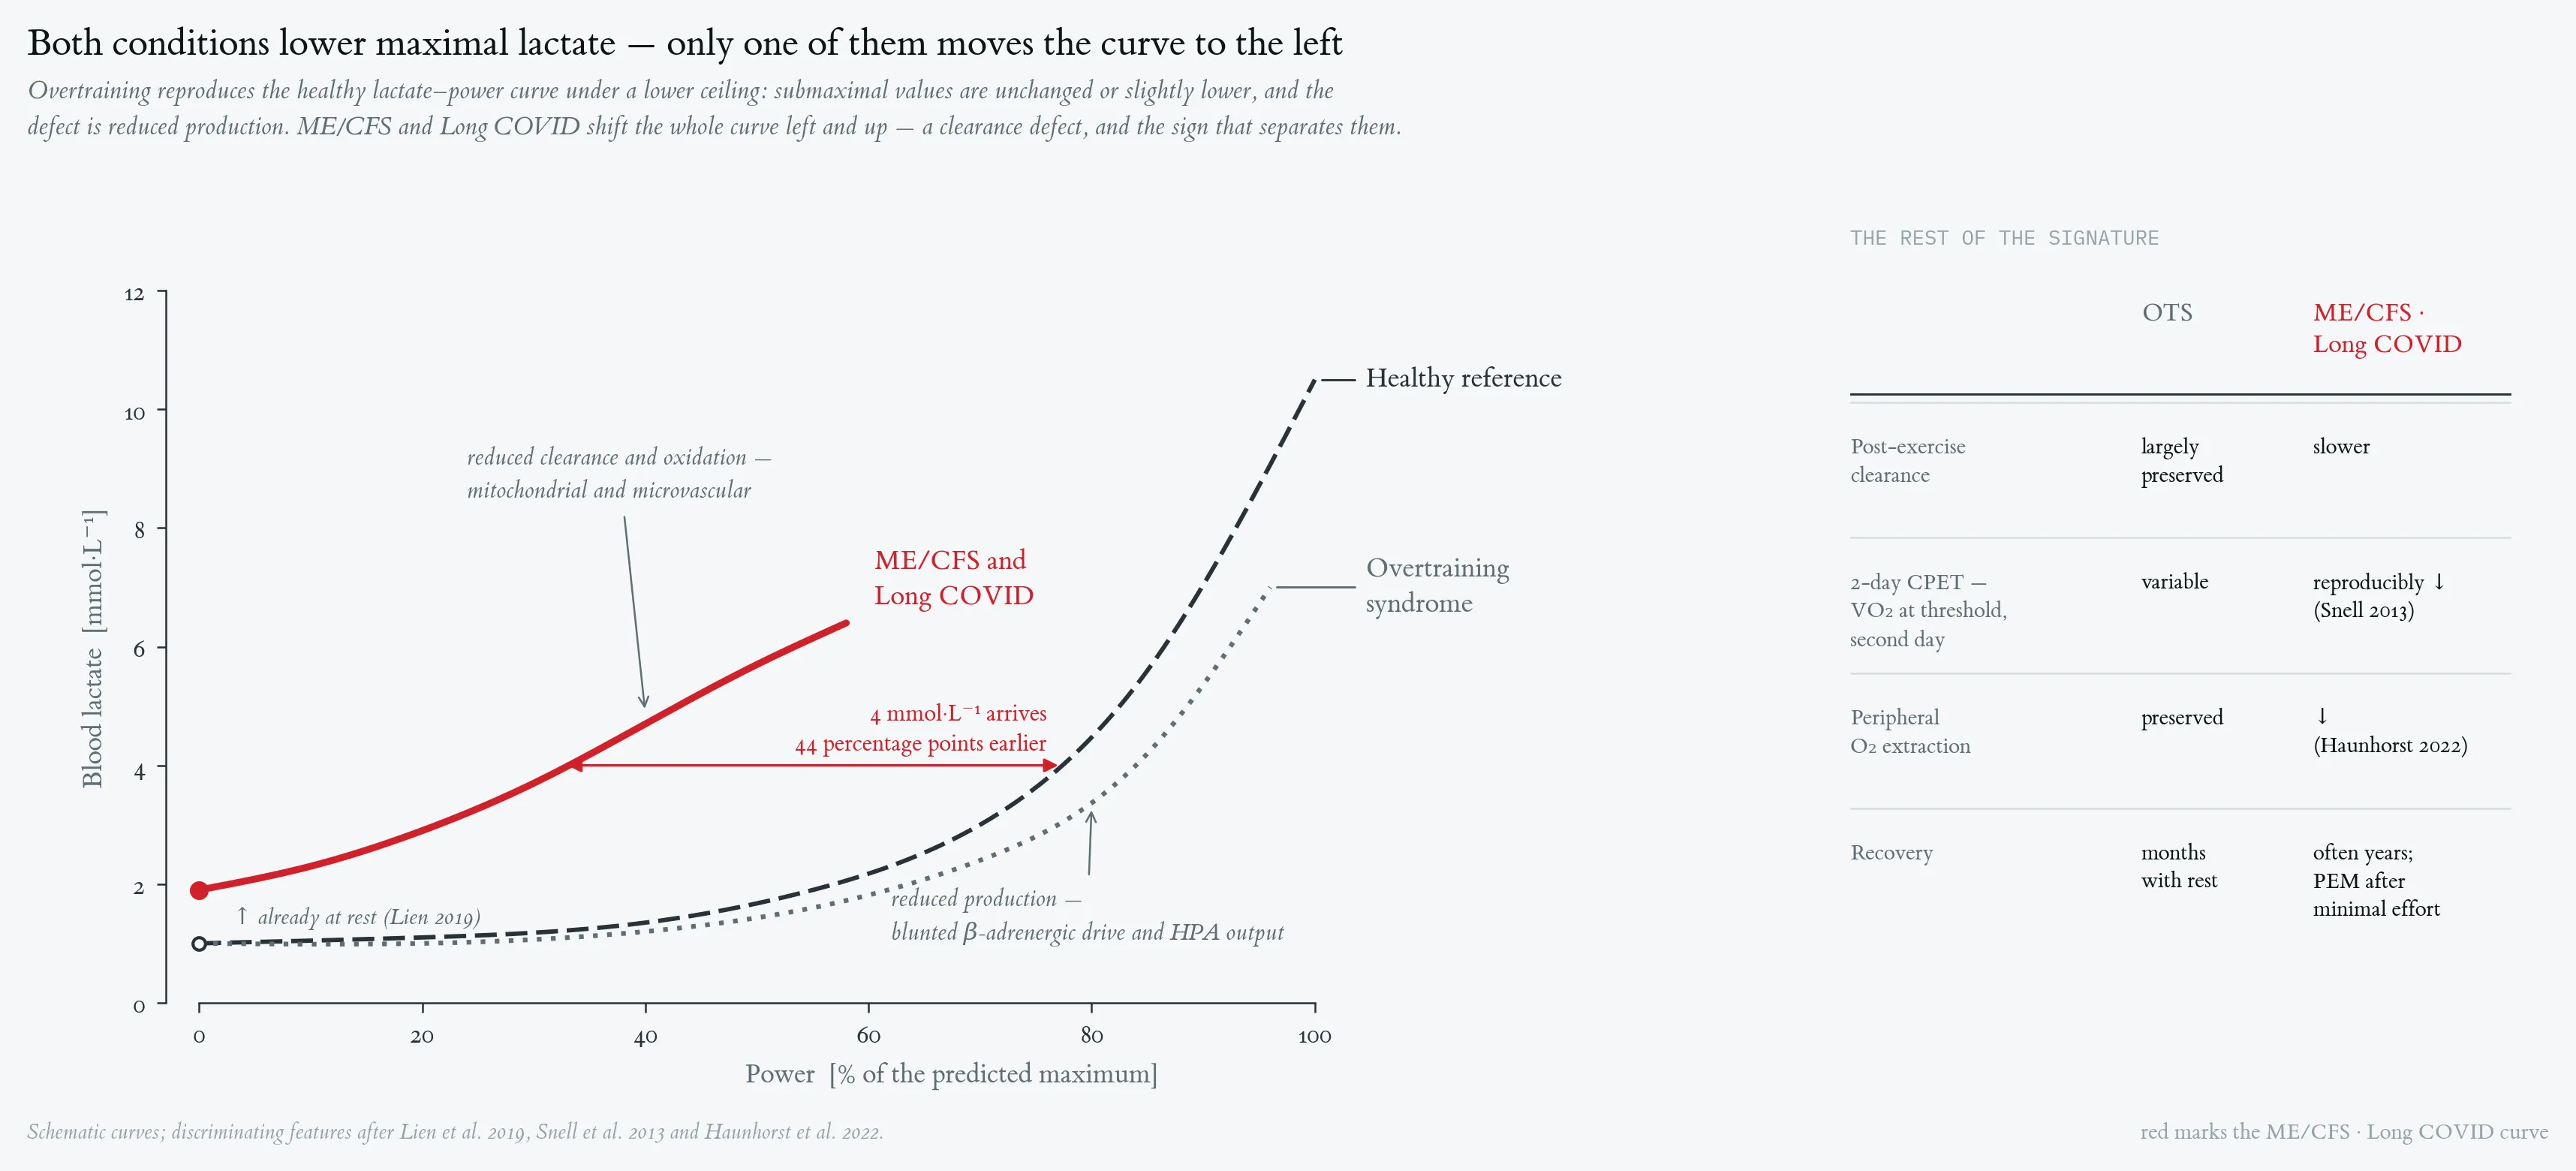
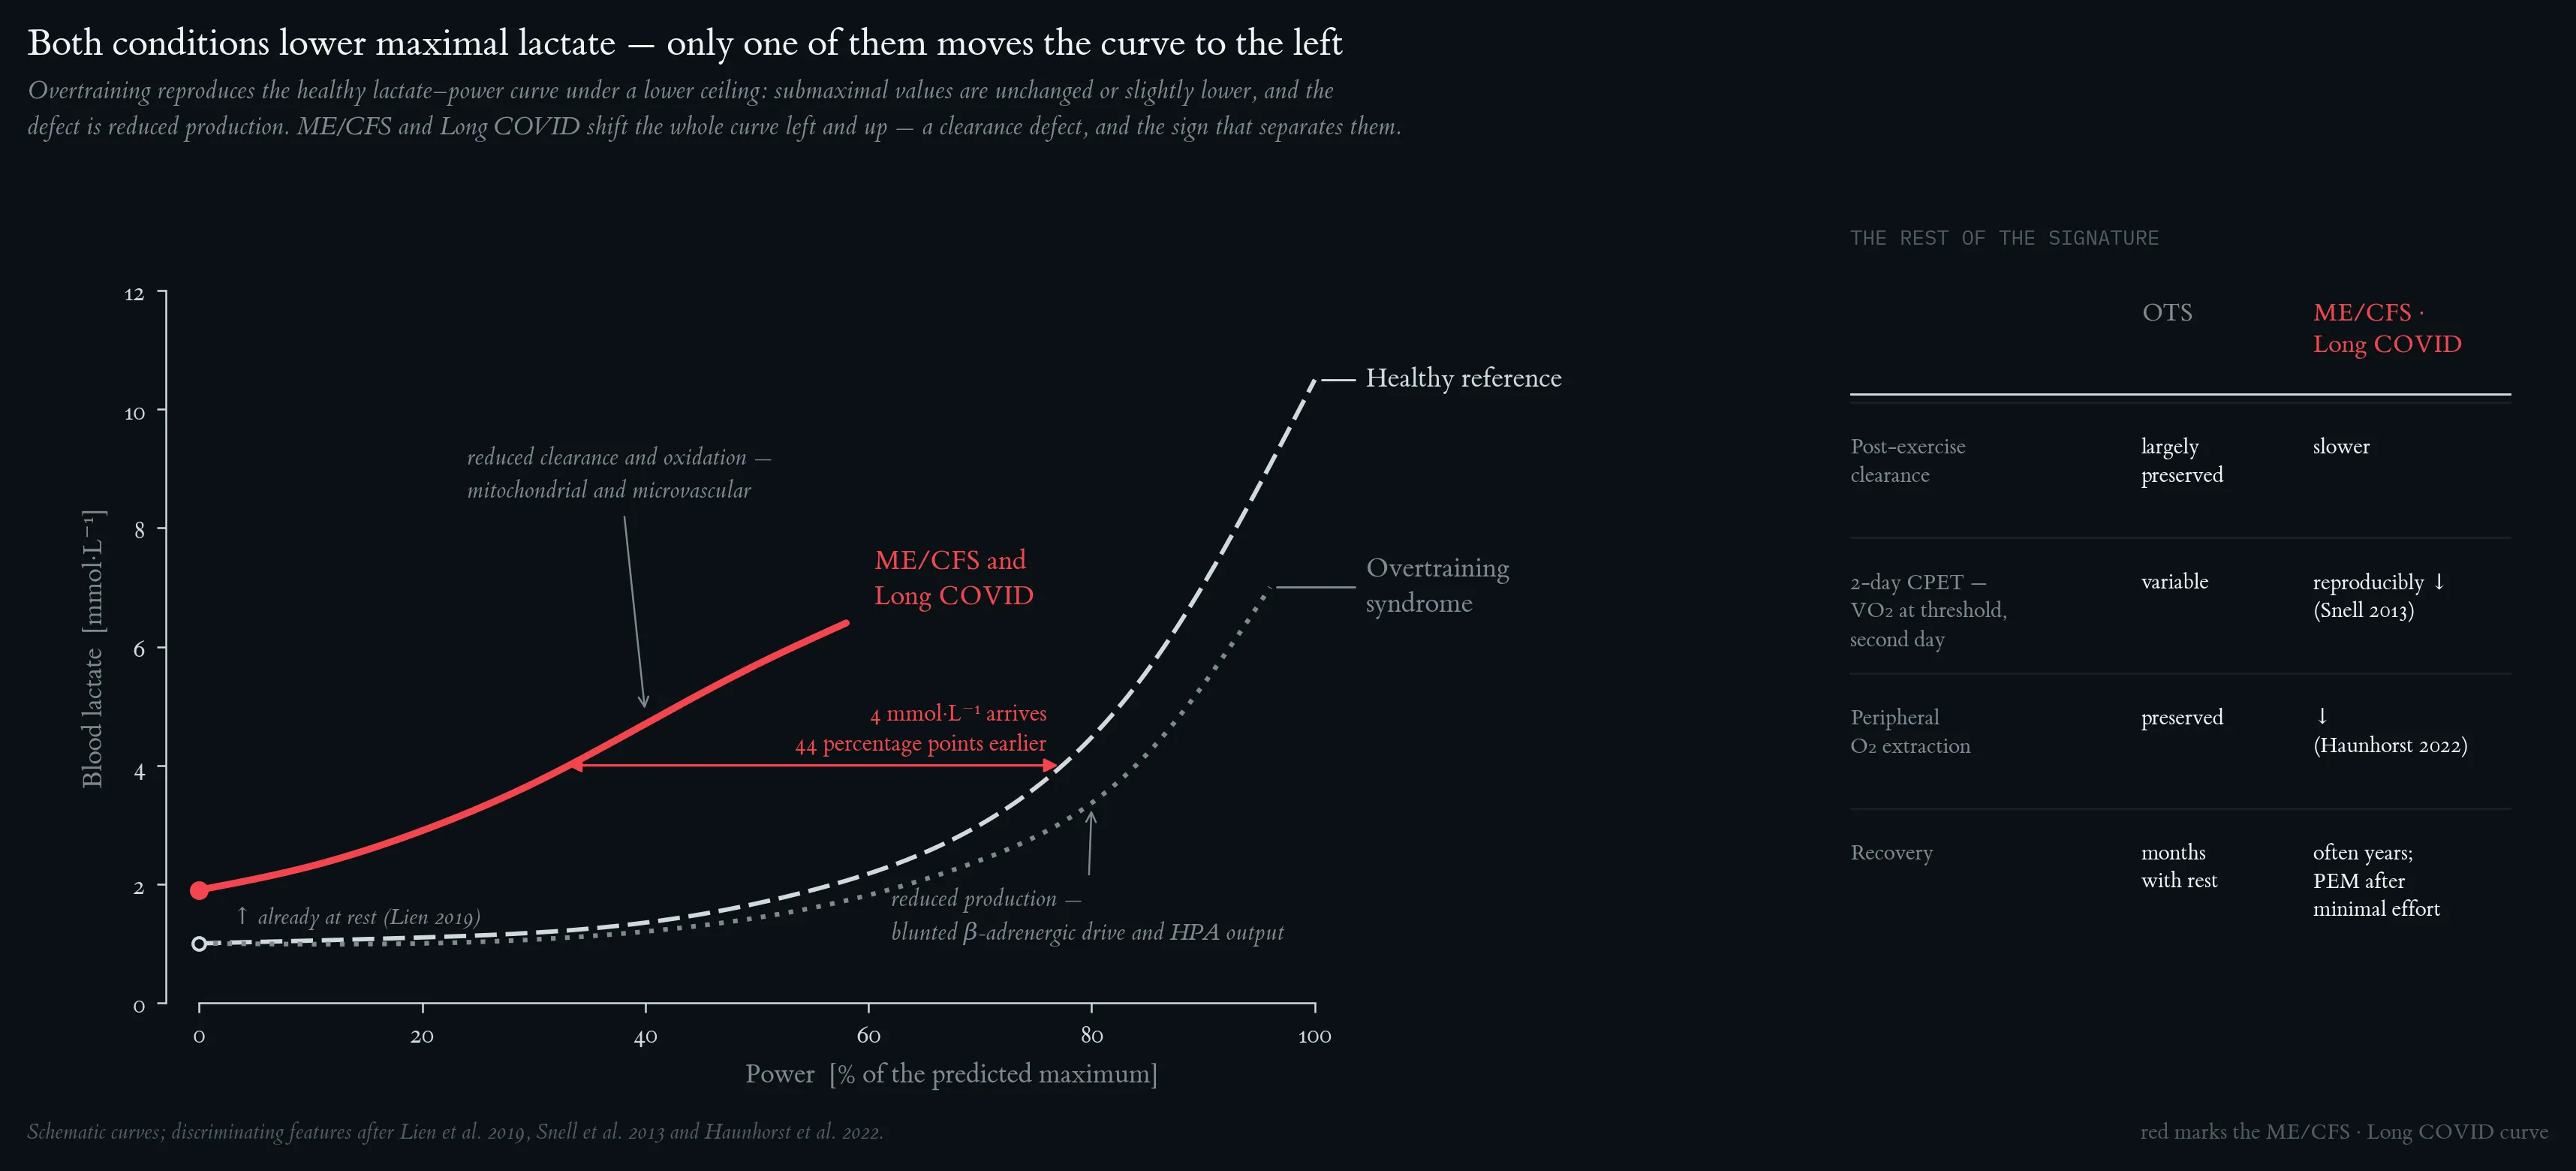
Both conditions lower maximal lactate, but only one moves the curve. Overtraining reproduces the healthy lactate–power curve under a lower ceiling — the defect is reduced production. ME/CFS and Long COVID shift the whole curve left and up, and 4 mmol·L⁻¹ arrives 44 percentage points earlier — a clearance defect. Schematic curves; discriminating features after Lien et al. (2019), Snell et al. (2013) and Haunhorst et al. (2022).
Lecture 7: Upper Respiratory Tract Infections and Physical Activity
The curve follows the shape described in Nieman & Wentz (2019): URTI risk is reduced ~40–50% in the moderate exercise zone compared to sedentary individuals, then rises sharply with heavy exertion to 2–6× above normal — matching the values cited in the paper for post-race illness incidence.
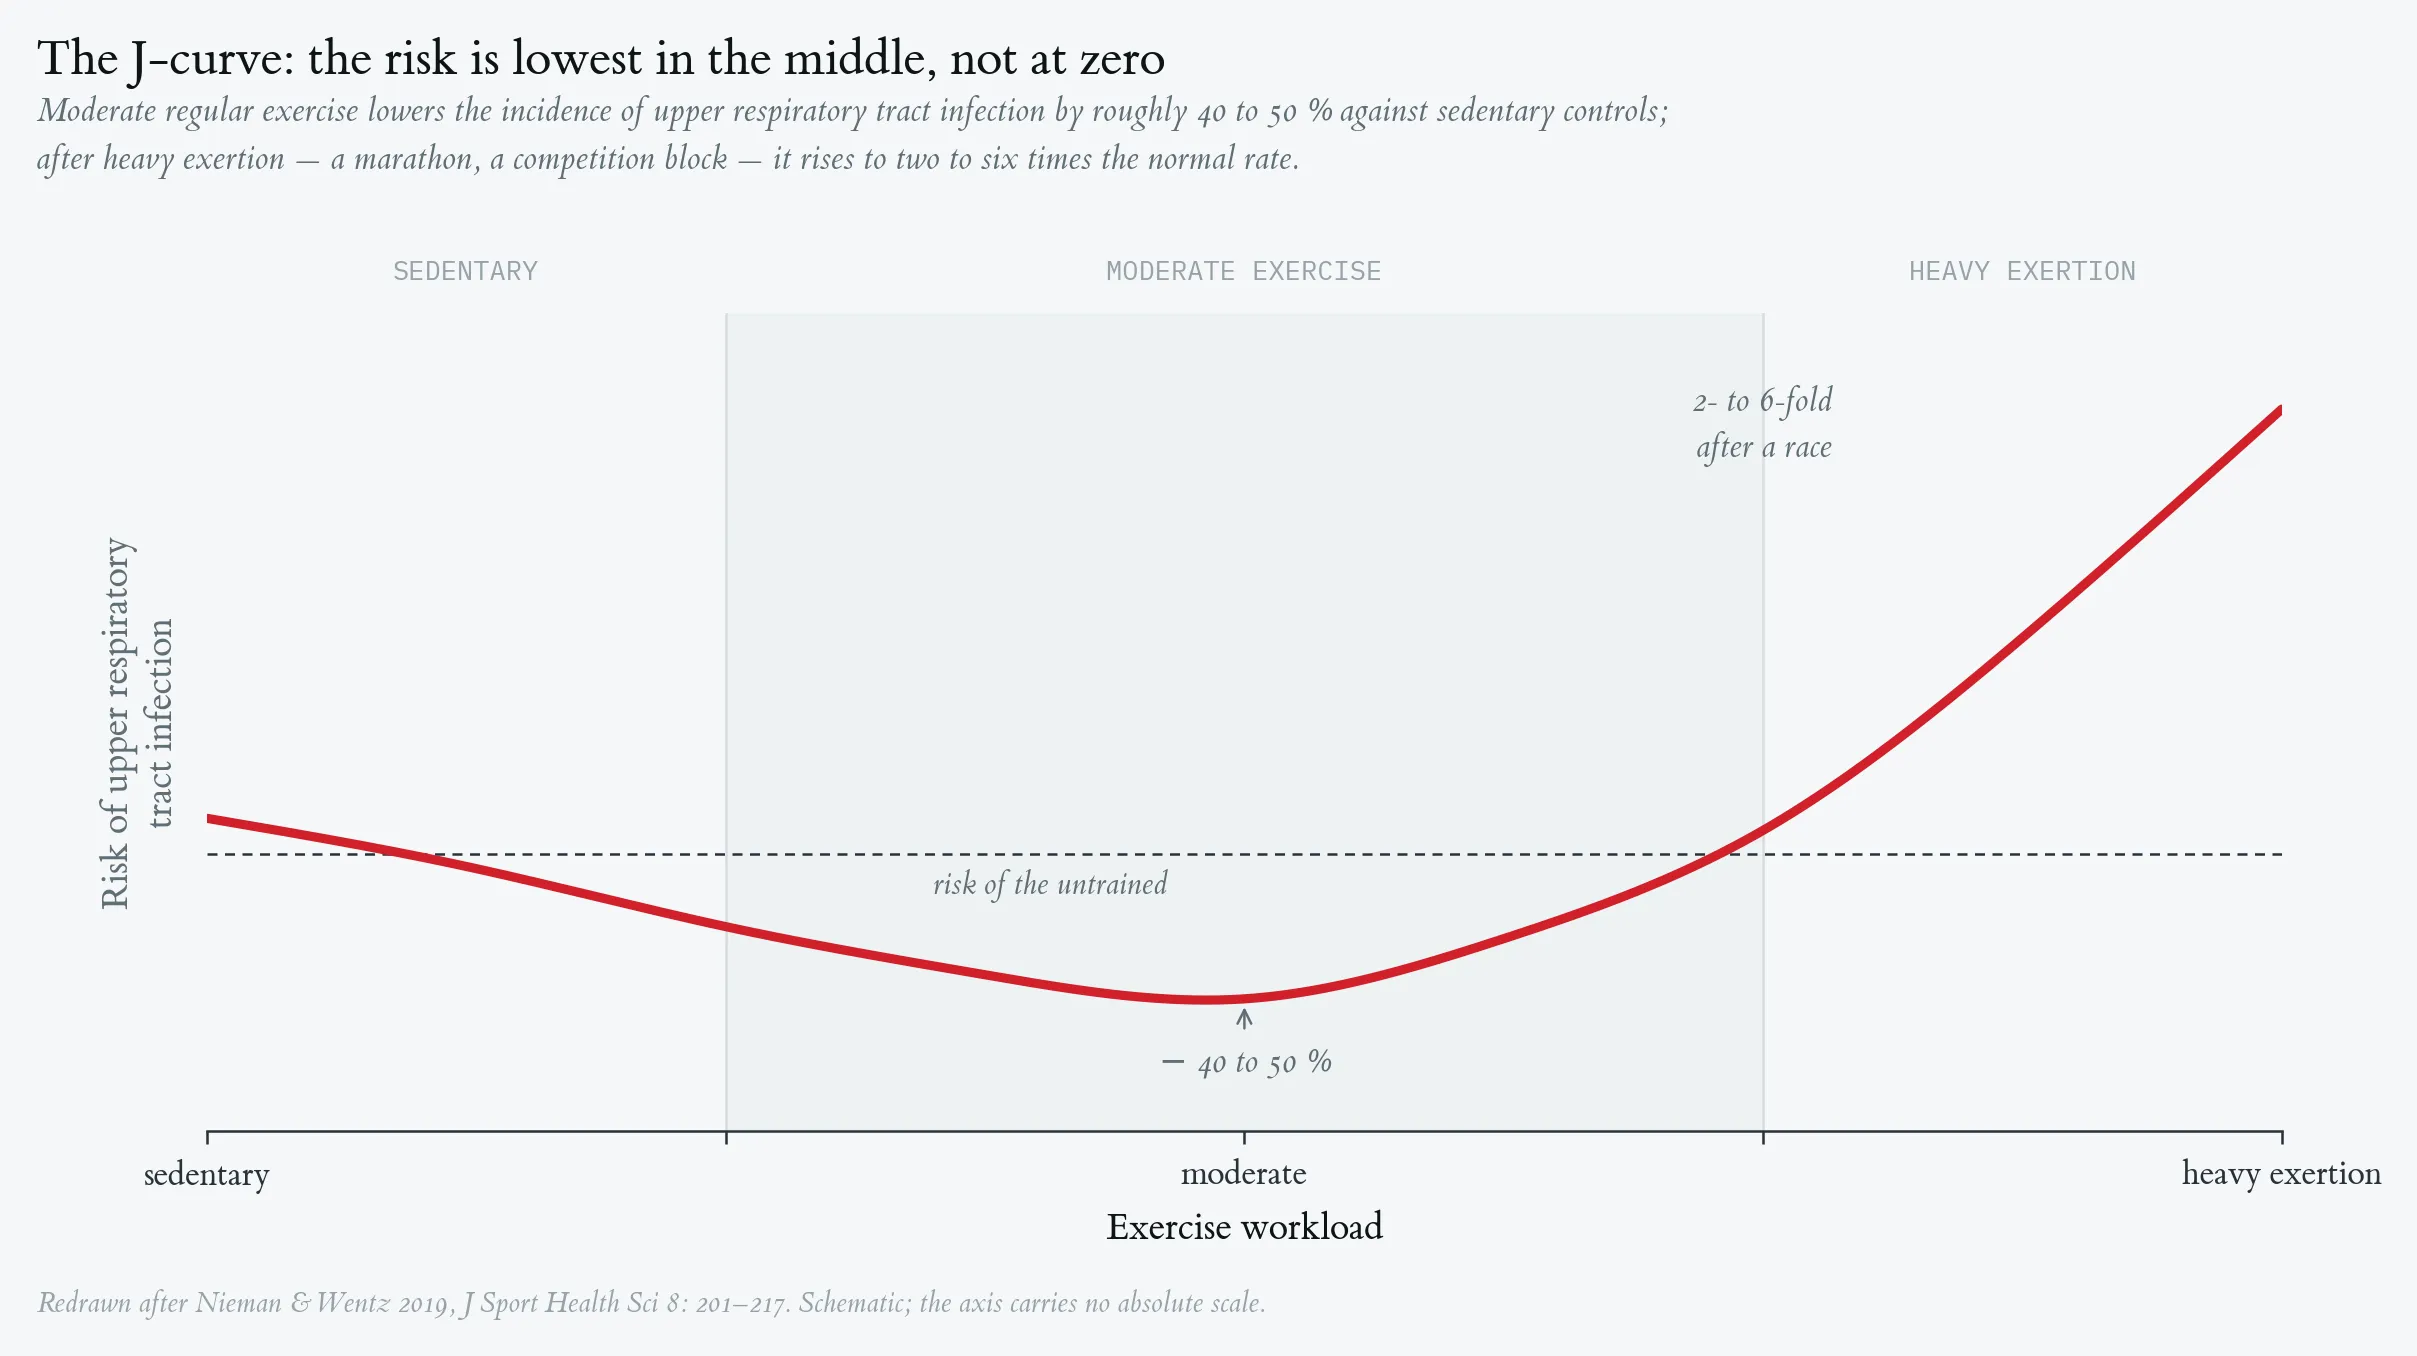
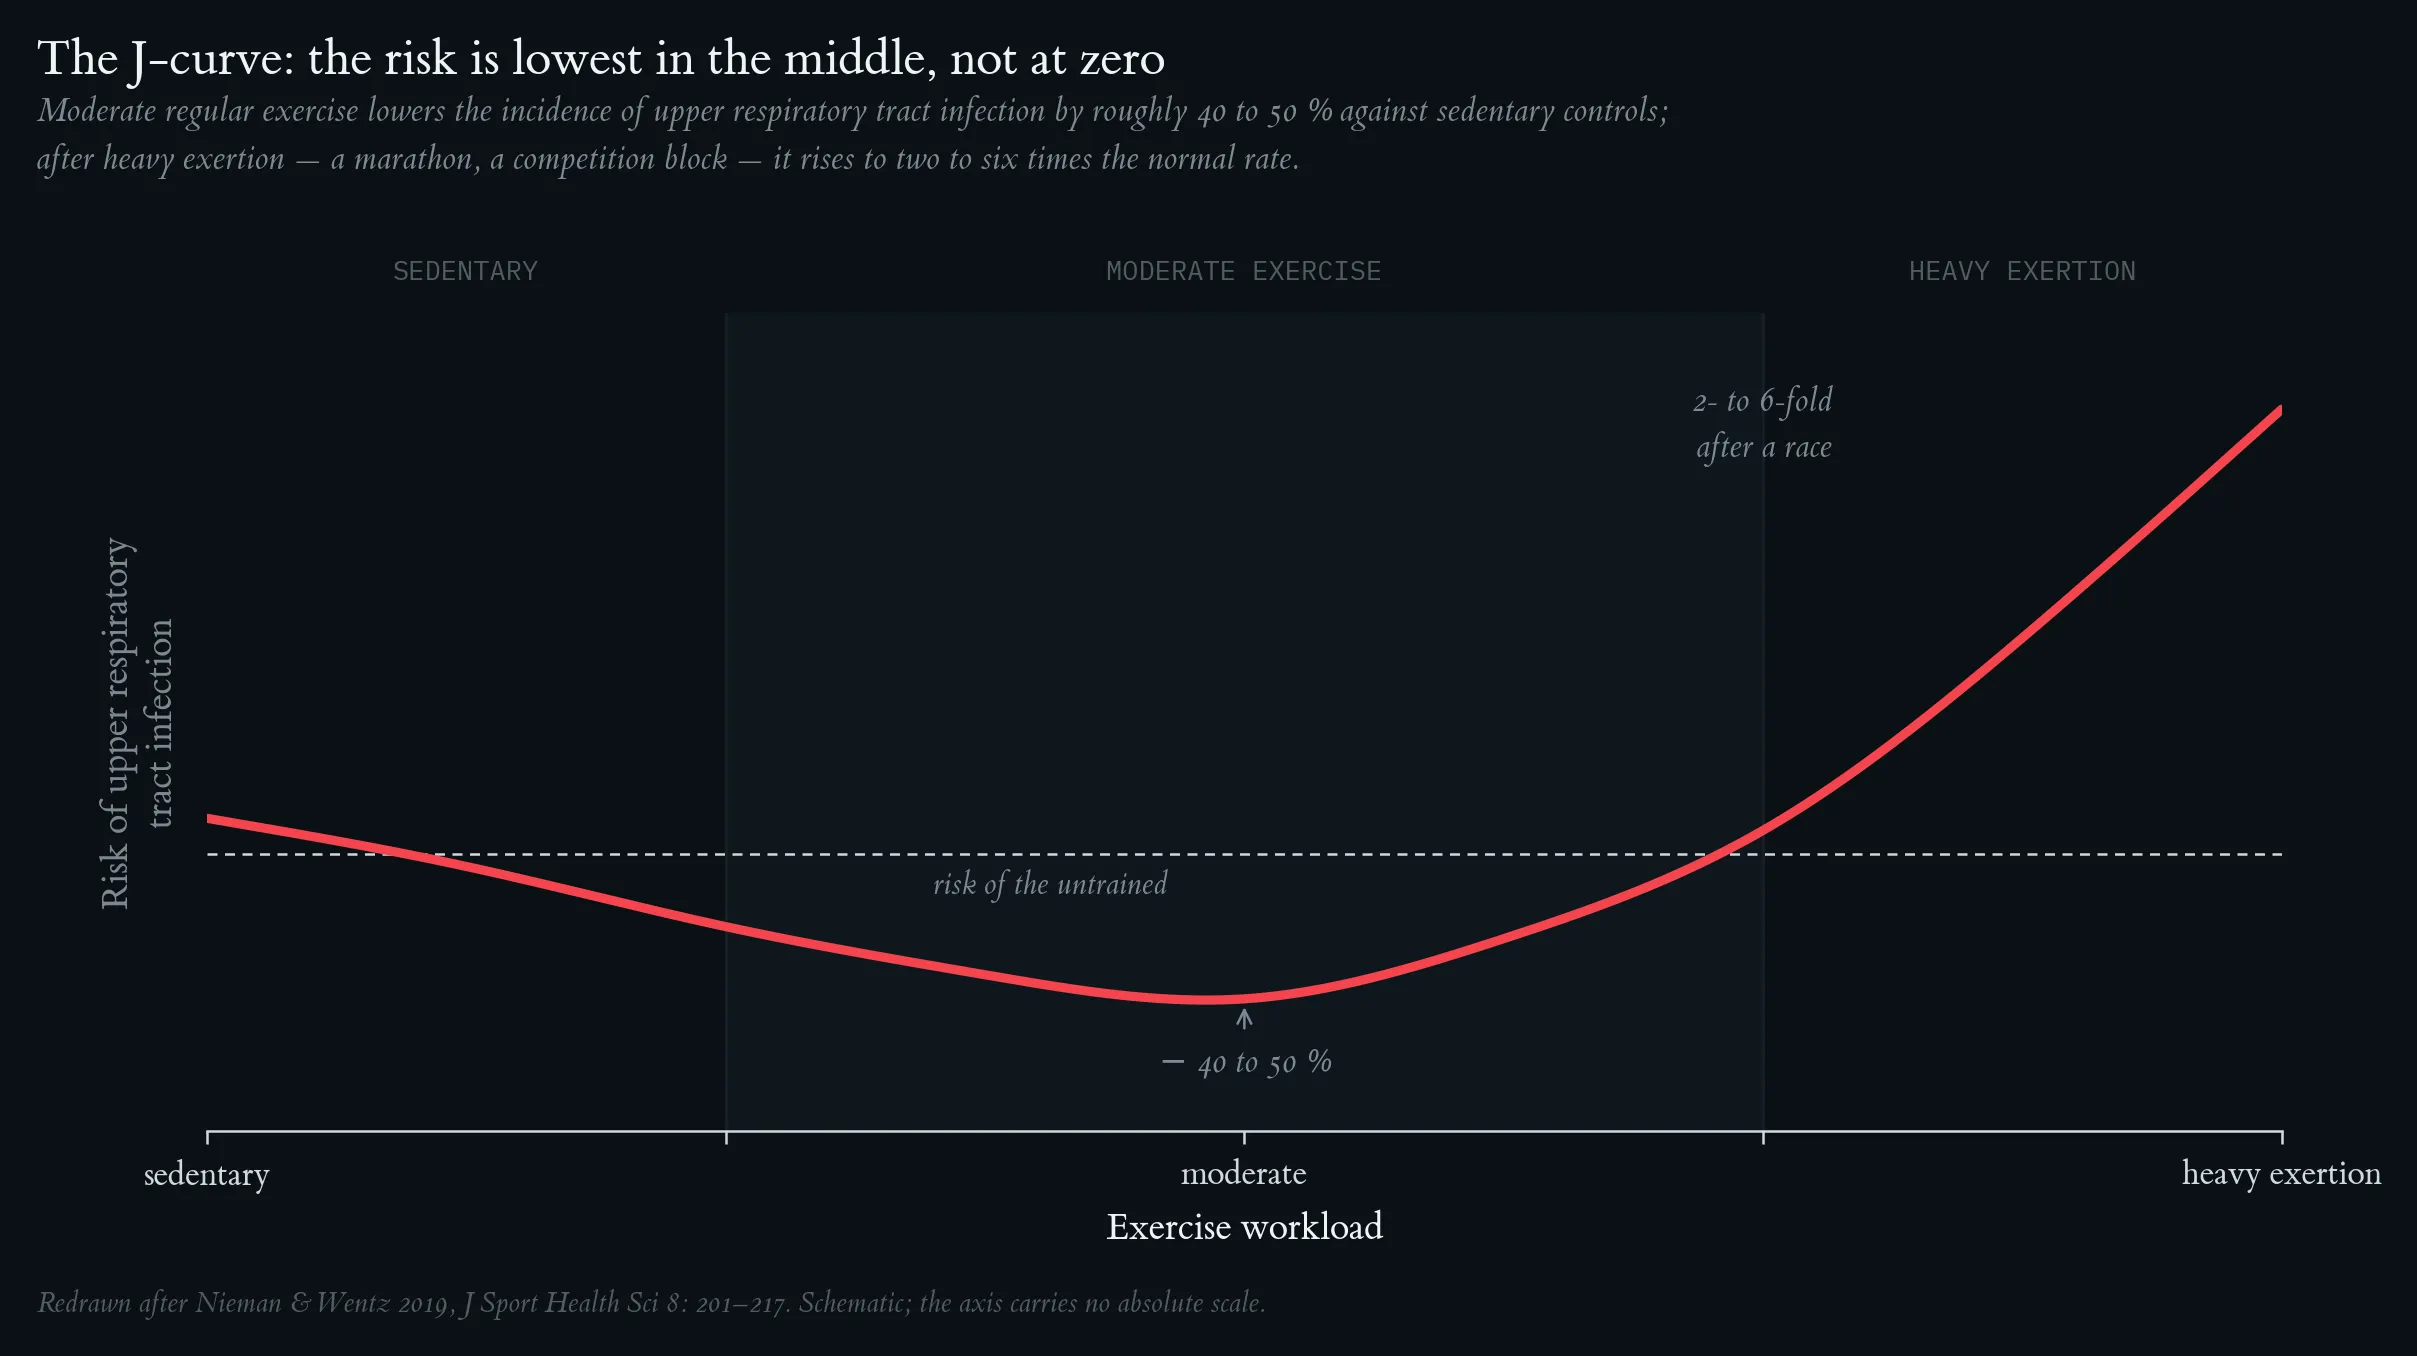
The curve follows the shape described in Nieman & Wentz (2019): URTI risk is reduced ~40–50% in the moderate exercise zone compared to sedentary individuals, then rises sharply with heavy exertion to 2–6× above normal — matching the values cited in the paper for post-race illness incidence.
Lecture 9: Standardised Evaluation of Symptoms and Signs of Exercise-Induced and Infection-Based Immunological Stress Regulation
The same eight signs, ordered by the distance they put between the two causes — the length of each line is its discriminating power. Fever decides the question without a laboratory, CRP separates almost as sharply but needs a blood sample, and muscle soreness, performance loss and heart rate hardly separate the two at all. Positions are a clinical judgement of typical deviation, not measurements.
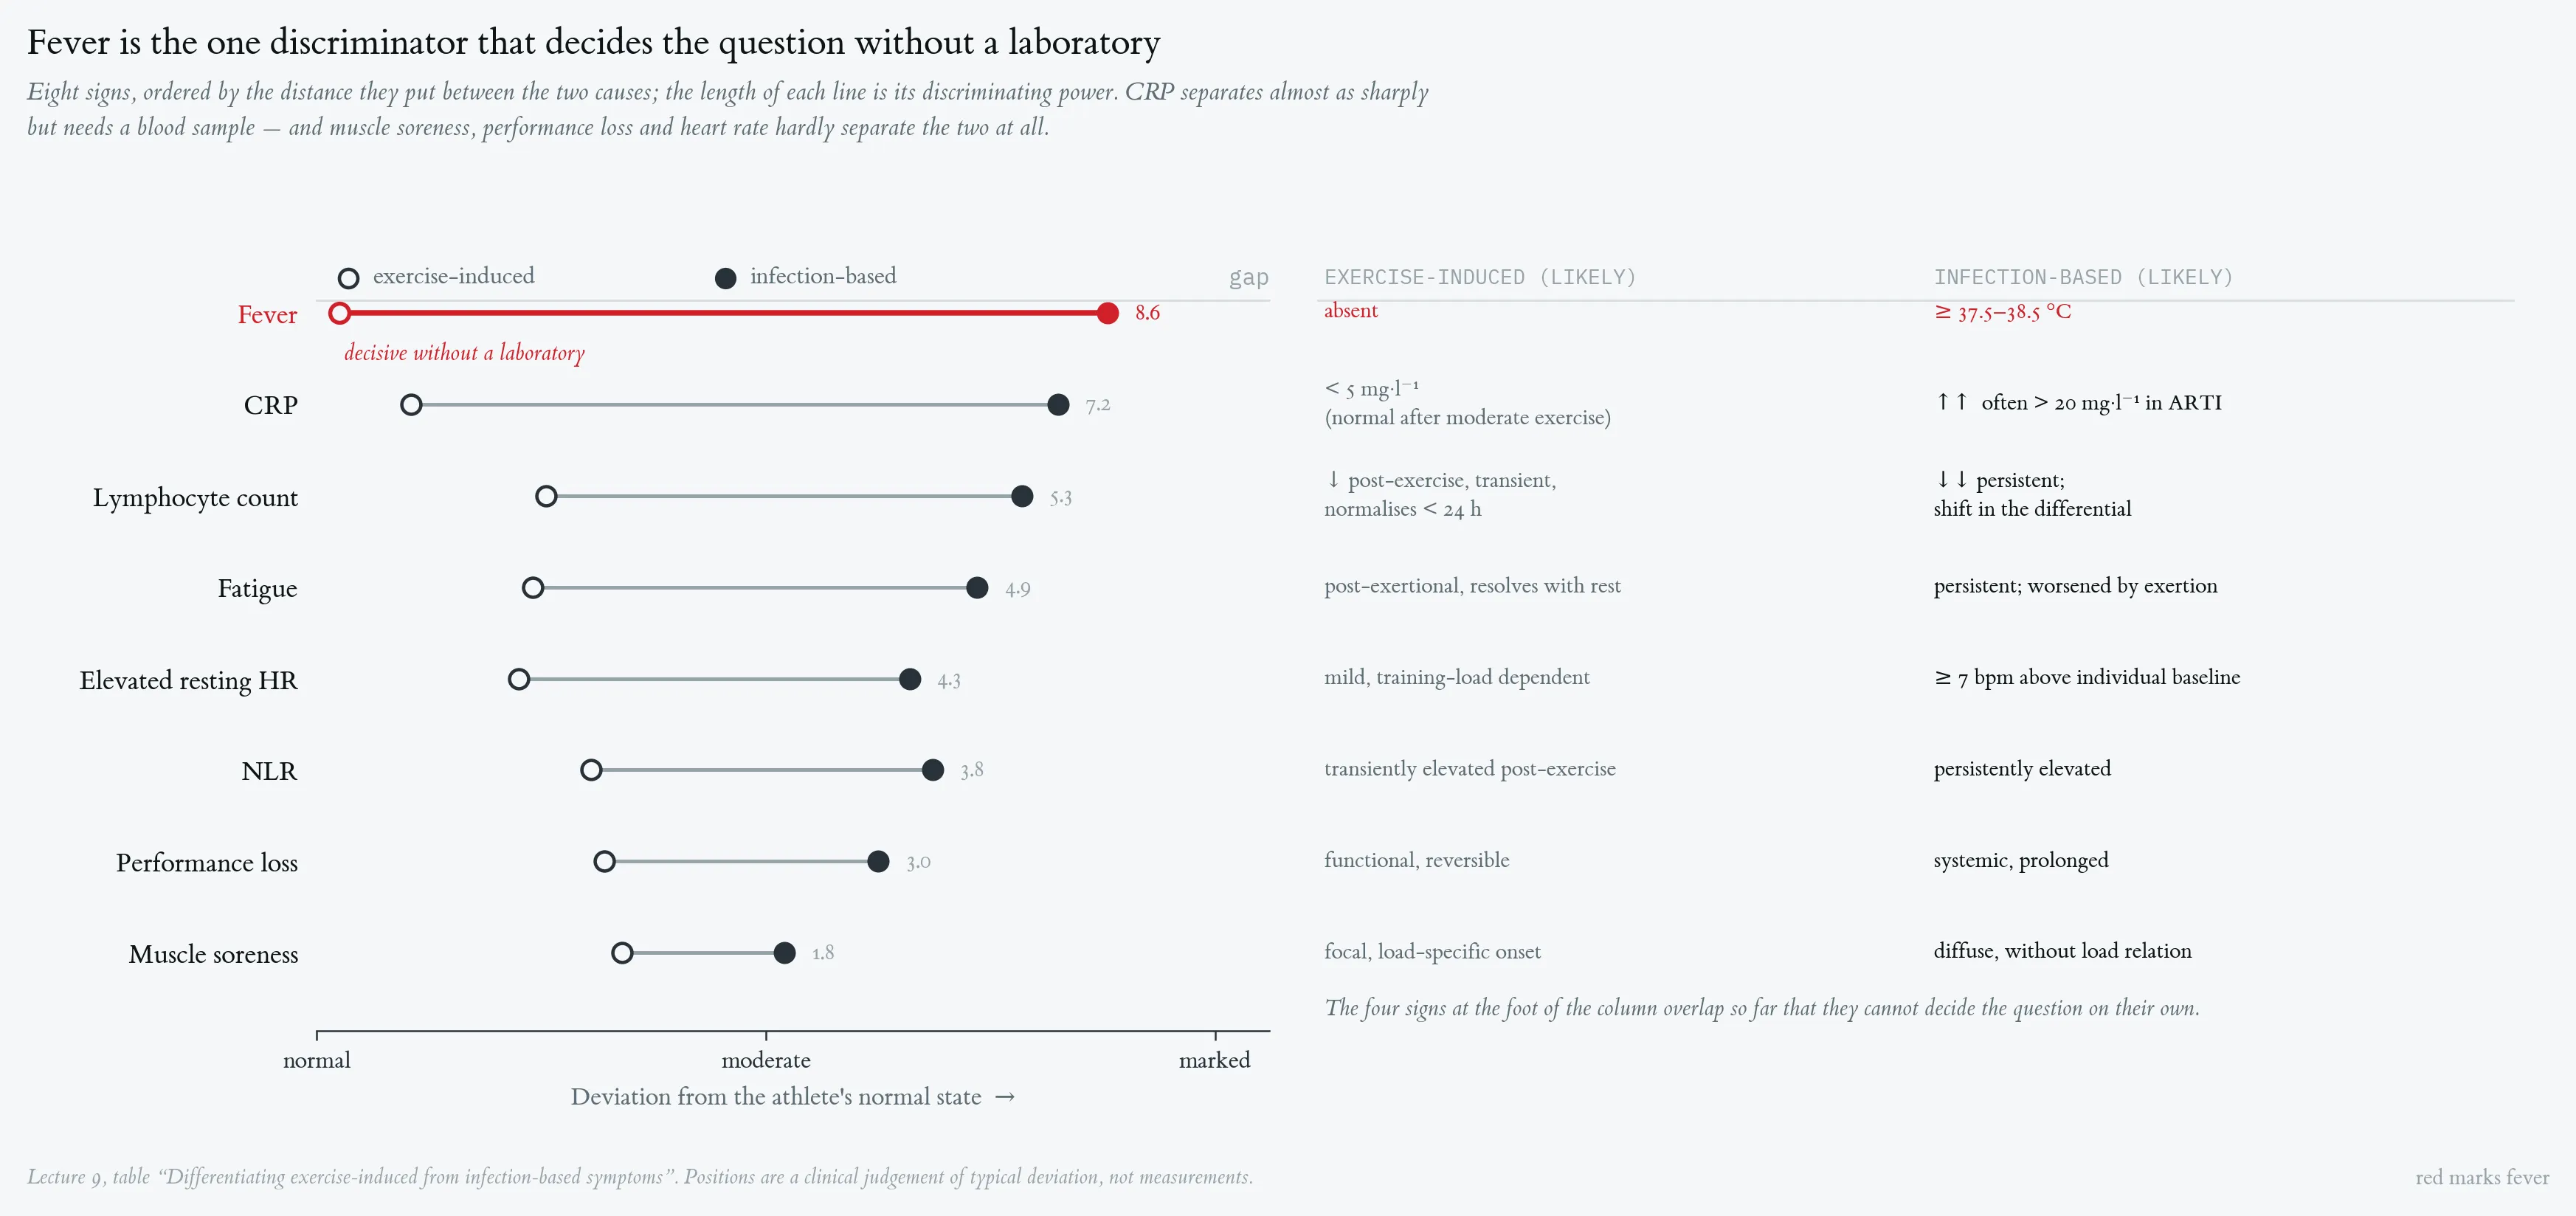

The same eight signs, ordered by the distance they put between the two causes — the length of each line is its discriminating power. Fever decides the question without a laboratory, CRP separates almost as sharply but needs a blood sample, and muscle soreness, performance loss and heart rate hardly separate the two at all. Positions are a clinical judgement of typical deviation, not measurements.
Every acute presentation runs through the same two gates. Fever or any symptom below the neck ends the session; only symptoms above the neck, without systemic signs, permit reduced training under observation, and even then a 48-hour review has to confirm it. Outlined boxes are decisions, filled boxes actions.
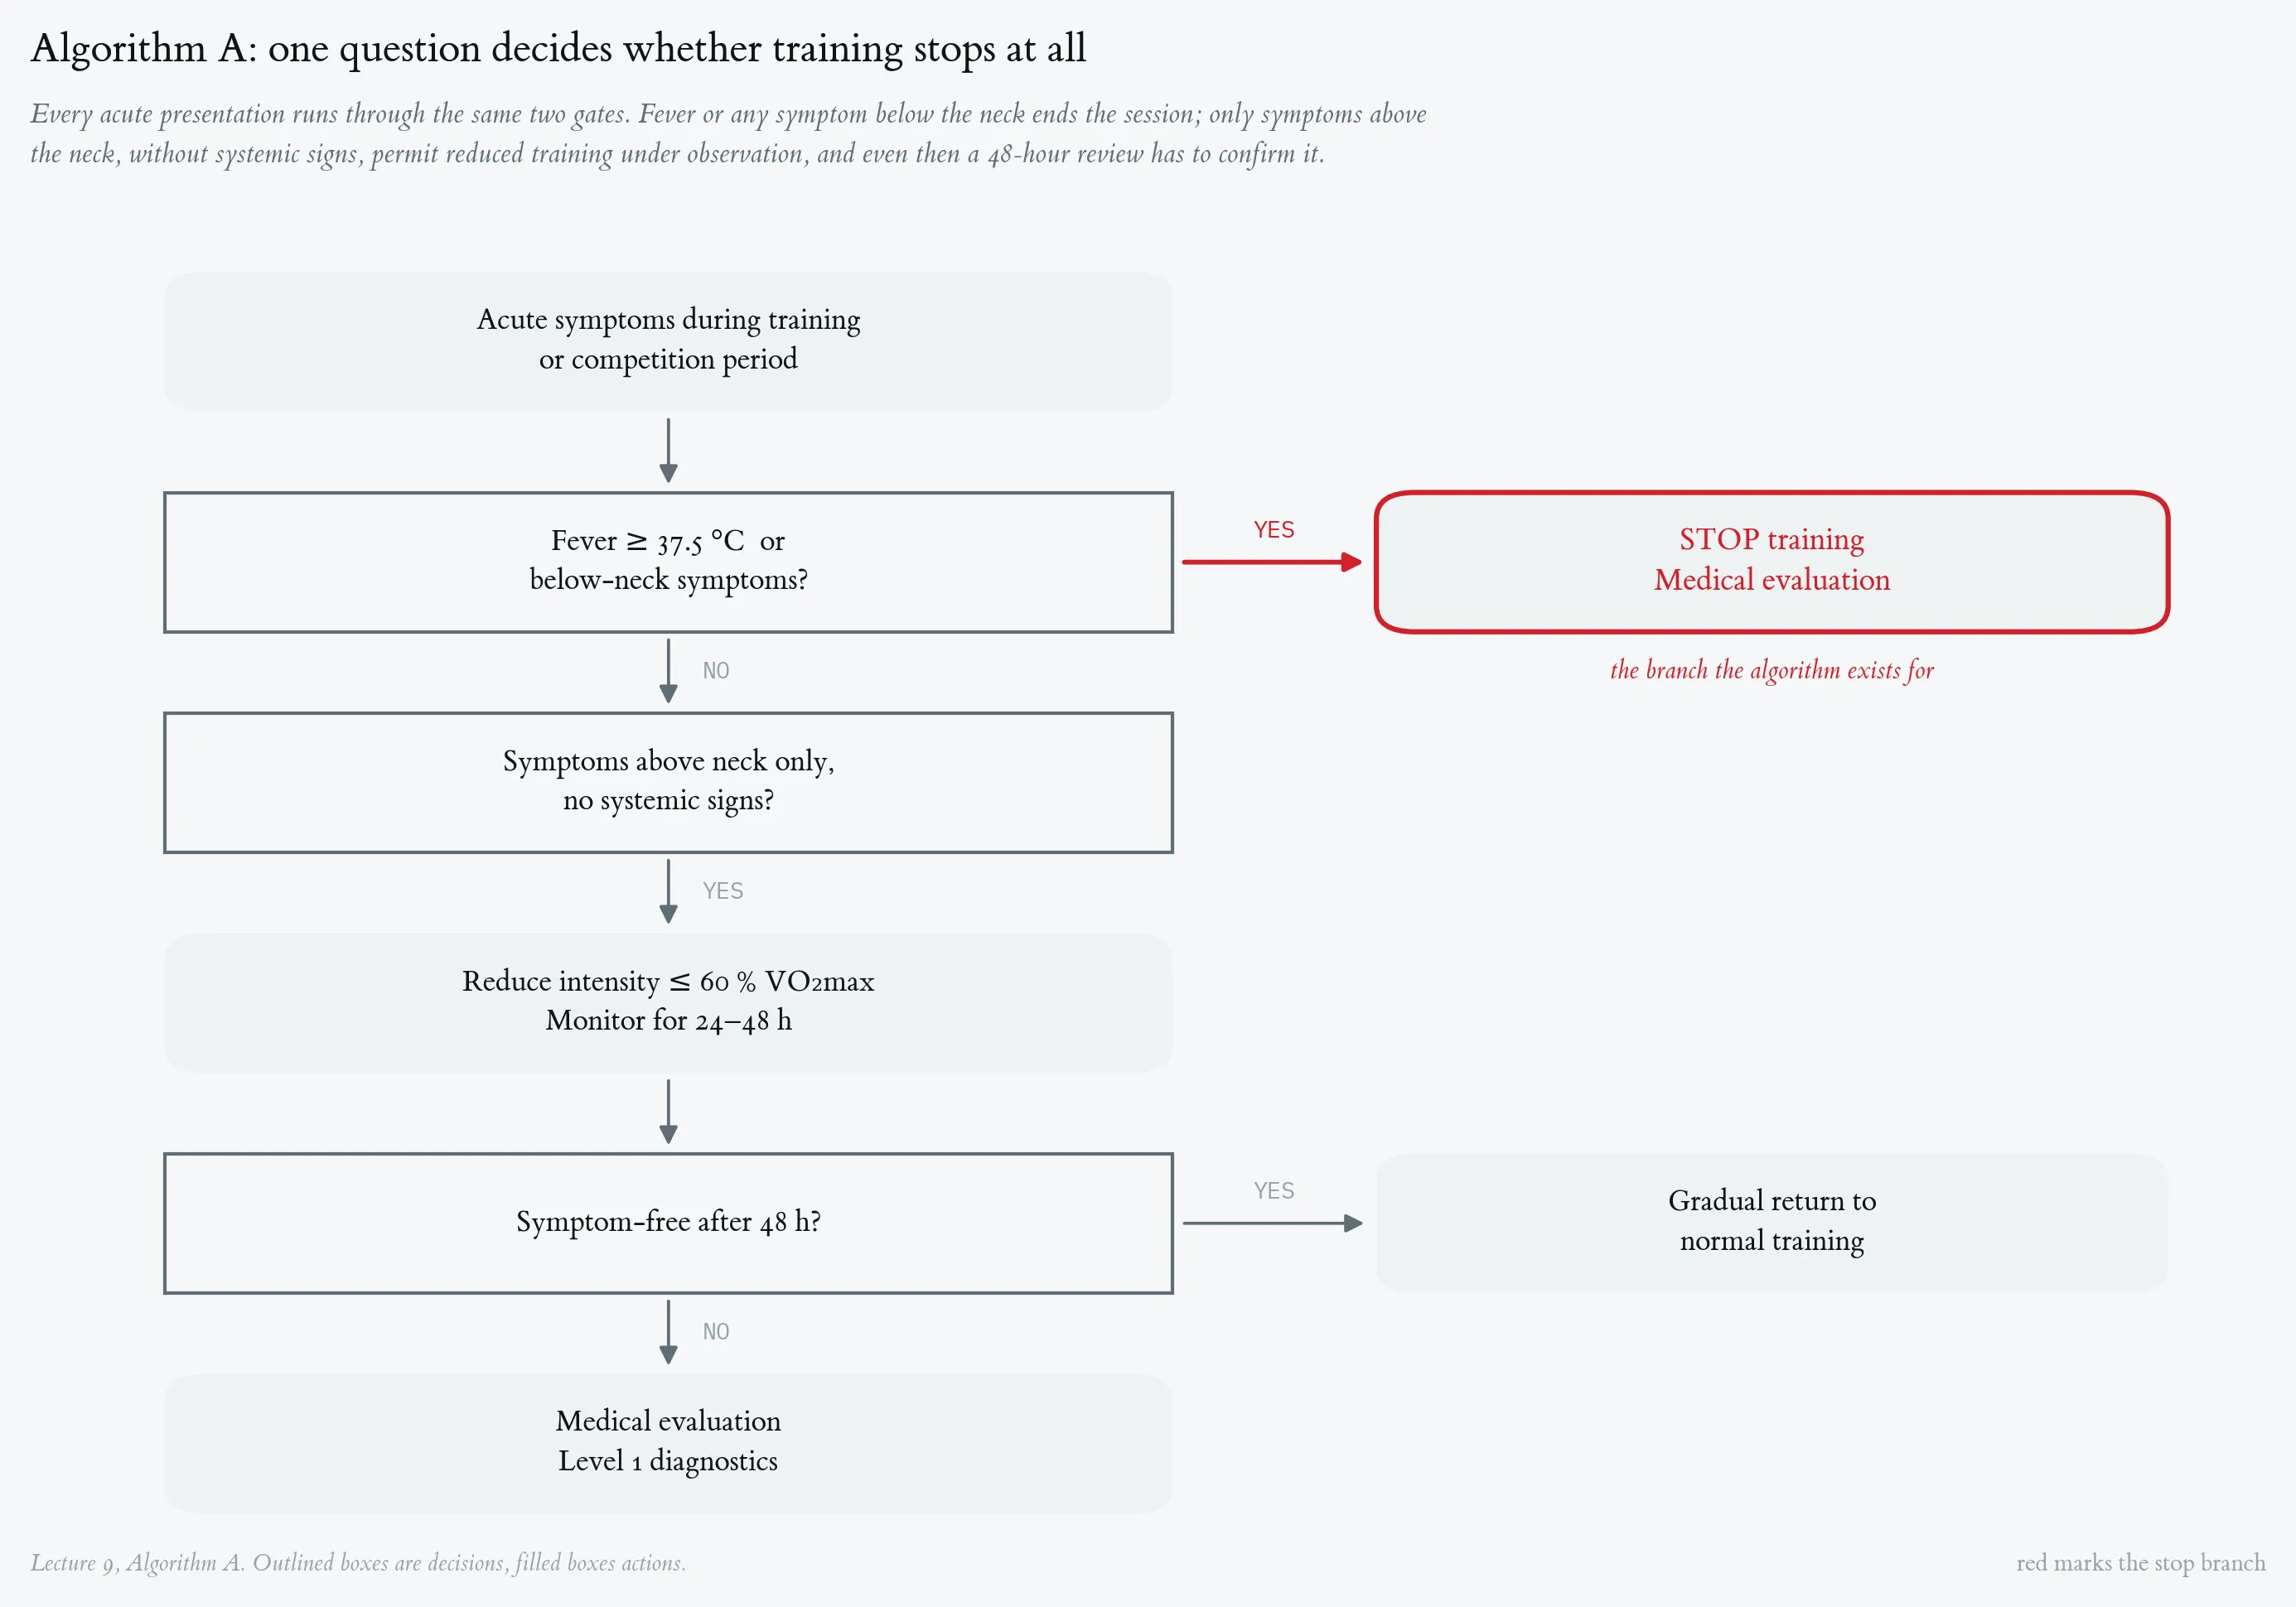
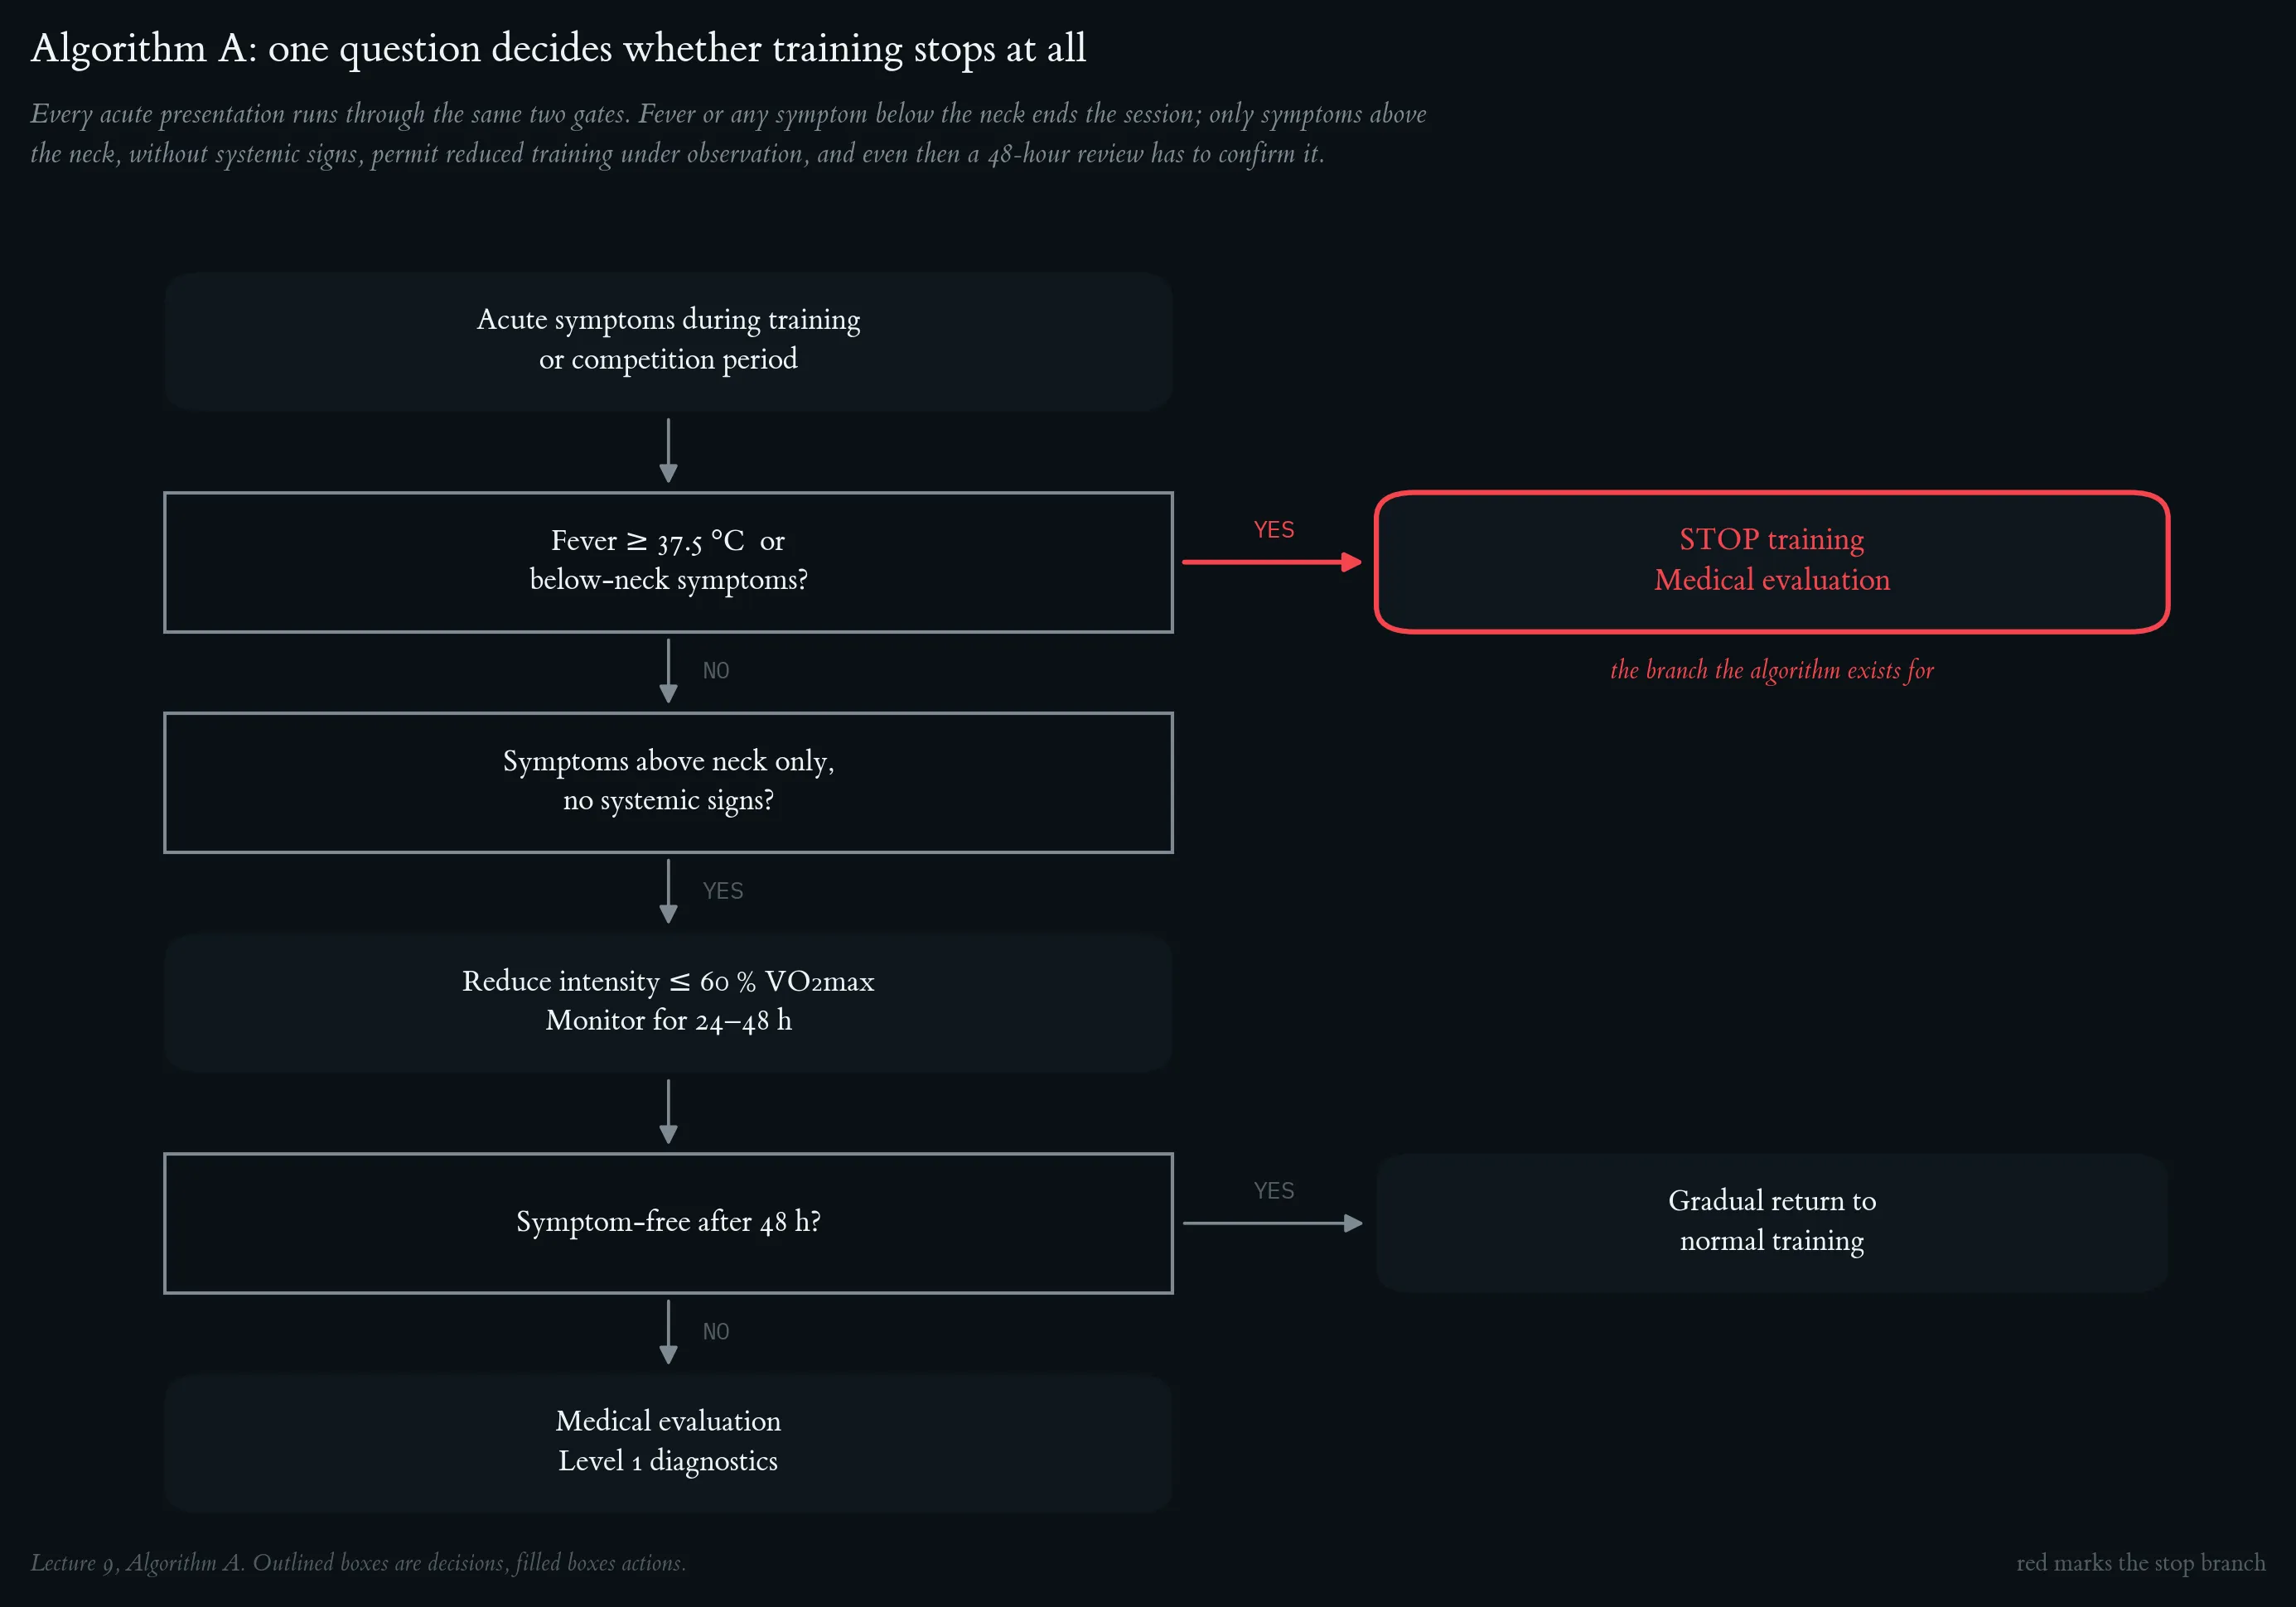
Every acute presentation runs through the same two gates. Fever or any symptom below the neck ends the session; only symptoms above the neck, without systemic signs, permit reduced training under observation, and even then a 48-hour review has to confirm it. Outlined boxes are decisions, filled boxes actions.
Lecture 10: Infection-Associated Chronic Illness and Wearable Data
From Ledebur et al. (2025): https://www.nature.com/articles/s41746-025-01456-x/figures/3. Wearable data analysis of the match cohort. Z-transformed mean RHR (average of all 15-min RHR measurements within the last seven days) relative to the seasonal mean RHR with respect to the mean and standard deviation up to 7 days prior to the date of the reported test of all individuals in the M-COVID-19[+]PS (pink), M-COVID-19[+]NS (blue) and M-COVID-19[−] (black) cohorts. The difference between the maximum and minimum z-transformed RHR within 14 to and 20 days after the date of the reported SARS-CoV-2 test was more pronounced (1.3 vs 1.0) and more prolonged for M-COVID-19[+]PS than for M-COVID-19[+]NS. Shading indicates standard errors. The inset shows the average RHR relative to the SARS-CoV-2 test date. Already prior to the SARS-CoV-2 test, M-COVID-19[+]PS-individuals showed an increased RHR compared to M-COVID-19[+]NS and M-COVID-19[−].
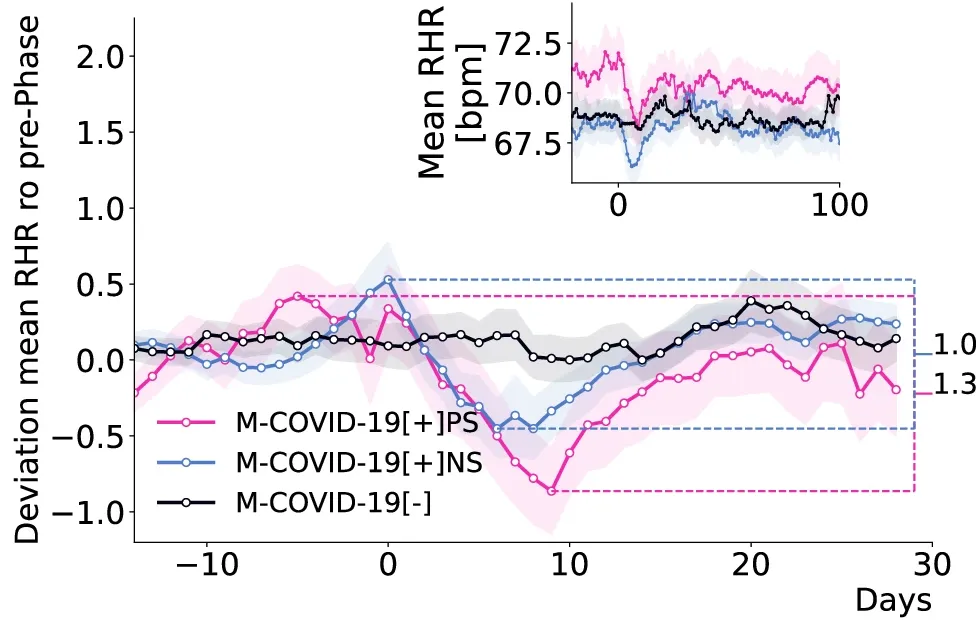
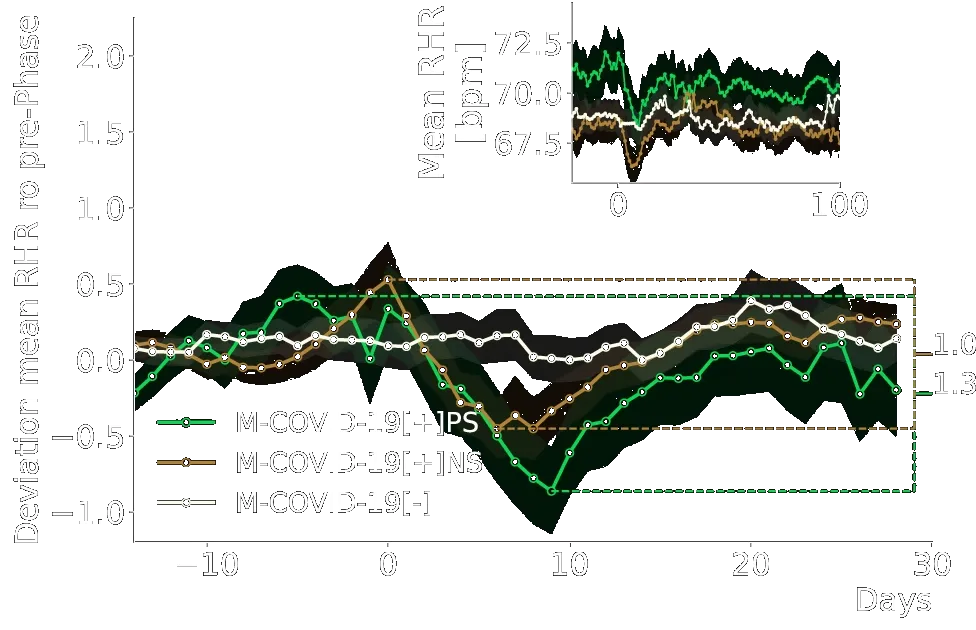
From Ledebur et al. (2025): https://www.nature.com/articles/s41746-025-01456-x/figures/3. Wearable data analysis of the match cohort. Z-transformed mean RHR (average of all 15-min RHR measurements within the last seven days) relative to the seasonal mean RHR with respect to the mean and standard deviation up to 7 days prior to the date of the reported test of all individuals in the M-COVID-19[+]PS (pink), M-COVID-19[+]NS (blue) and M-COVID-19[−] (black) cohorts. The difference between the maximum and minimum z-transformed RHR within 14 to and 20 days after the date of the reported SARS-CoV-2 test was more pronounced (1.3 vs 1.0) and more prolonged for M-COVID-19[+]PS than for M-COVID-19[+]NS. Shading indicates standard errors. The inset shows the average RHR relative to the SARS-CoV-2 test date. Already prior to the SARS-CoV-2 test, M-COVID-19[+]PS-individuals showed an increased RHR compared to M-COVID-19[+]NS and M-COVID-19[−].
Metabolic 1: Teaching Anaerobic Threshold
Schematic representation of the aerobic–anaerobic transition (grey zone). Top: blood-lactate curve with aerobic threshold (AeS) and individual anaerobic threshold (IAS ≙ MLSS). Bottom: pulmonary ventilation with the two ventilatory thresholds VT1 and VT2 (RCP). Redrawn after Kindermann (2004).
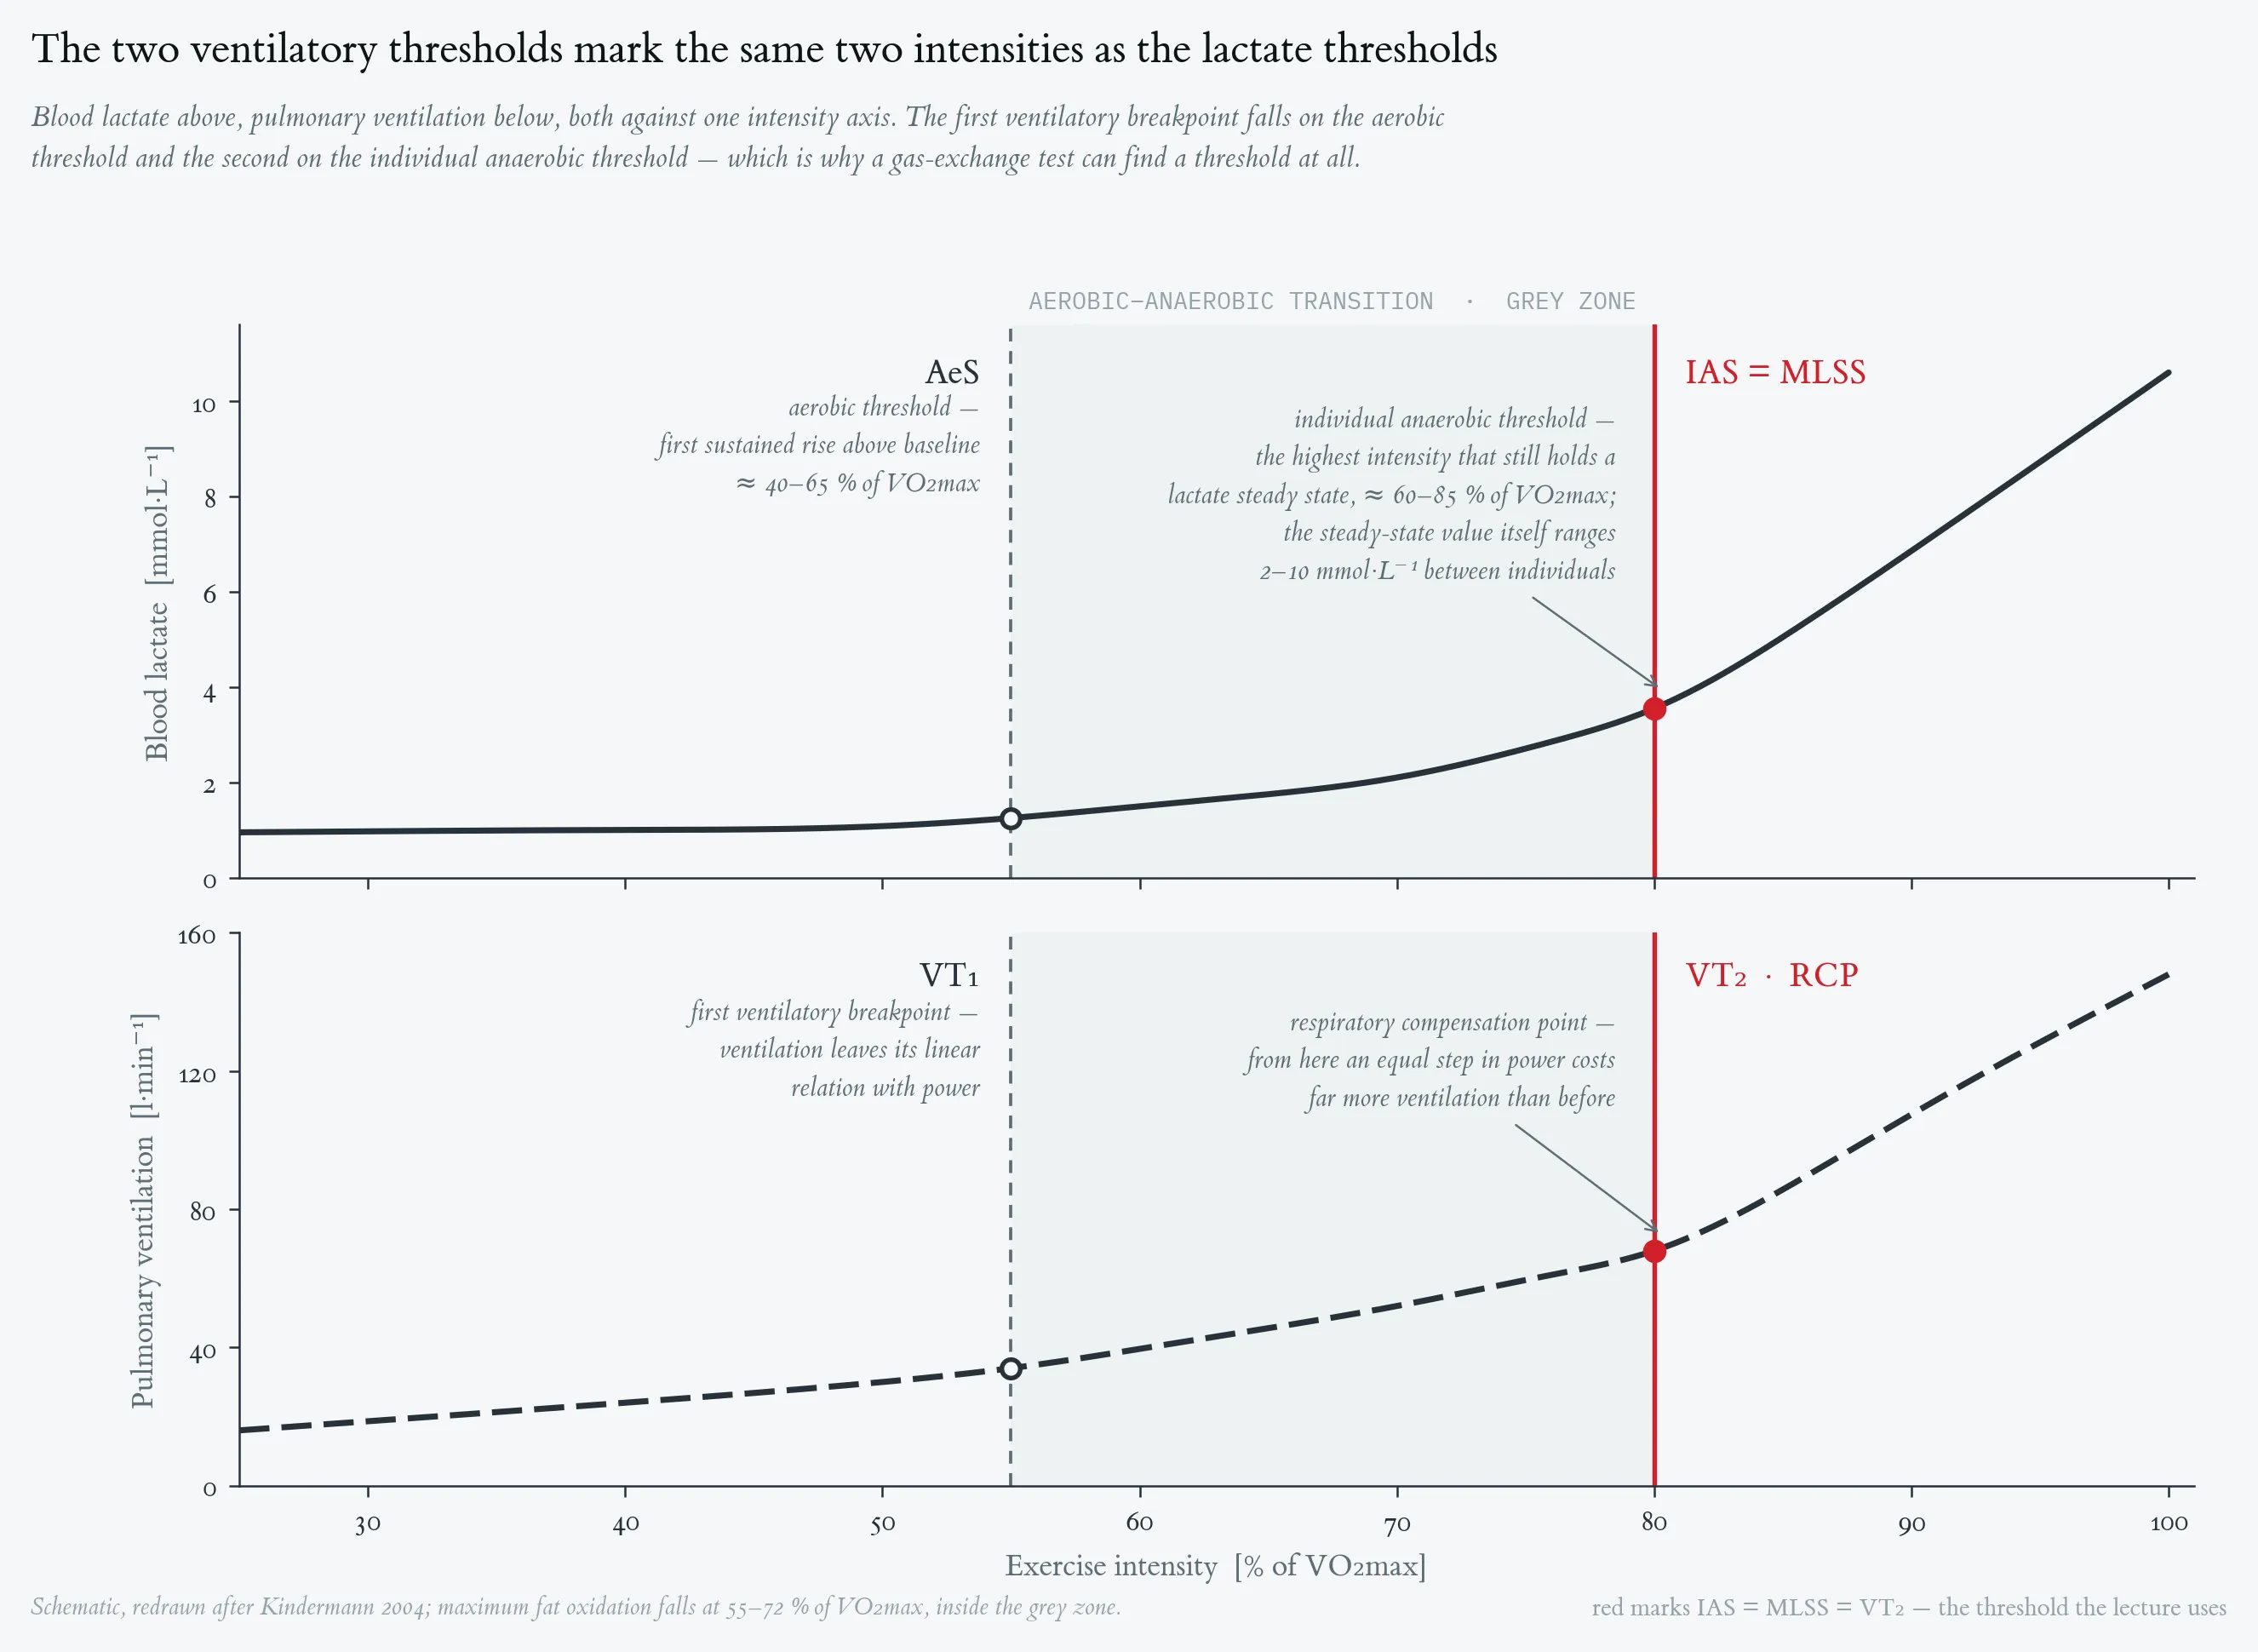
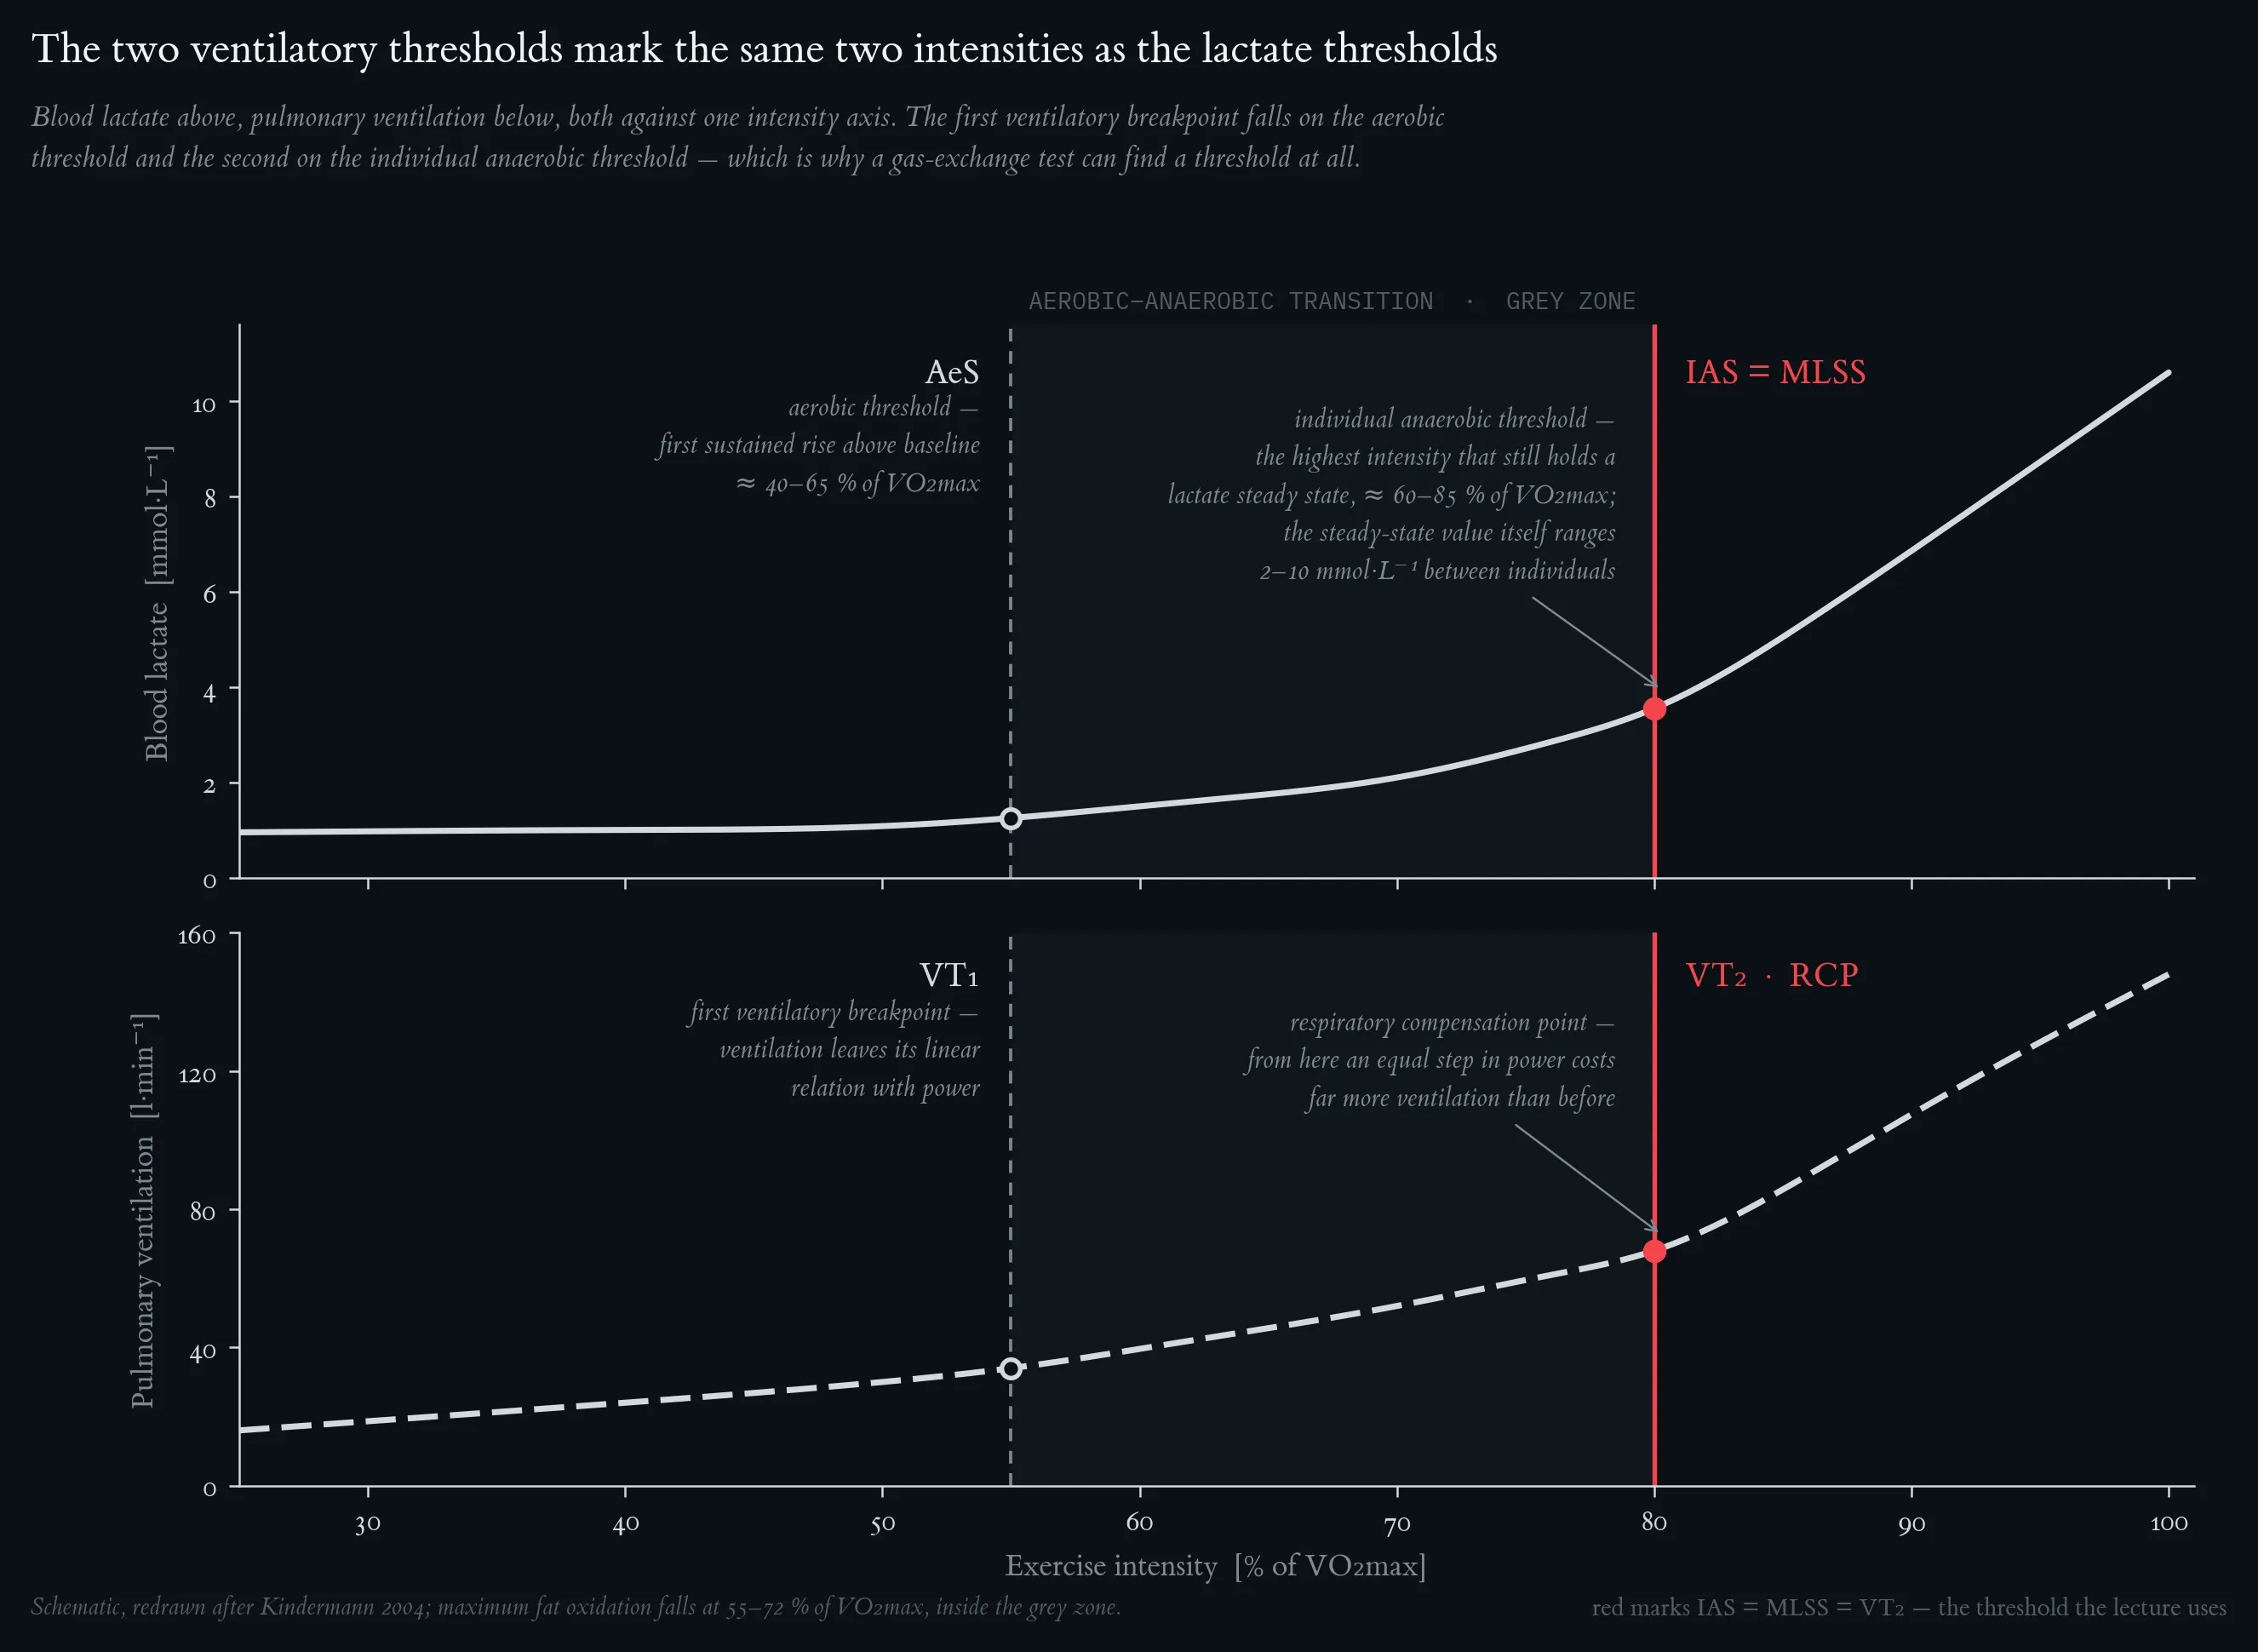
Schematic representation of the aerobic–anaerobic transition (grey zone). Top: blood-lactate curve with aerobic threshold (AeS) and individual anaerobic threshold (IAS ≙ MLSS). Bottom: pulmonary ventilation with the two ventilatory thresholds VT1 and VT2 (RCP). Redrawn after Kindermann (2004).
Lactate–velocity curve during incremental exercise (red) and lactate–time curve during recovery (blue). The dashed grey line marks L_end. The descending recovery curve crosses L_end at ≈ 2.7 min post-exercise (linear interpolation between R1 = 10.0 mmol/L at 1 min and R2 = 8.8 mmol/L at 3 min → L = 9.0 at t ≈ 2.7 min): this is the anchor. The dashed green line is the tangent from the anchor to the ascending exercise curve; the tangent contact on the exercise curve is the IAT. Vertical and horizontal projections give v_IAT and L_IAT respectively.
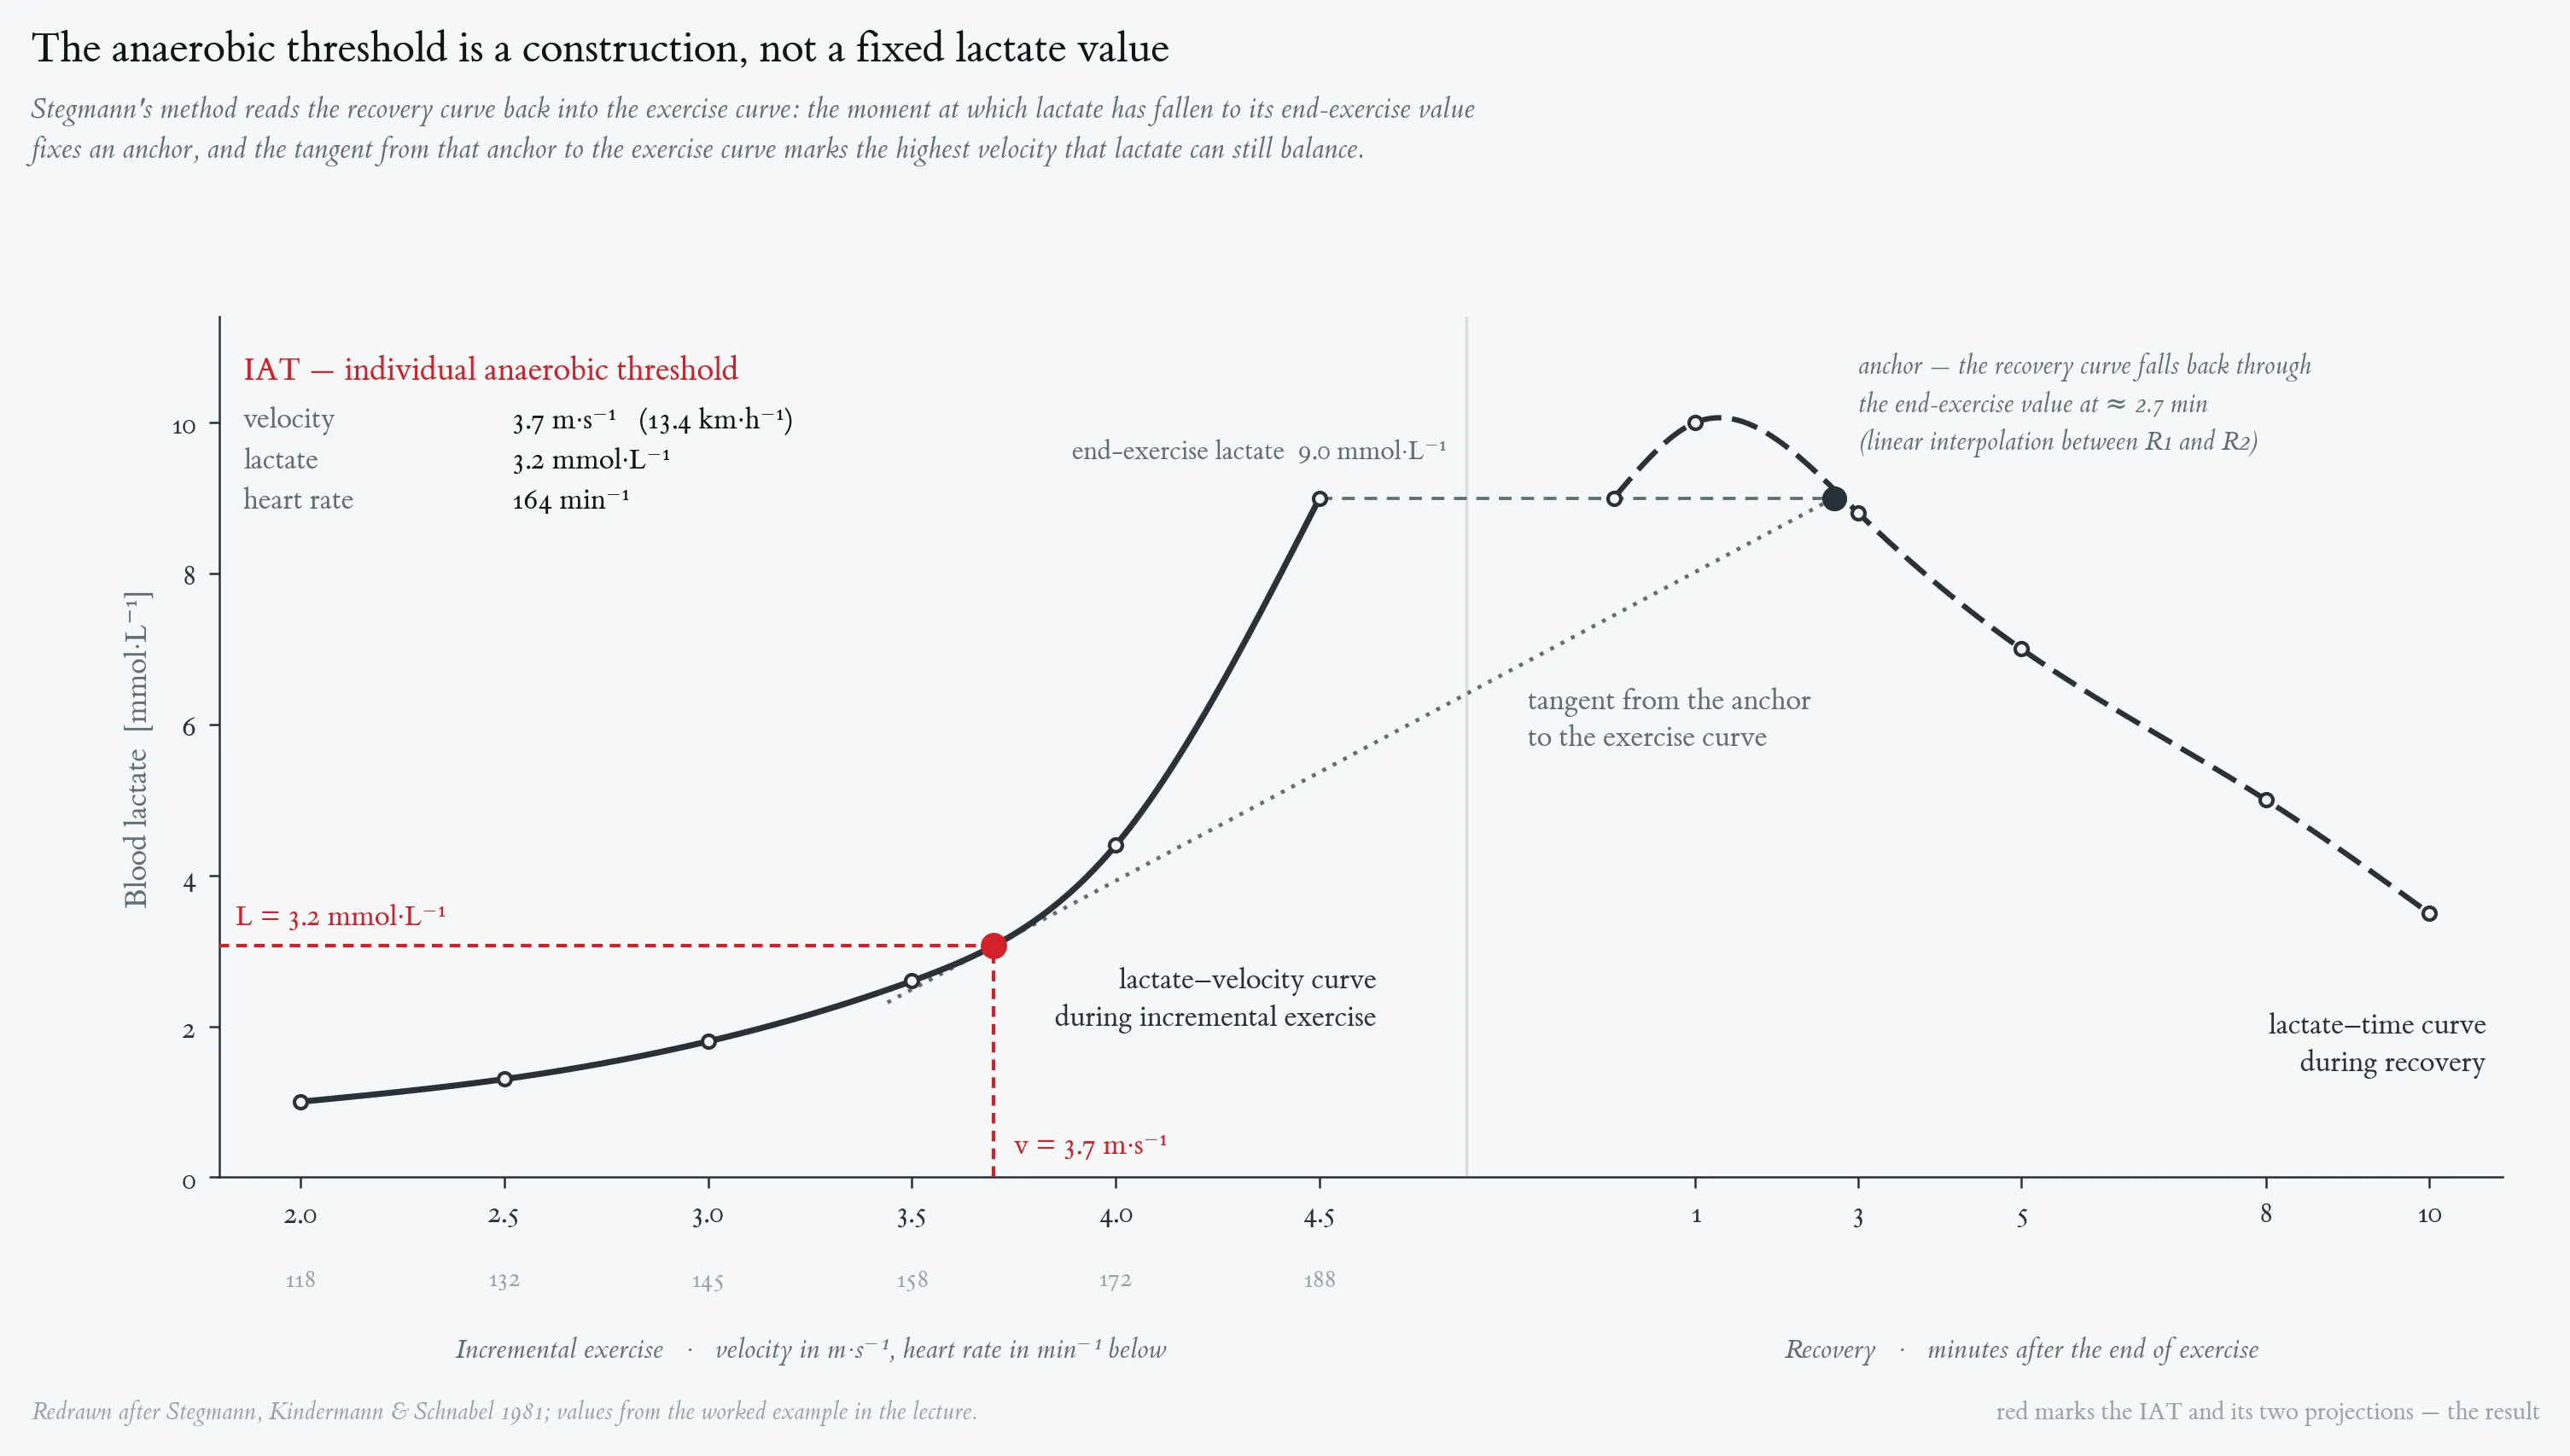
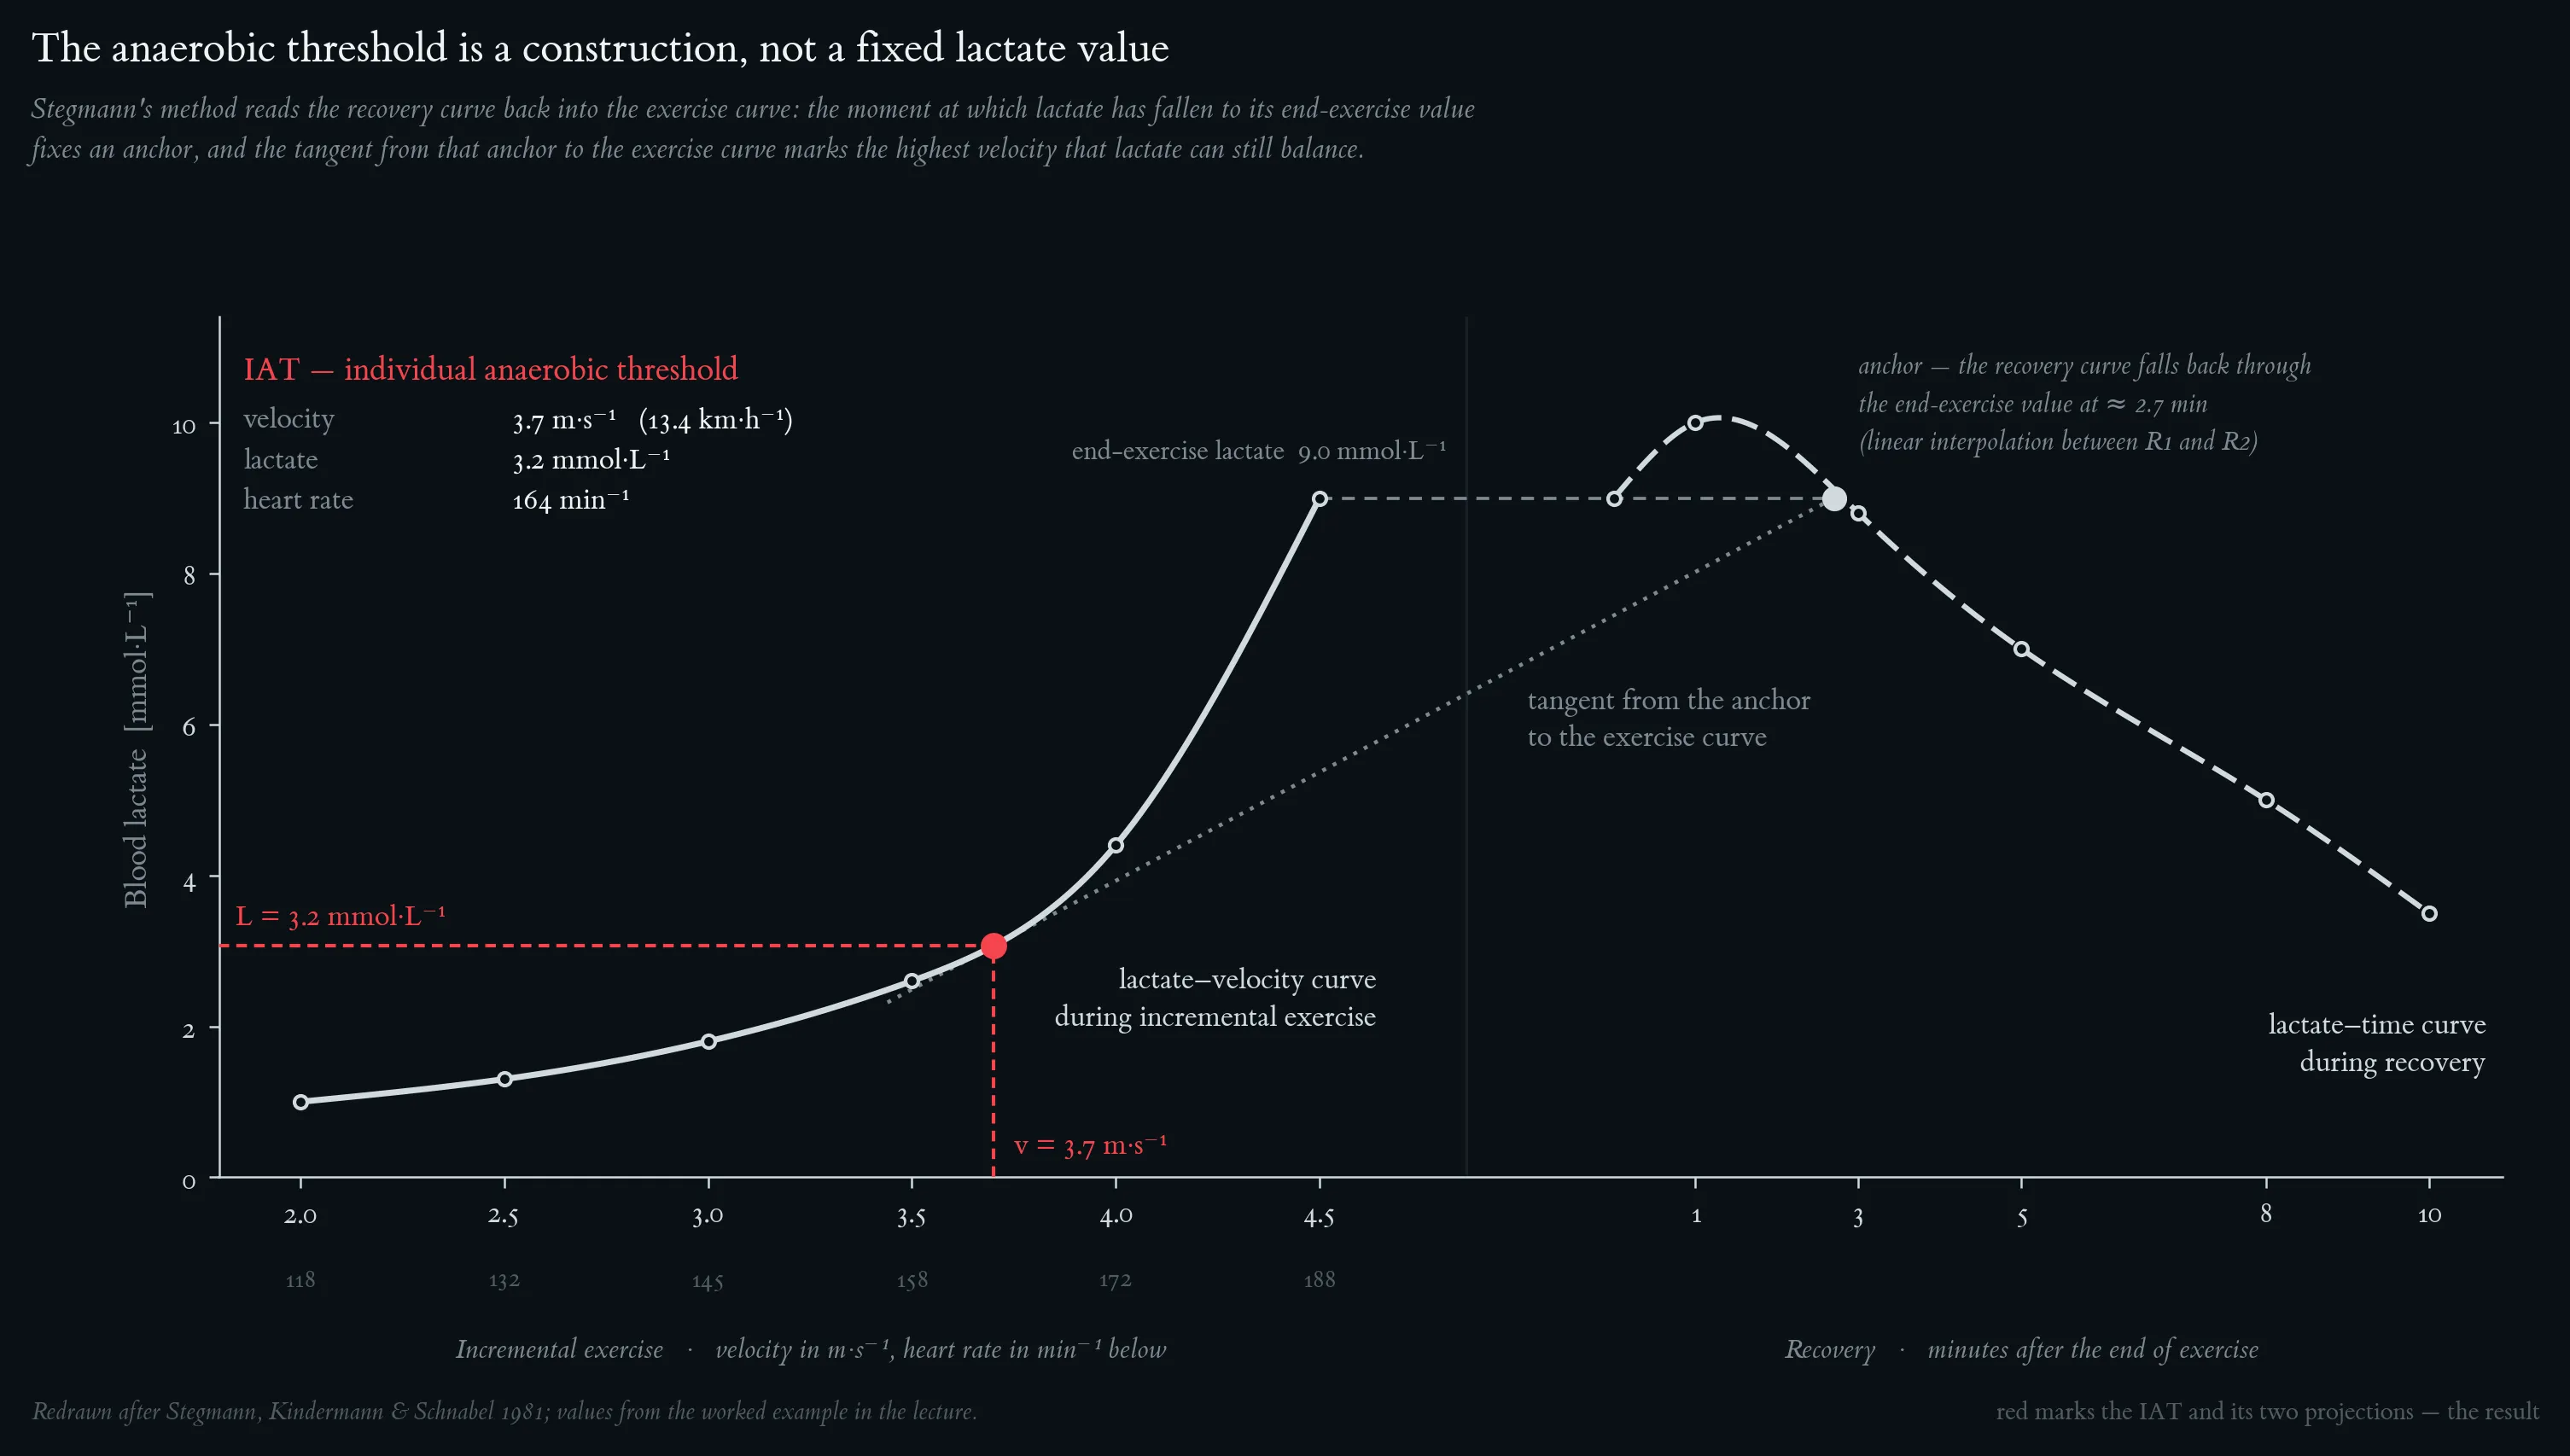
Lactate–velocity curve during incremental exercise (red) and lactate–time curve during recovery (blue). The dashed grey line marks L_end. The descending recovery curve crosses L_end at ≈ 2.7 min post-exercise (linear interpolation between R1 = 10.0 mmol/L at 1 min and R2 = 8.8 mmol/L at 3 min → L = 9.0 at t ≈ 2.7 min): this is the anchor. The dashed green line is the tangent from the anchor to the ascending exercise curve; the tangent contact on the exercise curve is the IAT. Vertical and horizontal projections give v_IAT and L_IAT respectively.
Typical blood-lactate ranges encountered during the four endurance-training zones, expressed as a percentage of the individual anaerobic threshold (IAS). Redrawn after Kindermann (2004).
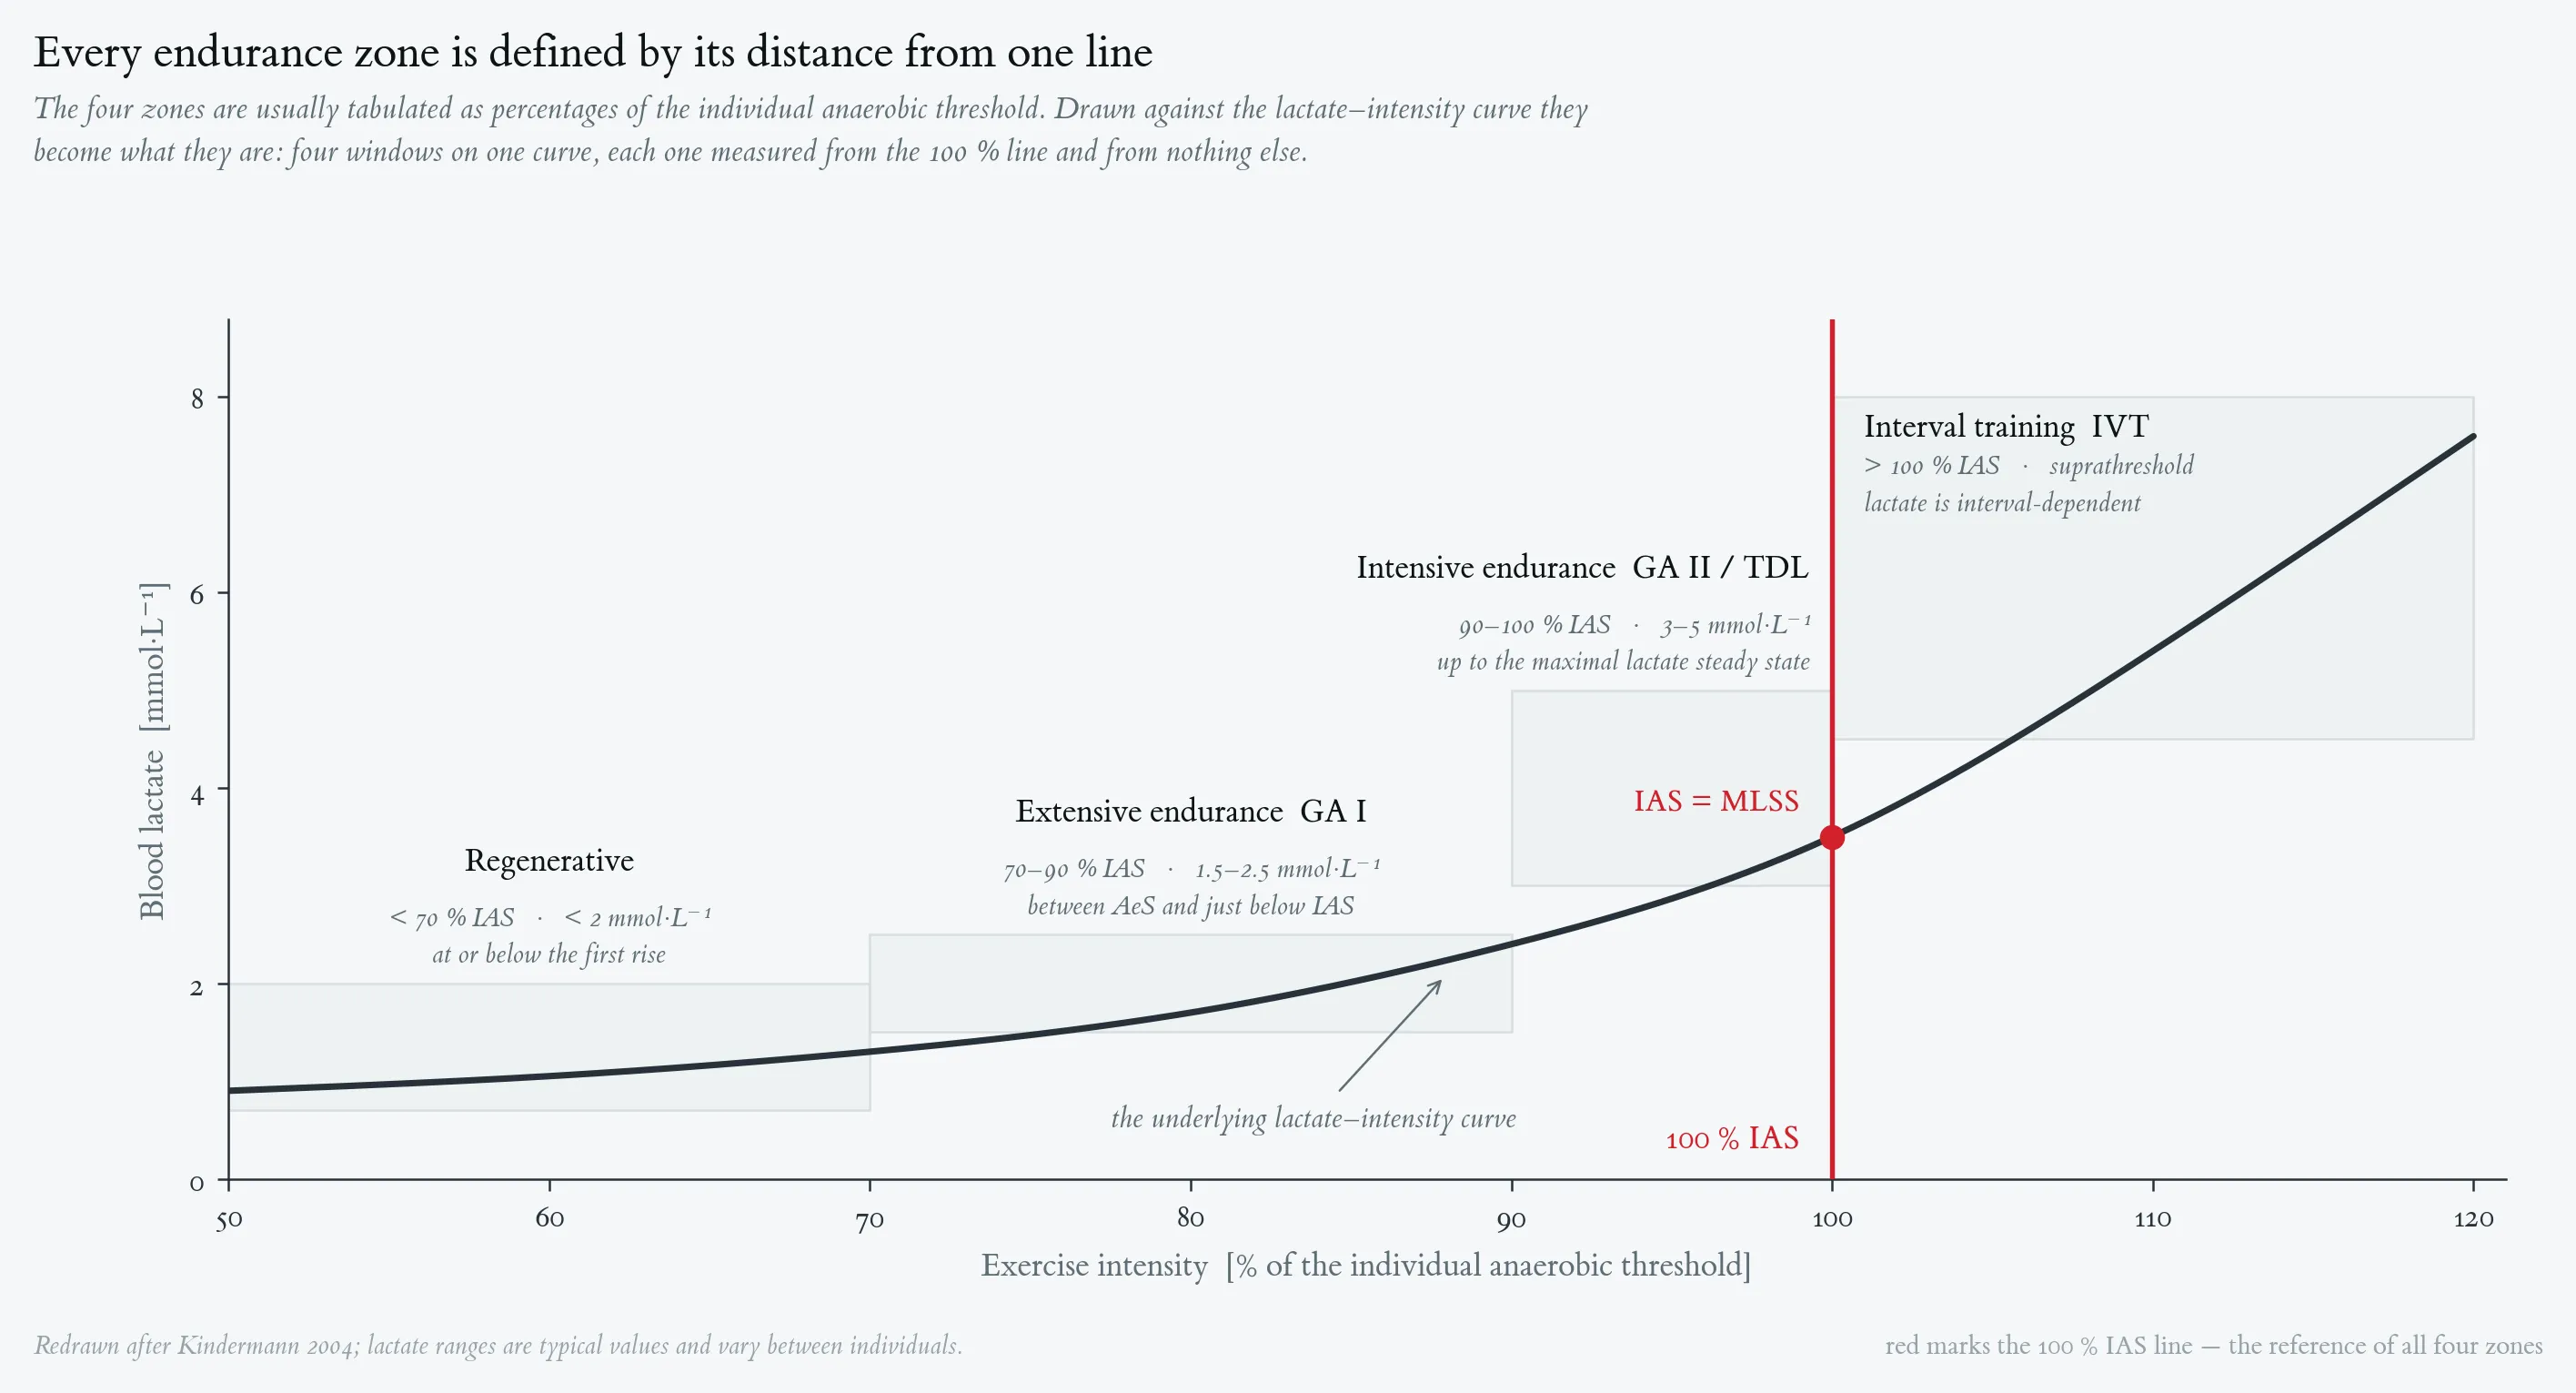
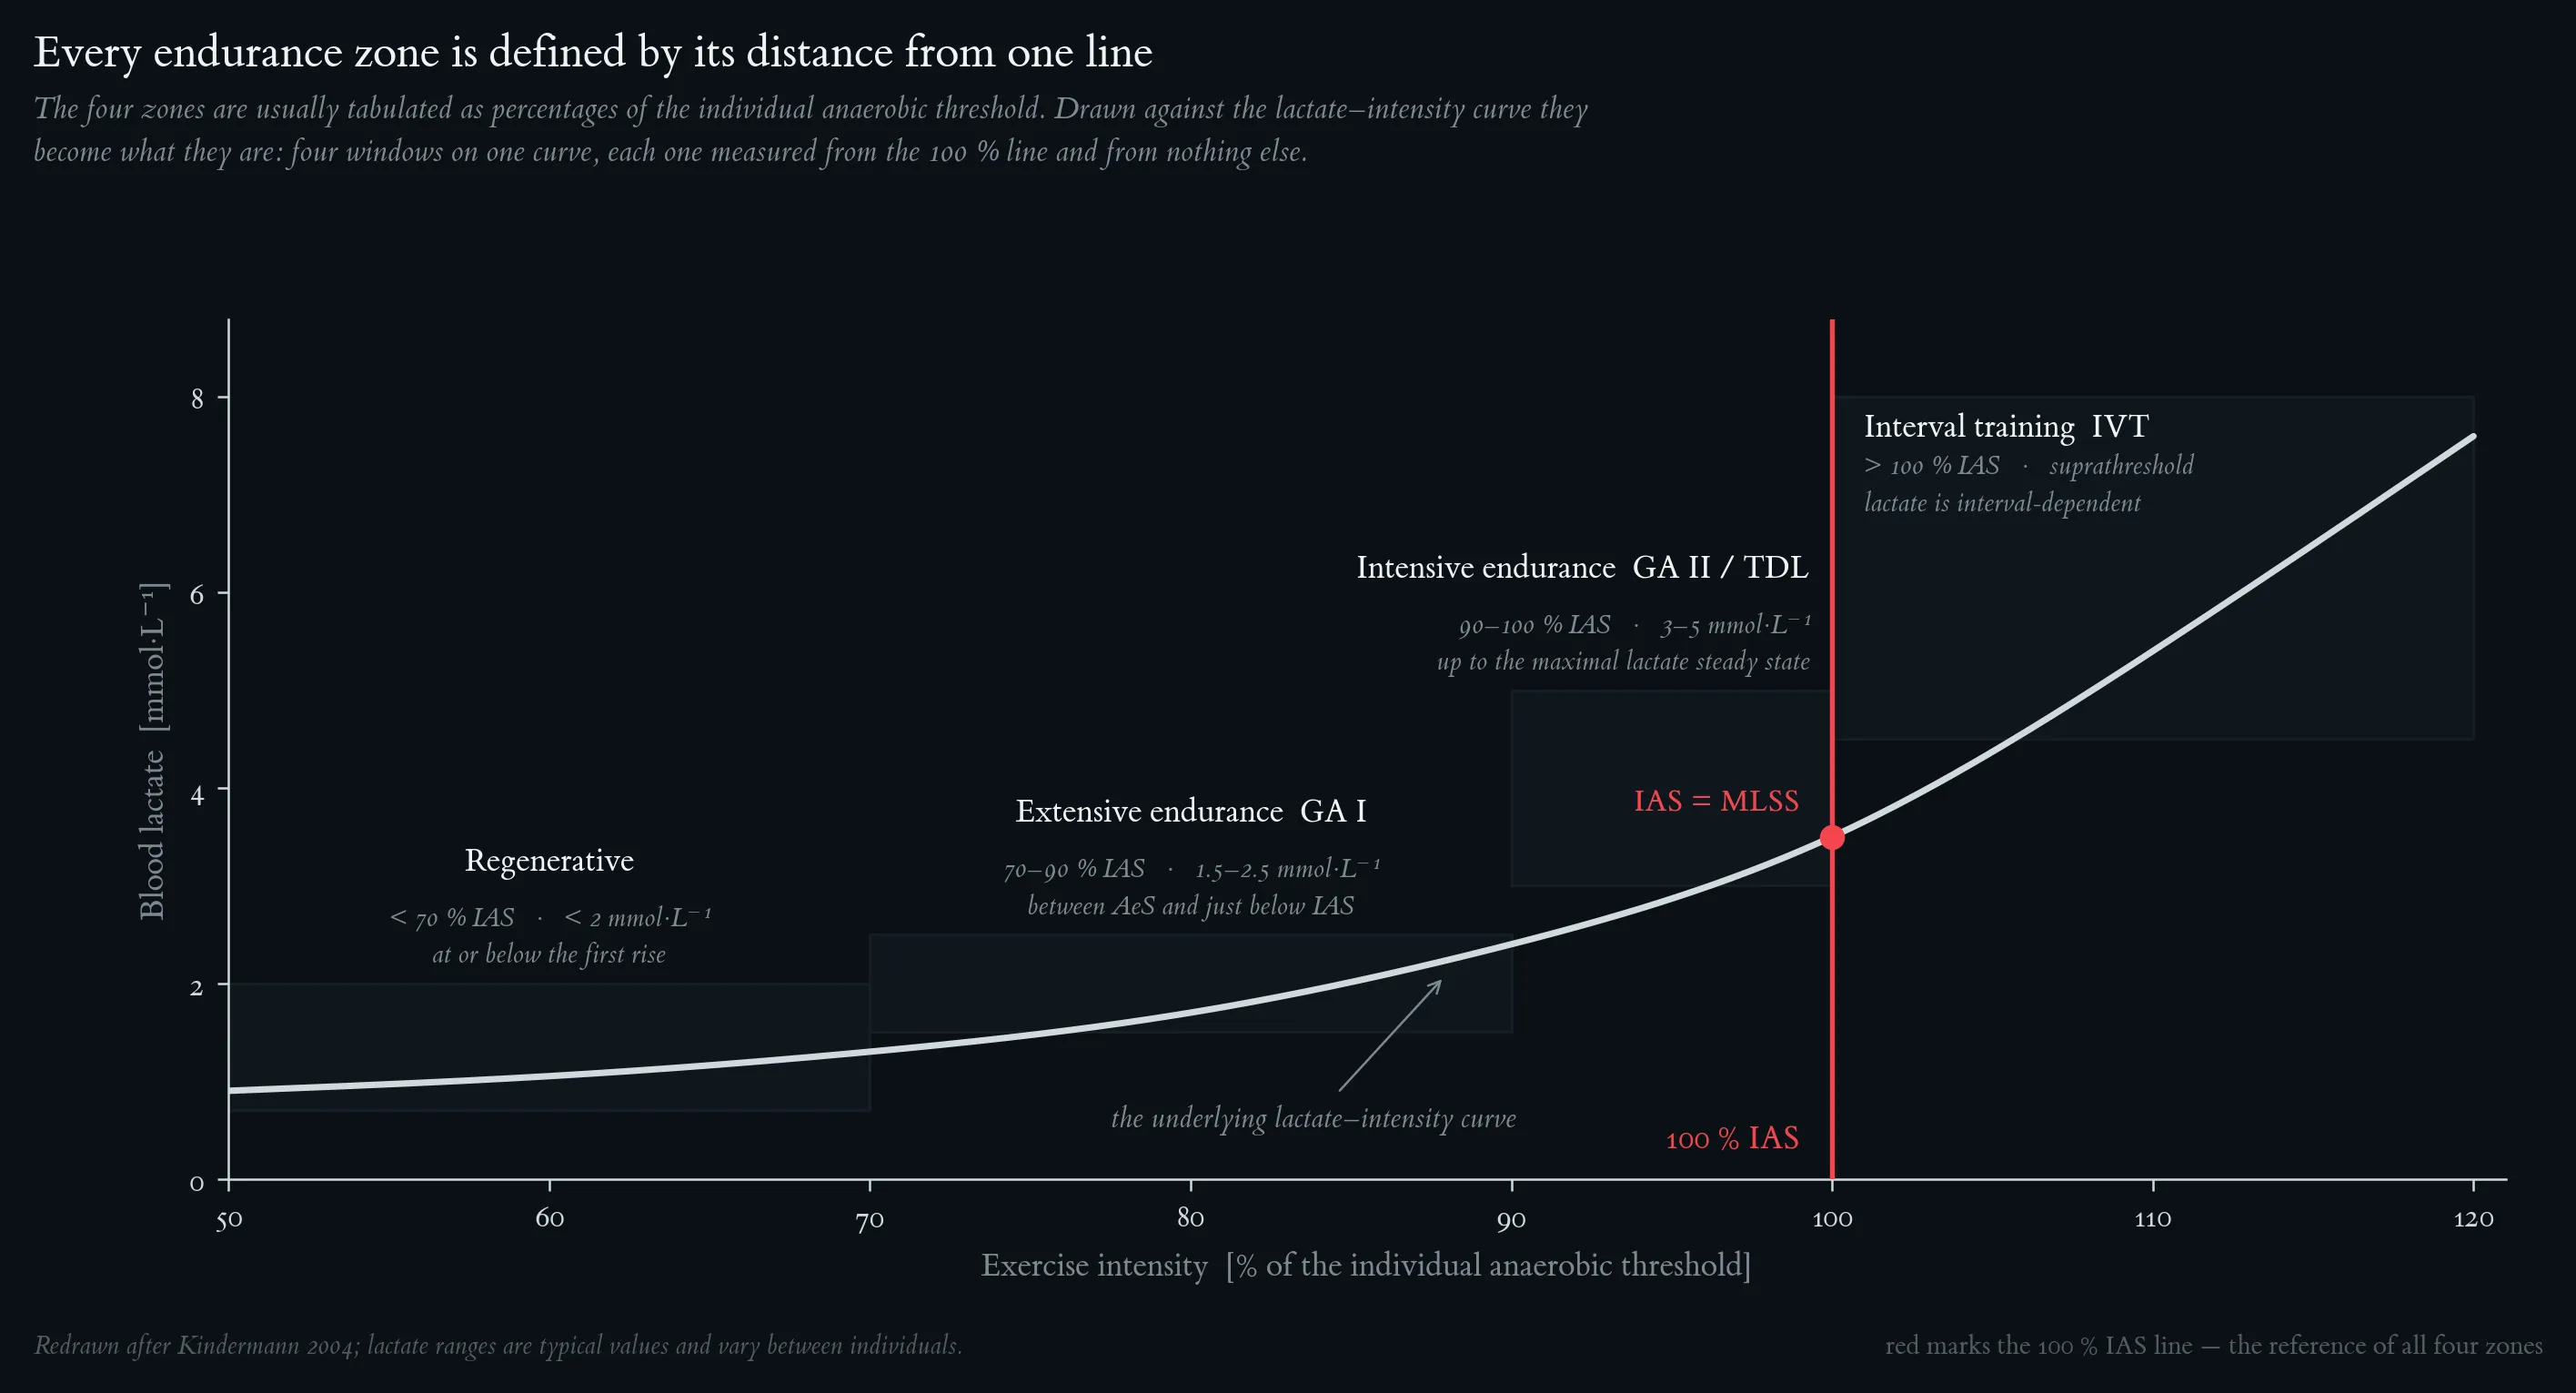
Typical blood-lactate ranges encountered during the four endurance-training zones, expressed as a percentage of the individual anaerobic threshold (IAS). Redrawn after Kindermann (2004).
Metabolic 2: Lactate – From Metabolic Waste Product to Central Metabolite
Both bars sit above the line at which the two fluxes would be equal — lactate, not glucose, is the primary circulating carbohydrate fuel. Feeding brings the two close together; fasting pulls them apart, and lactate then turns over two and a half times as fast as glucose. After Hui et al., Nature 551: 115–118 (2017).
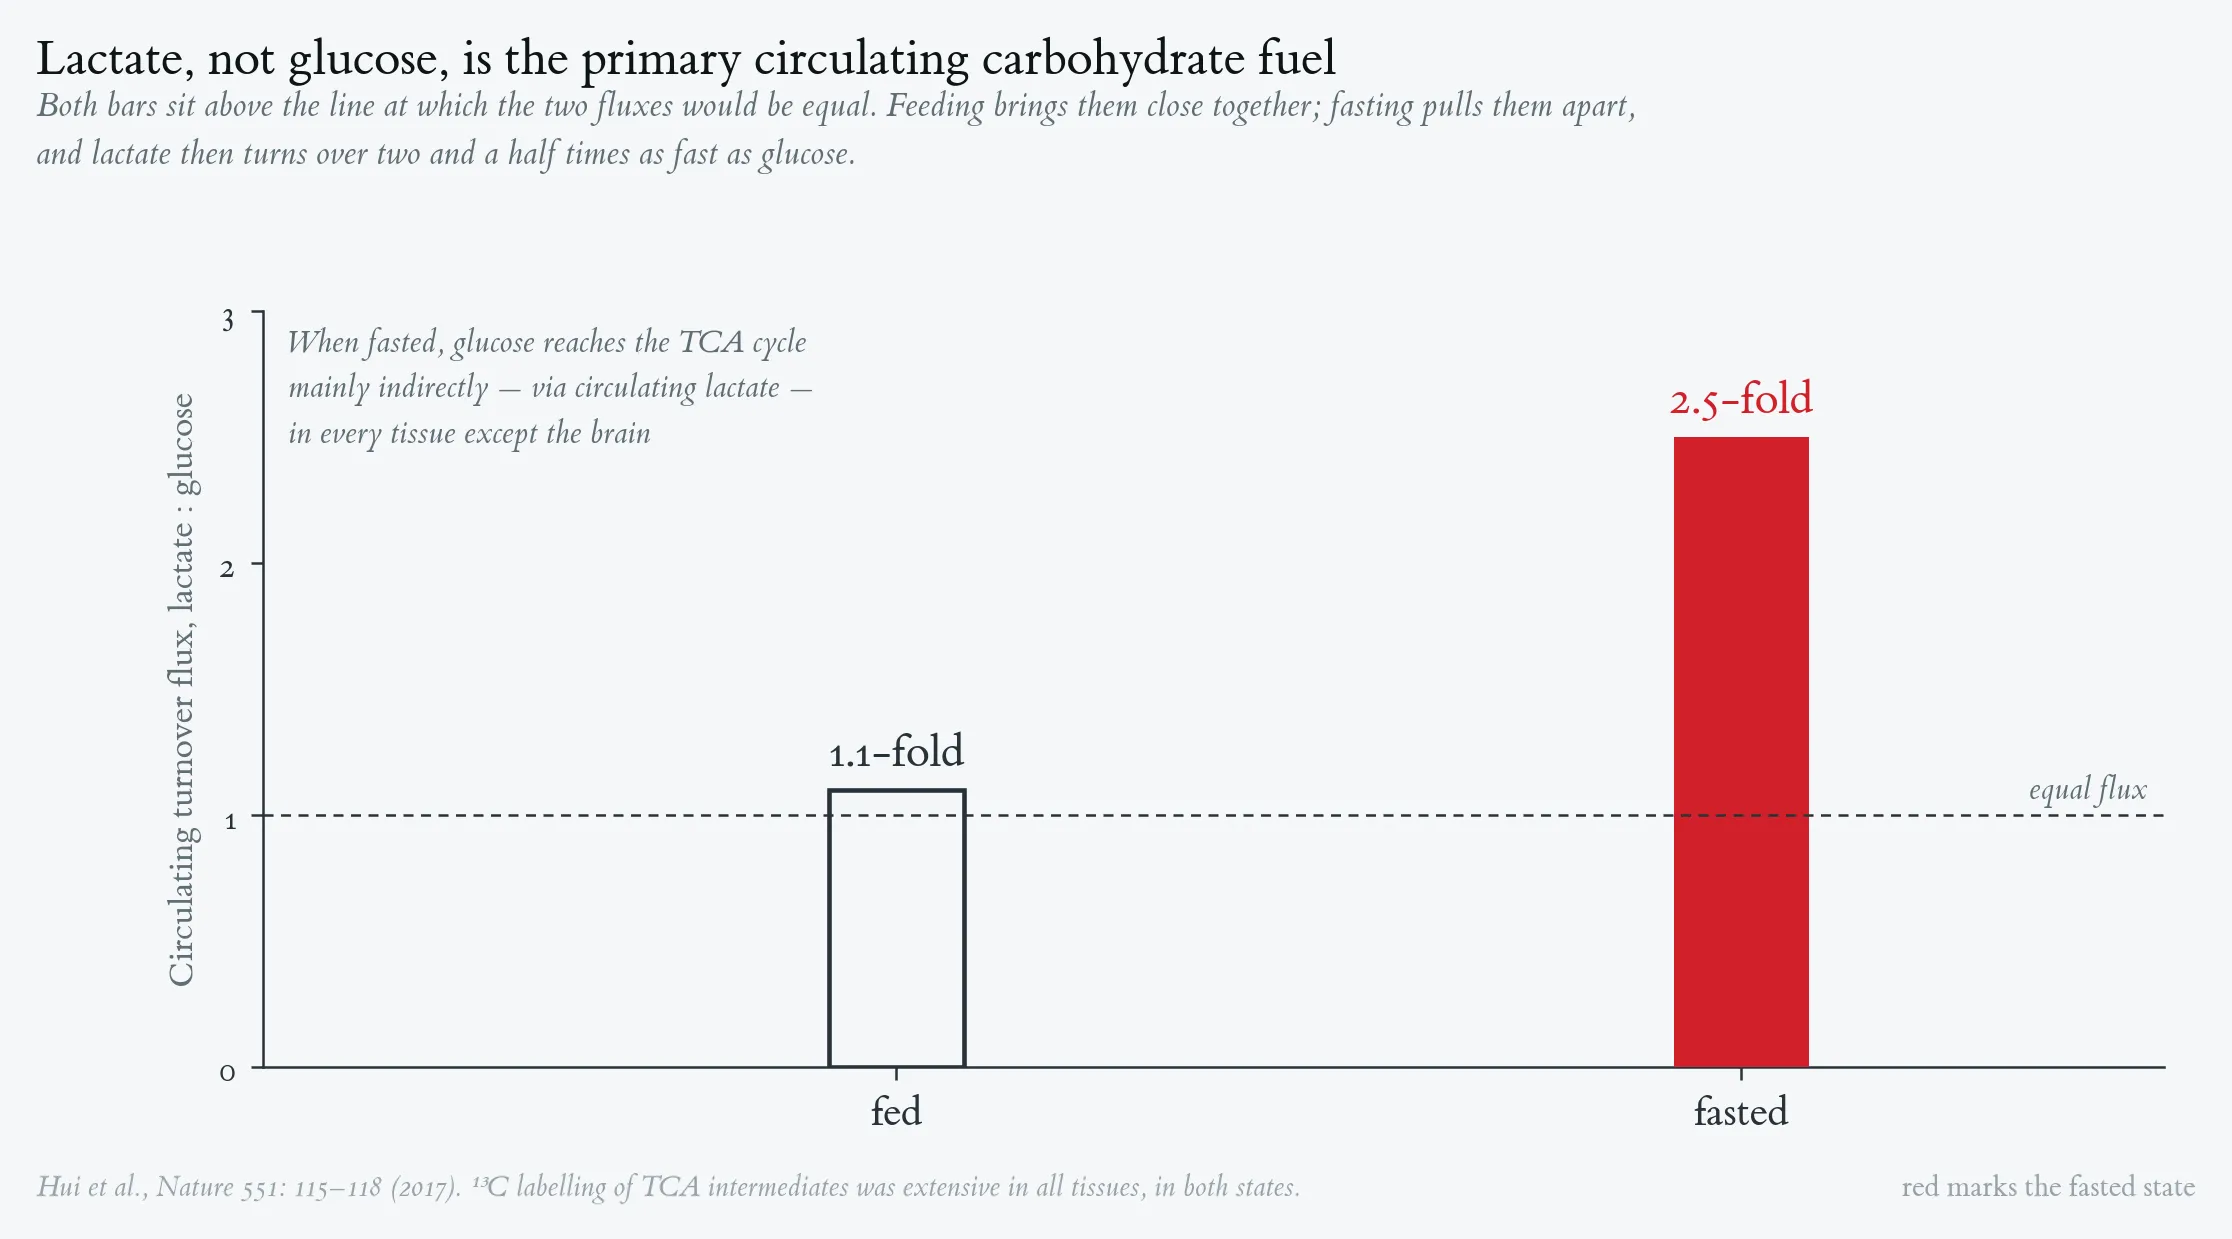
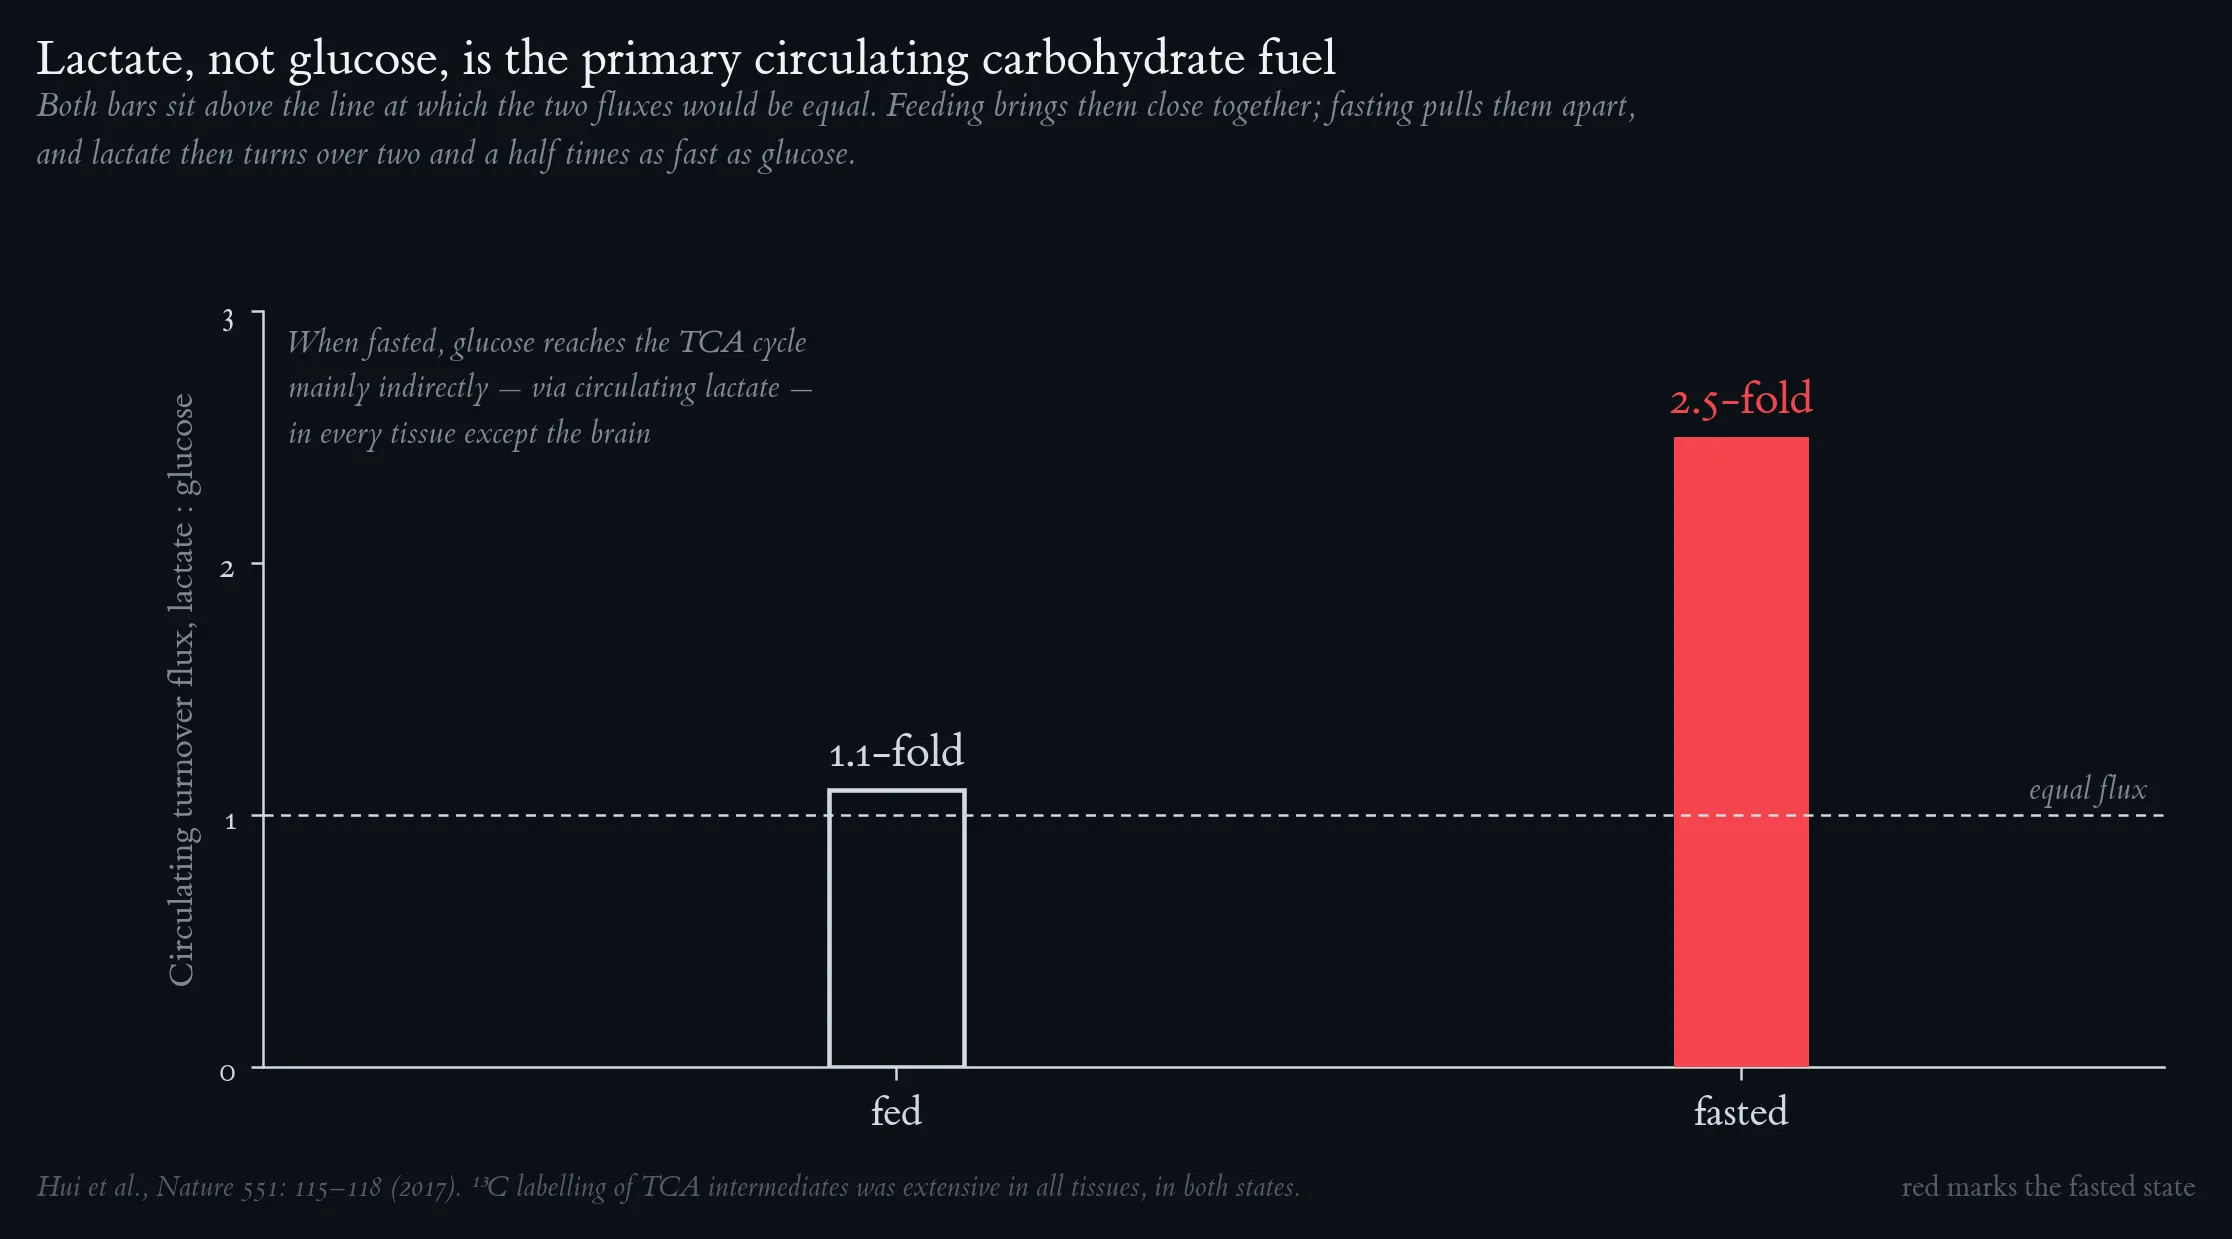
Both bars sit above the line at which the two fluxes would be equal — lactate, not glucose, is the primary circulating carbohydrate fuel. Feeding brings the two close together; fasting pulls them apart, and lactate then turns over two and a half times as fast as glucose. After Hui et al., Nature 551: 115–118 (2017).
The enteric rise from intestinal metabolism of the ingested carbohydrate appears while blood glucose is still at its fasting value; the larger systemic rise follows, synchronous with the glucose peak, and accounts for roughly 38 % of the 75 g load. Glycolysis is not the emergency route — it is the ordinary one. Schematic after Leija et al. (2024); the ordering and timing of the two rises are the finding.
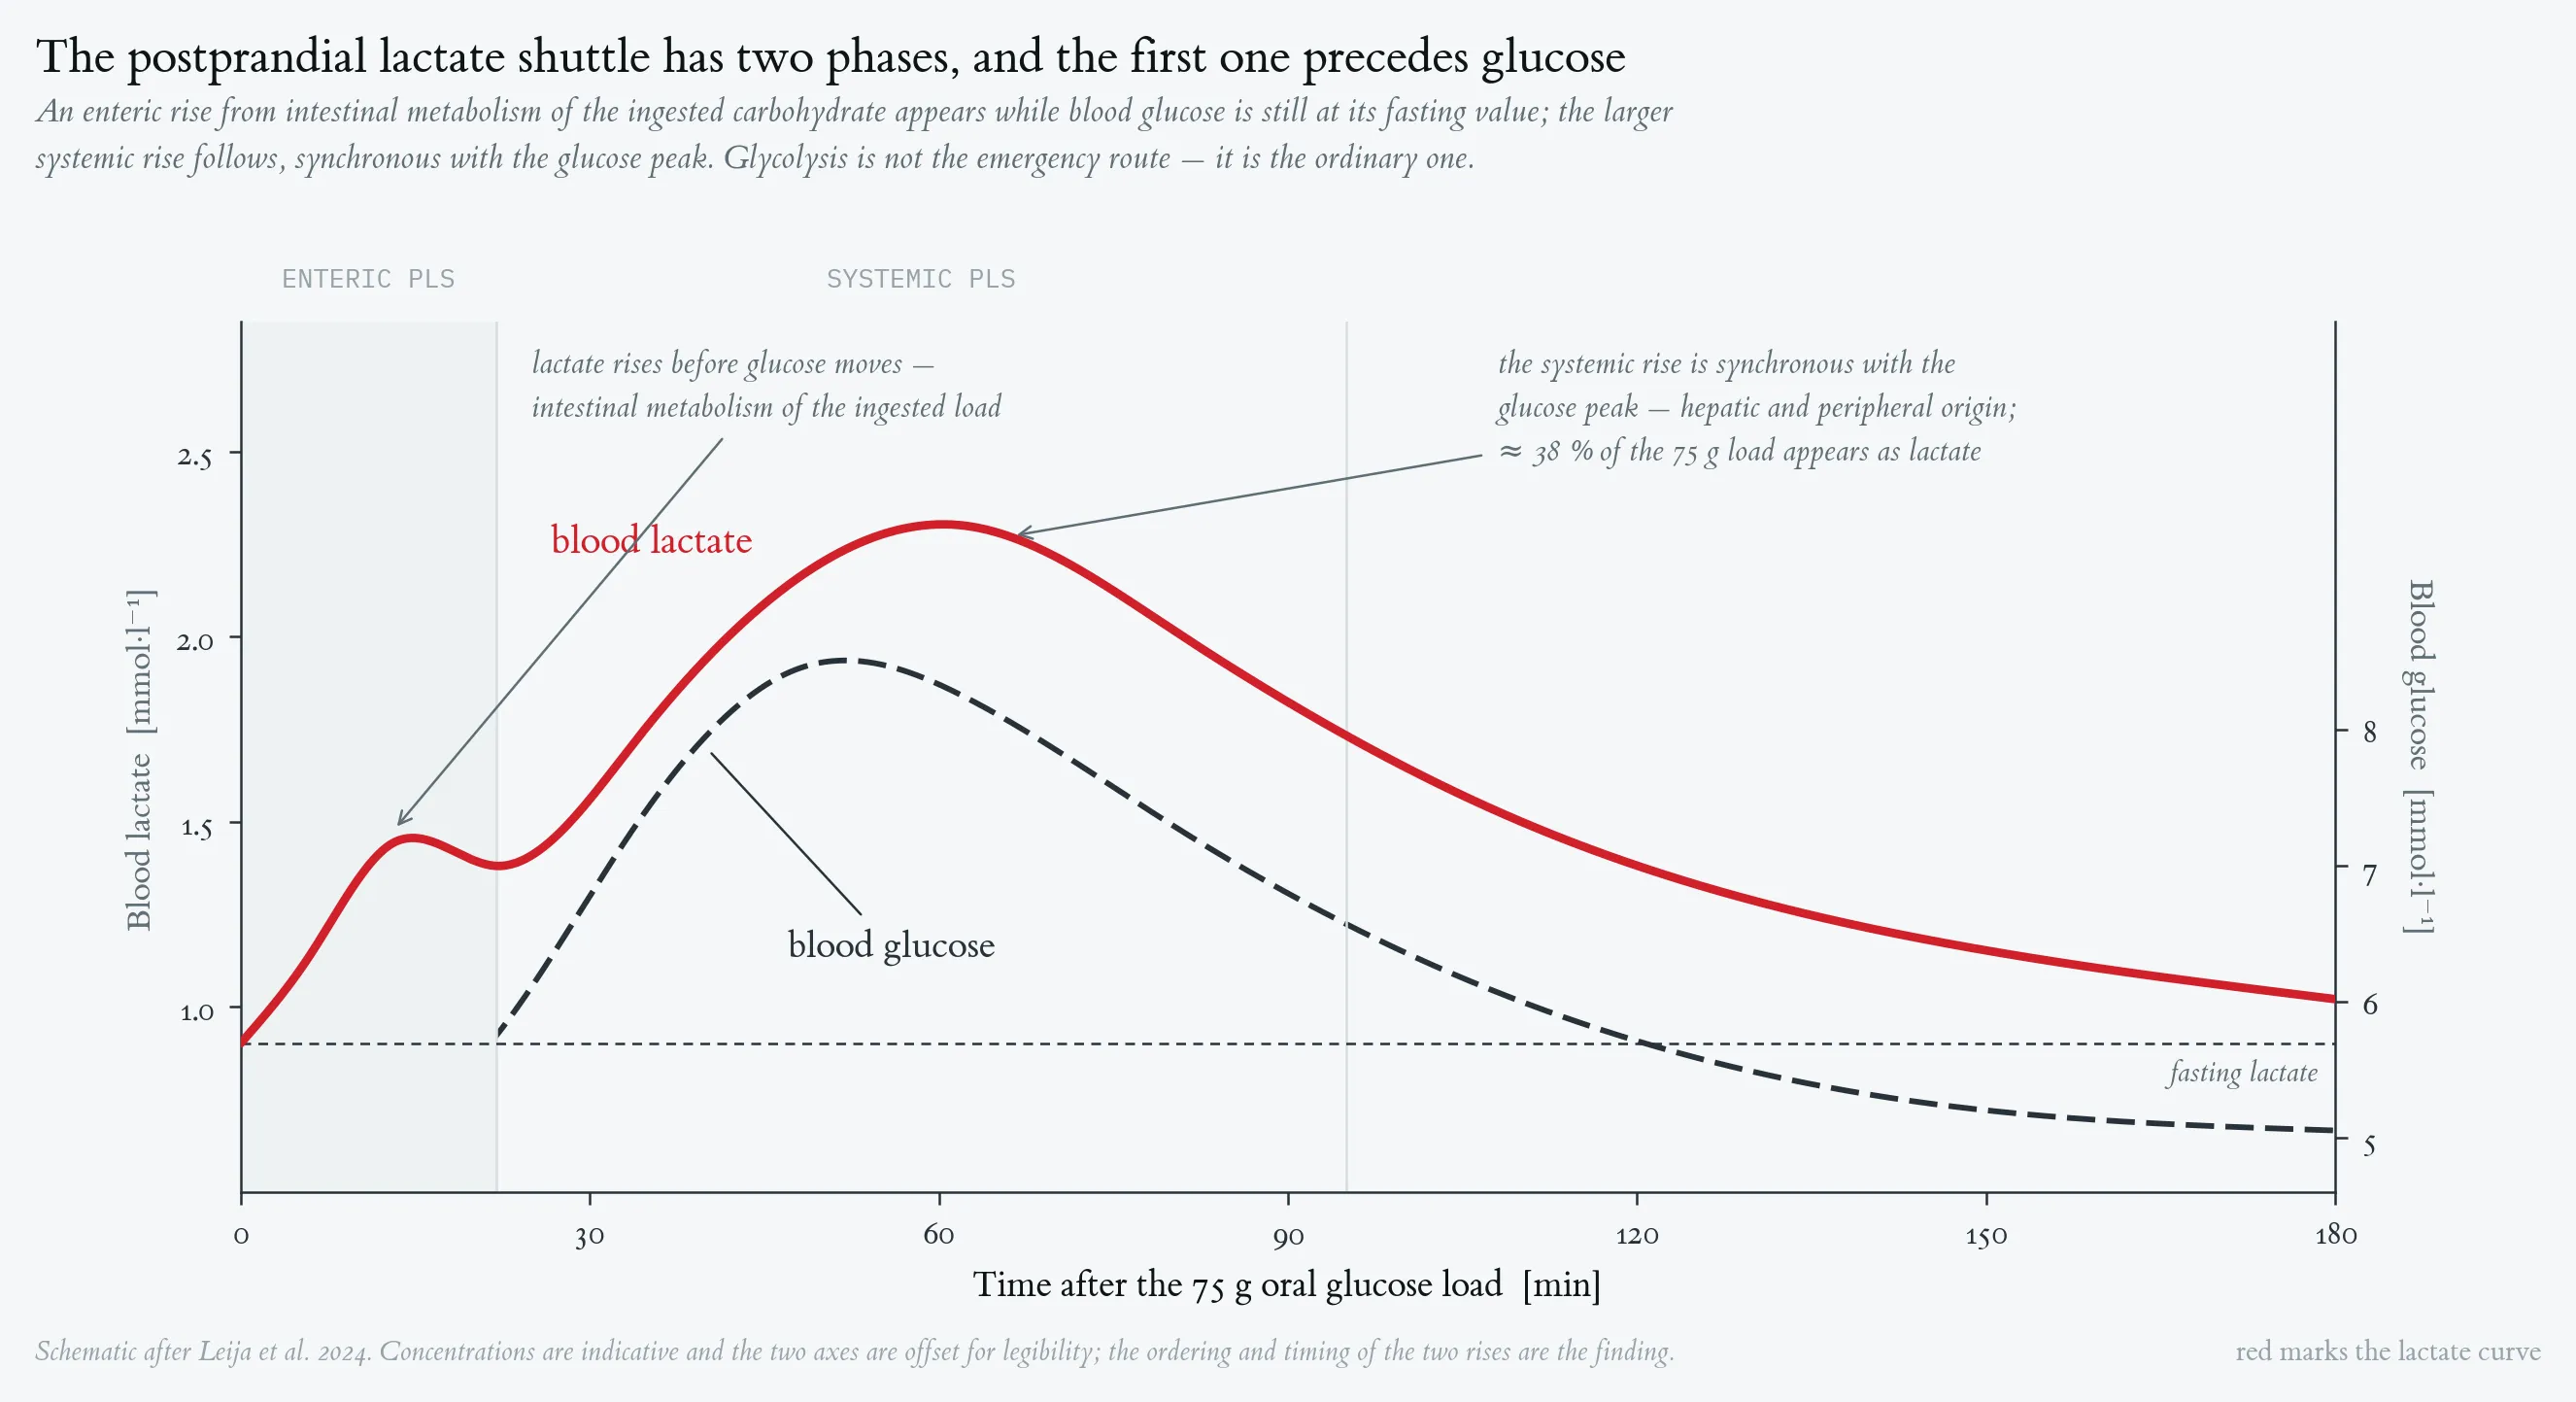
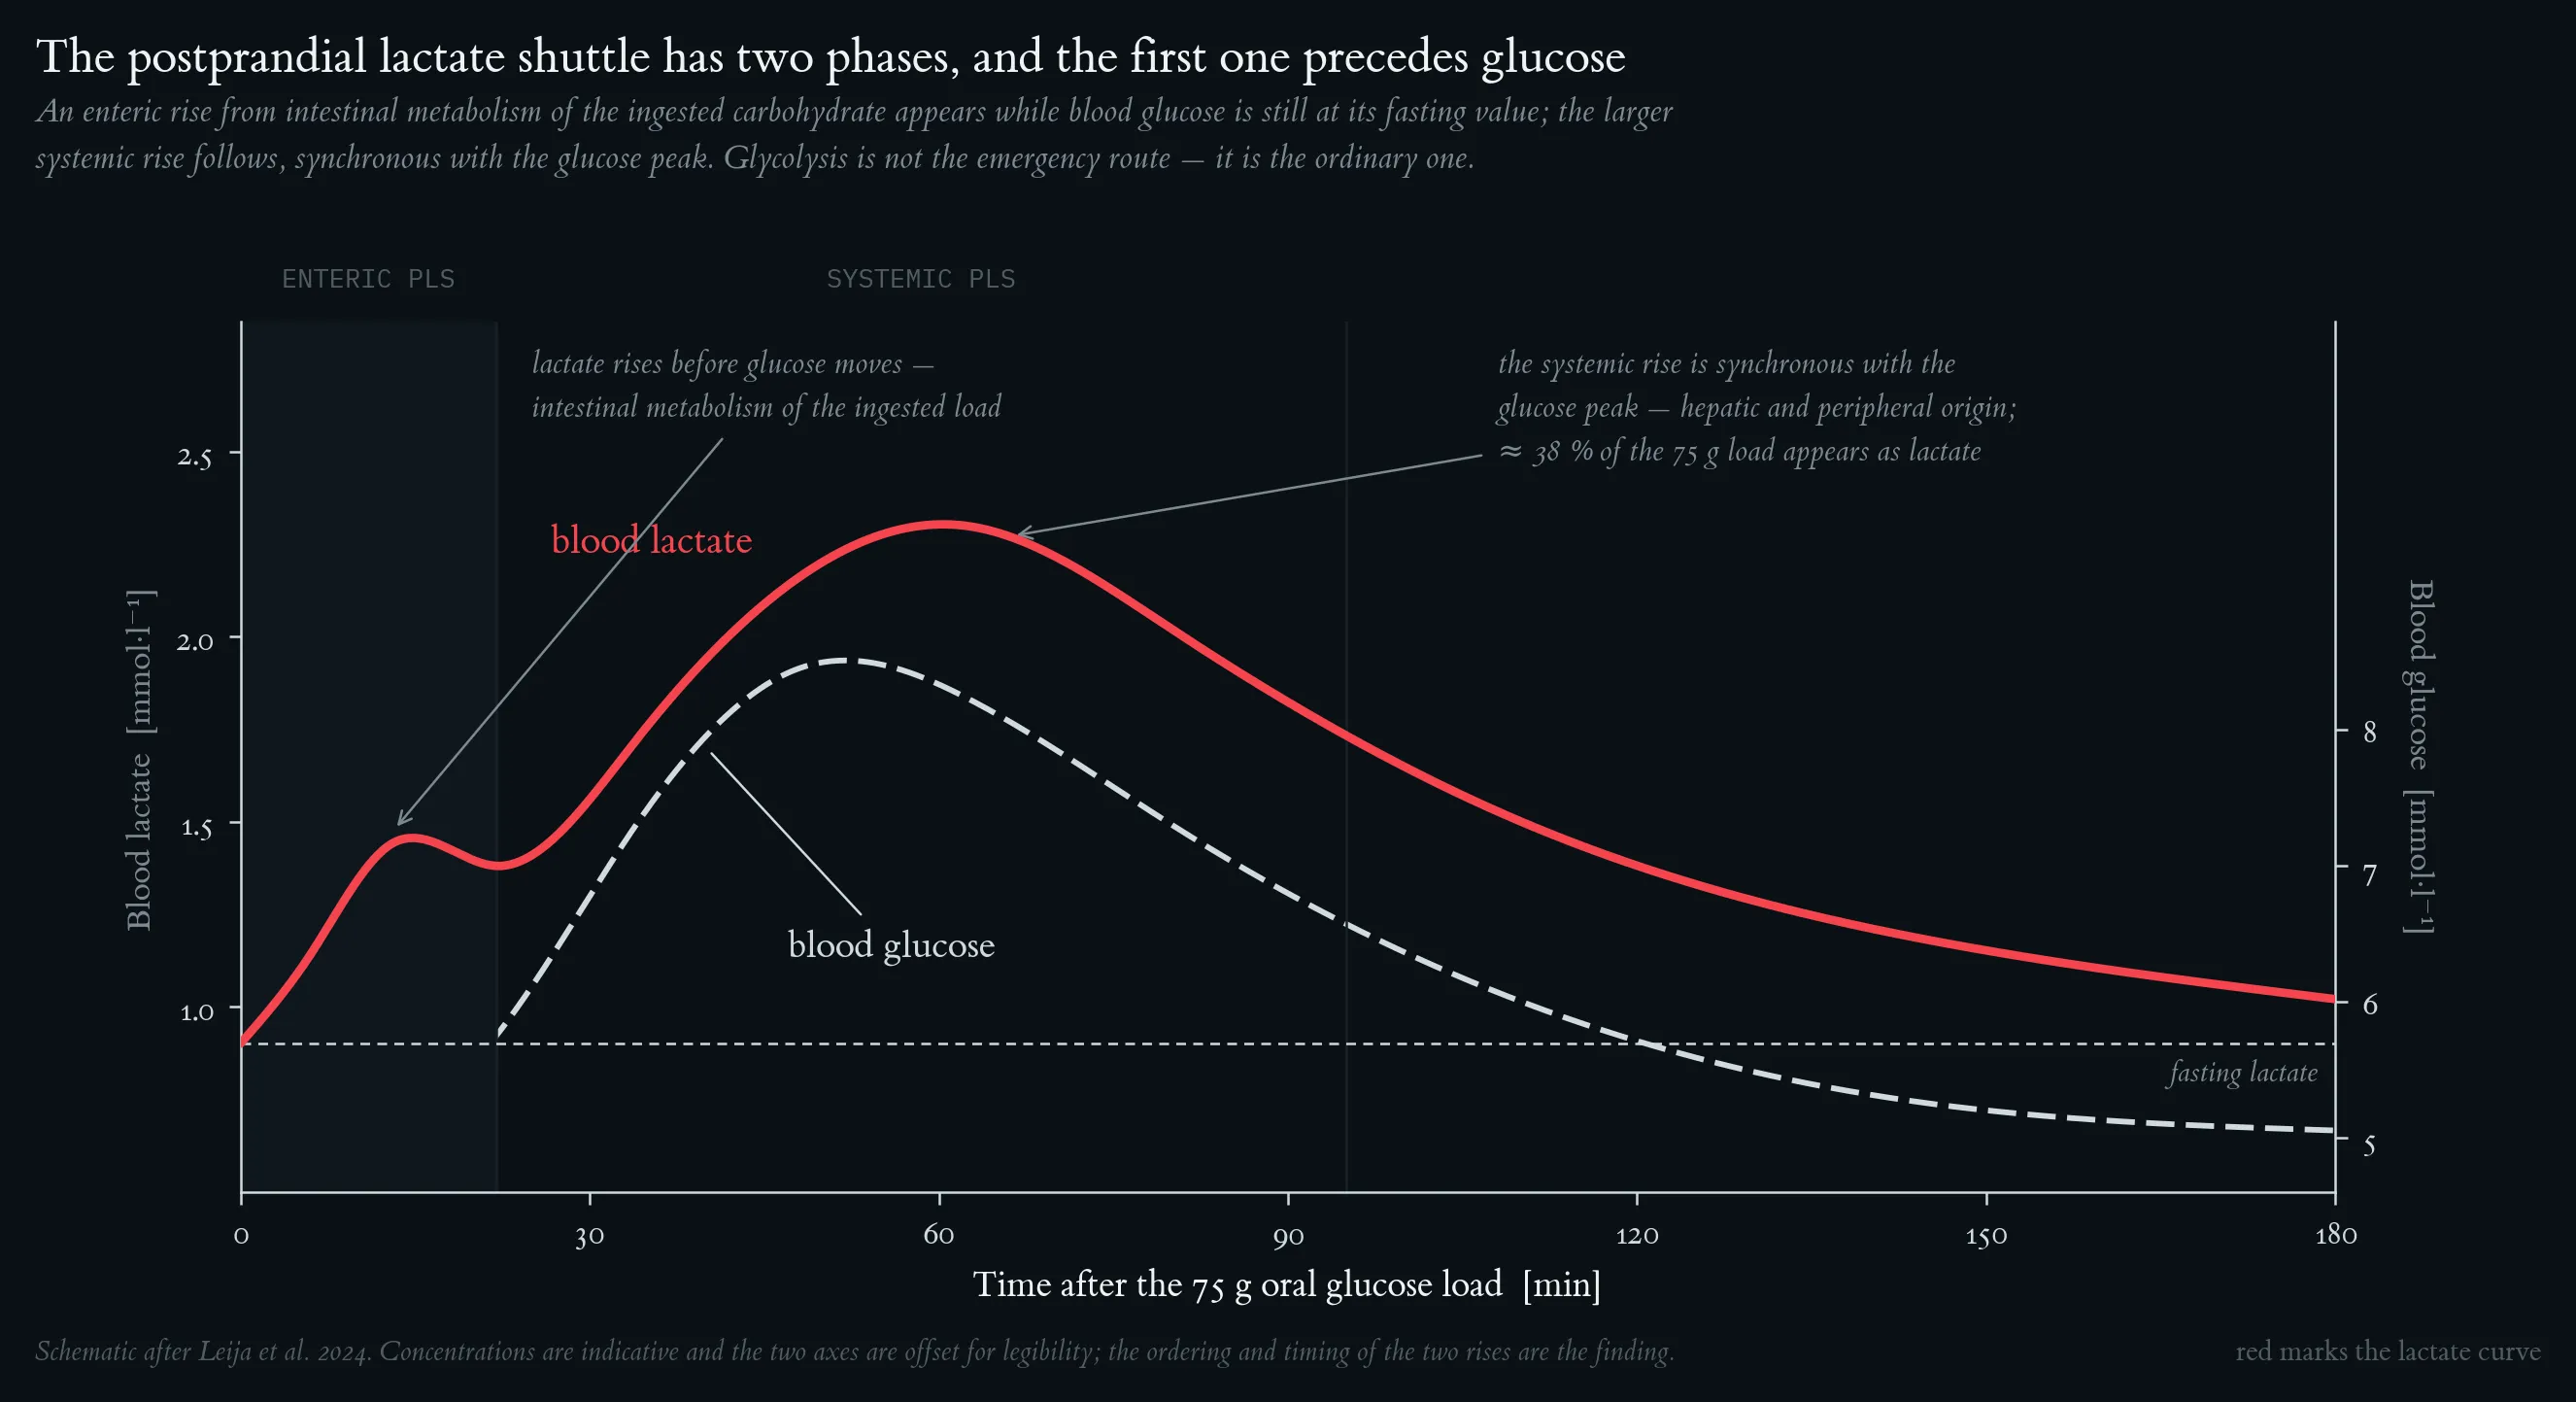
The enteric rise from intestinal metabolism of the ingested carbohydrate appears while blood glucose is still at its fasting value; the larger systemic rise follows, synchronous with the glucose peak, and accounts for roughly 38 % of the 75 g load. Glycolysis is not the emergency route — it is the ordinary one. Schematic after Leija et al. (2024); the ordering and timing of the two rises are the finding.